. 2022 May 3:13:841716.
doi: 10.3389/fimmu.2022.841716. eCollection 2022.

HDAC Inhibition as Potential Therapeutic Strategy to Restore the Deregulated Immune Response in Severe COVID-19

Affiliations

HDAC Inhibition as Potential Therapeutic Strategy to Restore the Deregulated Immune Response in Severe COVID-19

Chiara Ripamonti et al. Front Immunol. .

Abstract

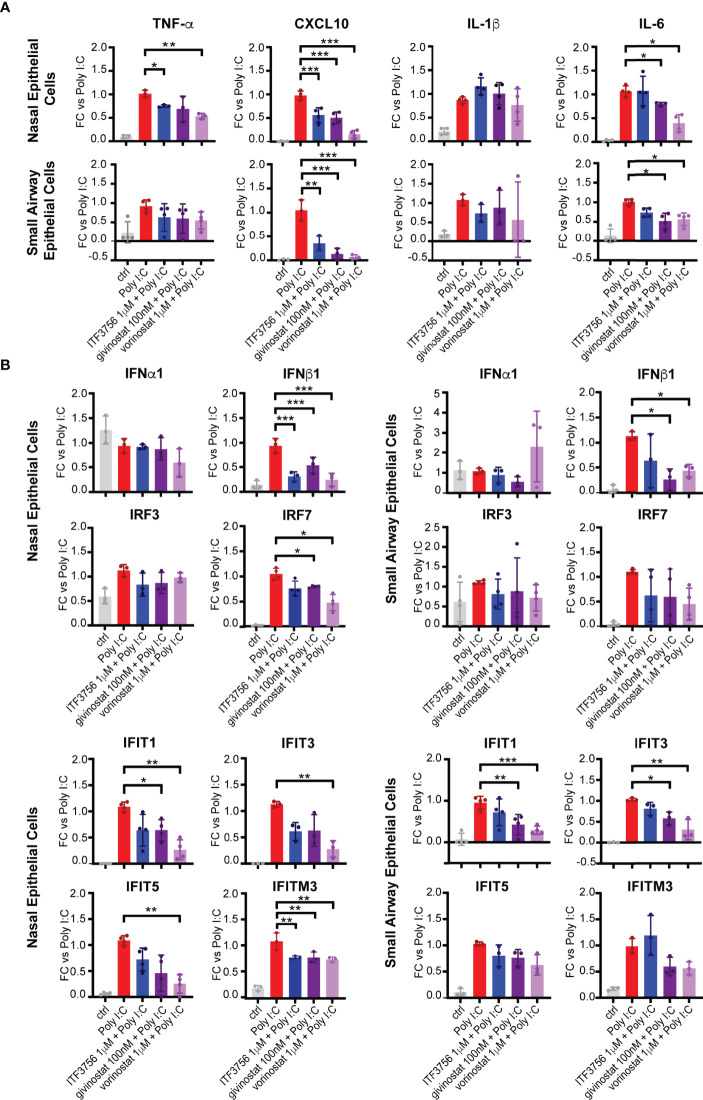
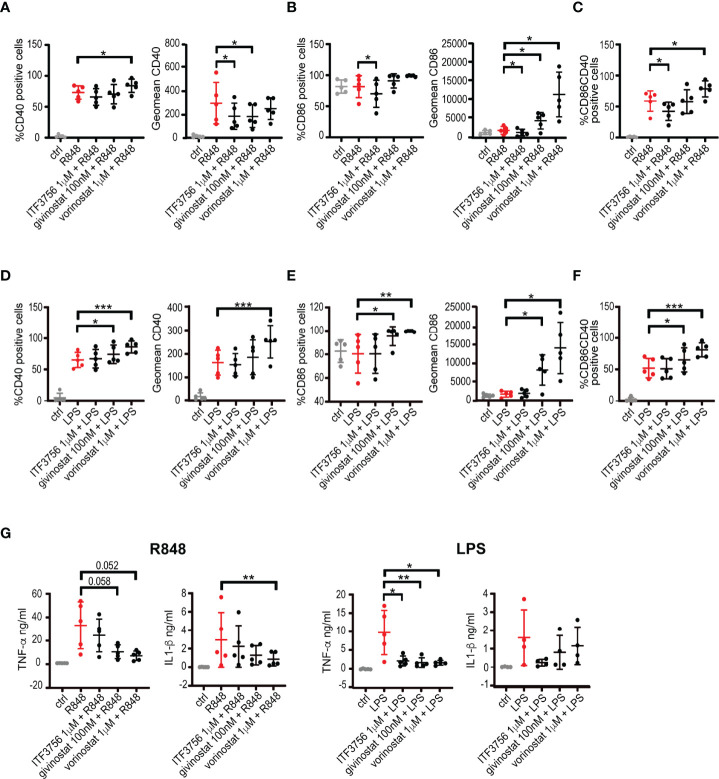
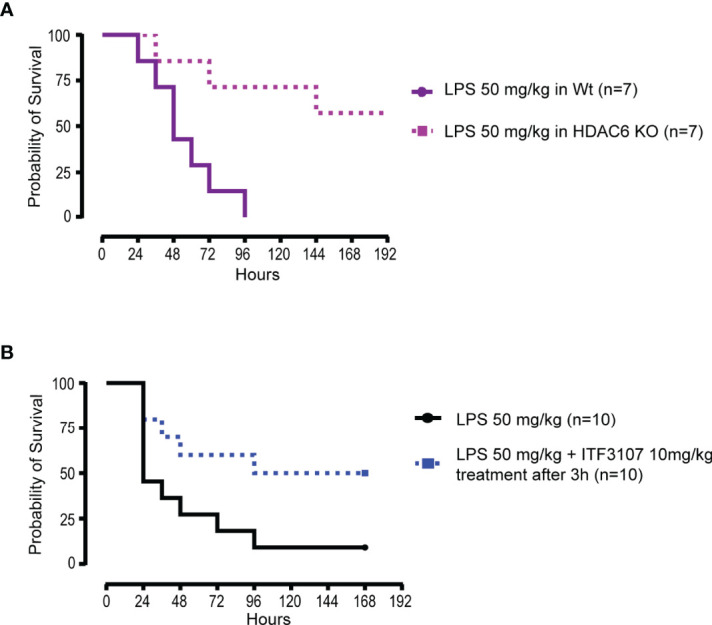
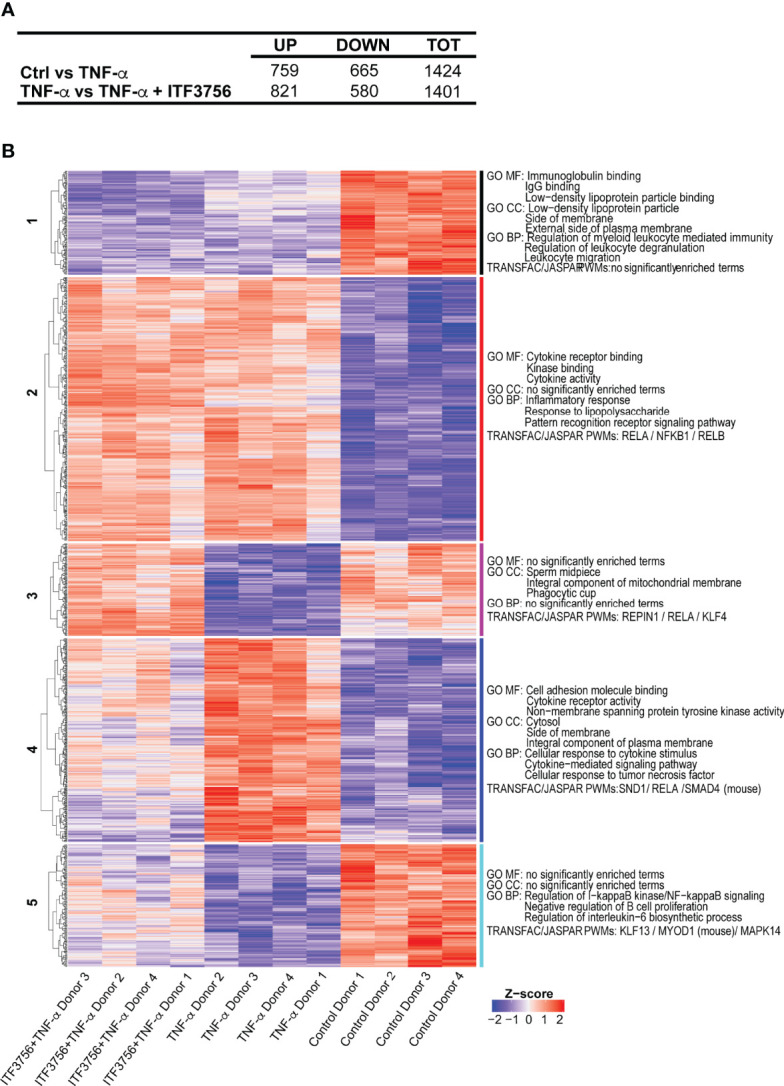
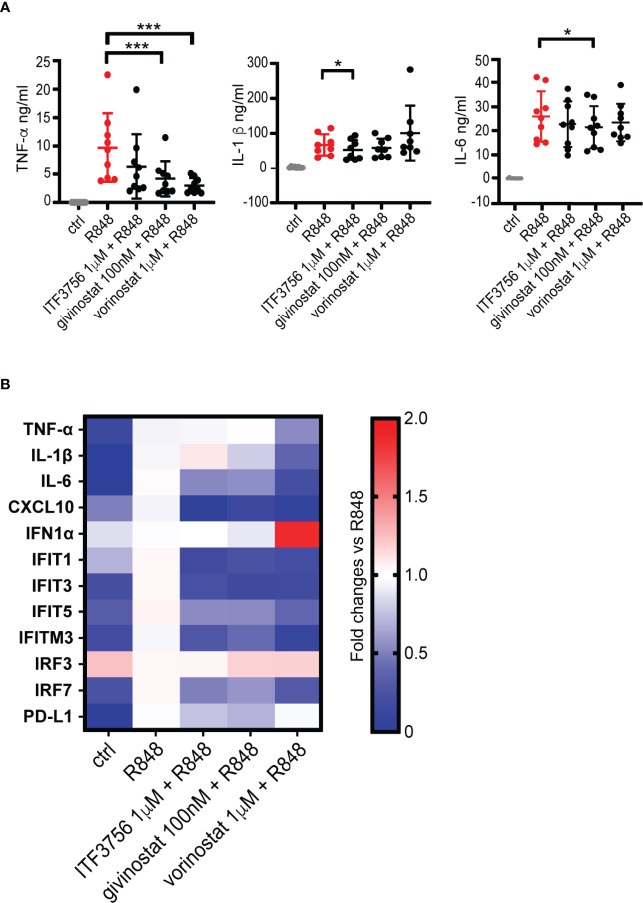
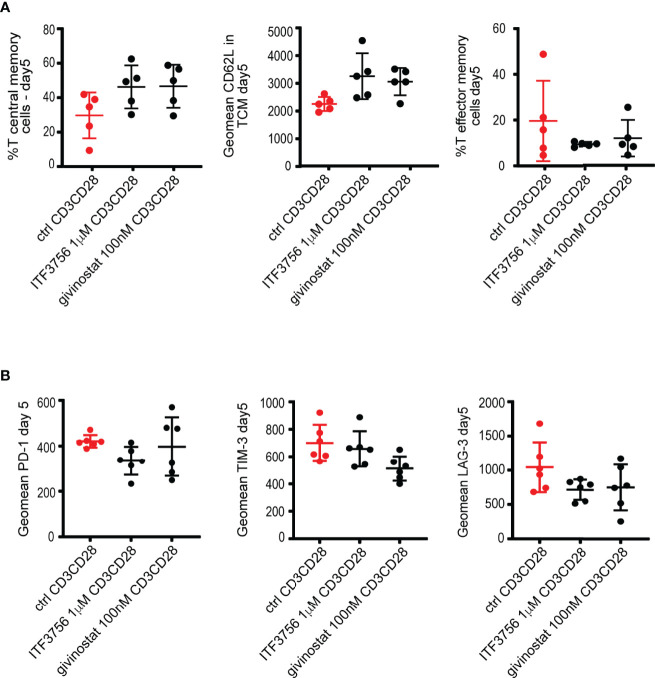
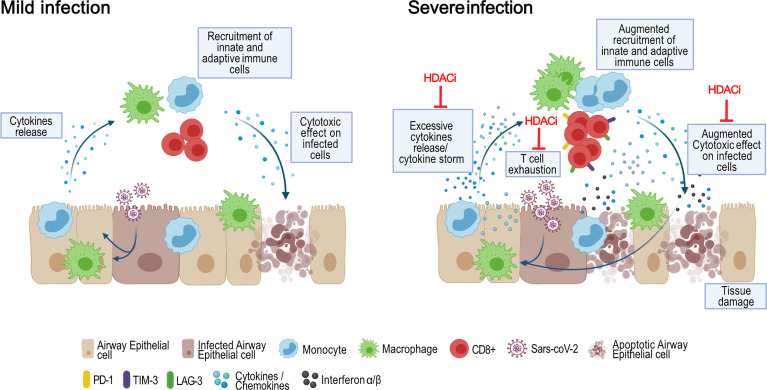
The COVID-19 pandemic has had a devastating impact worldwide and has been a great challenge for the scientific community. Vaccines against SARS-CoV-2 are now efficiently lessening COVID-19 mortality, although finding a cure for this infection is still a priority. An unbalanced immune response and the uncontrolled release of proinflammatory cytokines are features of COVID-19 pathophysiology and contribute to disease progression and worsening. Histone deacetylases (HDACs) have gained interest in immunology, as they regulate the innate and adaptative immune response at different levels. Inhibitors of these enzymes have already proven therapeutic potential in cancer and are currently being investigated for the treatment of autoimmune diseases. We thus tested the effects of different HDAC inhibitors, with a focus on a selective HDAC6 inhibitor, on immune and epithelial cells in in vitro models that mimic cells activation after viral infection. Our data indicate that HDAC inhibitors reduce cytokines release by airway epithelial cells, monocytes and macrophages. This anti-inflammatory effect occurs together with the reduction of monocytes activation and T cell exhaustion and with an increase of T cell differentiation towards a T central memory phenotype. Moreover, HDAC inhibitors hinder IFN-I expression and downstream effects in both airway epithelial cells and immune cells, thus potentially counteracting the negative effects promoted in critical COVID-19 patients by the late or persistent IFN-I pathway activation. All these data suggest that an epigenetic therapeutic approach based on HDAC inhibitors represents a promising pharmacological treatment for severe COVID-19 patients.

Keywords: COVID-19; Histone deacetylases; T cell exhaustion; cytokines; immune response; inflammation.


Conflict of interest statement

CR, VS, PP, AS, BV, MM, GS, GF, and CS are employees of Italfarmaco. The remaining authors declare that the research was conducted in the absence of any commercial or financial relationships that could be construed as a potential conflict of interest.

Figures

Figure 1
Figure 1
HDACi treatment downmodulates the expression of pro-inflammatory cytokines and IFN pathway genes in epithelial cells of the upper and lower respiratory tracts. Nasal epithelium primary cells (HNEpC) and lung epithelium primary cells (SAEpC) were pre-treated with ITF3756, givinostat and vorinostat for 2 hours and then stimulated with Poly I: C 10μg/ml for 18h. The expression of pro-inflammatory cytokines (A) and IFN pathway genes (B) was subsequently analyzed by qPCR. The graphs show the mean± SD of 3 or more biological replicates. FC = Fold changes. P values were calculated by RM one-way ANOVA as described in material and methods. *P < 0.05, ** < 0.01, *** < 0.001.
Figure 2
Figure 2
HDACi treatment modulates CD40 and CD86 surface markers expression and pro-inflammatory cytokines production in LPS or R848 stimulated monocytes. Human purified monocytes pre-treated with HDACi were stimulated with LPS (1μg/ml) or R848 (5μg/ml) and incubated ON. After incubation, cells were collected and stained with CD14, CD40 and CD86 antibodies and analysed by flow cytometry. Gate were performed on CD14+ population and dead cells were eliminated using Forward and Side scatters. Supernatants were collected and analysed for cytokines production. (A–C) Monocytes stimulated with R848: (A) percentage of positive cells and expression of CD40 (B) percentage of positive cells and expression of CD86 (C) CD40+/CD86+ double positive cells. (D–F) Monocytes stimulated with LPS: (D) percentage of positive cells and expression of CD40 (E) percentage of positive cells and expression of CD86 (F) CD40+/CD86+ double positive cells. (G) TNF-α and IL-1β production in R848 or LPS stimulated monocytes. Values on the graphs represent the mean ± SD obtained from 4 or more different donors analyzed in 3 separate experiments. P values were calculated by RM one-way ANOVA as described in material and methods for all samples. *P < 0.05, **< 0.01, ***< 0.001. Geomean is the geometrical mean fluorescence intensity.
Figure 3
Figure 3
HDACi reduce mortality in mice subjected to LPS-induced septic shock in vivo. (A) C57BL/6 wildtype (WT) mice and C57BL/6 HDAC6 KnockOut (HDAC6 KO) mice were challenged with lethal dose of E.Coli LPS 50 mg/kg intraperitoneal (ip). The experiment was conducted for a maximum of 10 days and 7 mice for group were analyzed. The graph represents the survival curve of WT and HDAC6 KO mice treated with LPS. (B) C57BL/6 WT mice were challenged with lethal dose of E.Coli LPS 50 mg/kg ip. Before 3 hours from the LPS administration, animals were randomized and divided into two groups of 10 mice each. One group was treated with LPS and the other with the combination of LPS and ITF3107 (HDAC6 inhibitor) 10mg/kg. ITF3107 10 mg/kg was administrated once ip 3 hours after LPS treatment. The experimental design planned the animal treatment with HDAC6i with the septic shock already in progress. The experiment was conducted for a maximum of 10 days. The graph represents the survival curve of wild type mice treated with LPS and treated or not treated with ITF3107.
Figure 4
Figure 4
ITF3756 dampens the pro-inflammatory program induced by TNF-α in monocytes. Human monocytes pre-treated with ITF3756 1μM were stimulated with TNF-α (100ng/ml) for 4h. RNASeq analysis was performed on 4 different donors. (A) Summary of significantly differently expressed genes (DEGs). Up- and down- regulated genes were defined as follows: -1< log2(Fold change) <1 and padj<0.01. (B) The heatmap shows hierarchical clustering of RNASeq data of monocytes stimulated or not with TNF-α and treated with ITF3756. Gene Ontology of Molecular Function (MF), Biological Processes (BP) and Transcription Factor Binding motif enrichment (TRANFAC/JASPAR PWMs) is reported for each cluster. Top 3 gene sets per clusters are shown.
Figure 5
Figure 5
HDACi decrease pro-inflammatory cytokines production and gene expression in R848-stimulated macrophages. Human macrophages, differentiated from monocytes, were pre-treated with HDACi and stimulated with R848 (5μg/ml) ON. After incubation, supernatants were collected for ELISA analysis while cells were harvested for gene expression analysis by qPCR. (A) TNF-α, IL-1β and IL-6 ELISA. Values on the graphs represent the mean± SD values of at least 8 different donors. P values were calculated by RM one-way ANOVA followed as described in material and methods. ***p < 0.001. (B) Gene expression analysis by qPCR. Values on the graphs represent the mean± SD values obtained from 4 different donors.
Figure 6
Figure 6
HDACi treatment promotes T central memory phenotype and decreases T exhaustion markers in CD3CD28-stimulated CD8+ purified cells. Purified CD8+ cells were pre-treated with HDAC6i or Pan HDACi for 2 hours and then stimulated with anti-CD3/CD28 beads for 3 days followed by another run of stimulation in the presence of the inhibitors for 2 days. Cells were counted at the end of each stimulation period, beads removed, and cells placed in new medium with fresh beads for the next stimulation. Characterization of exhaustion markers and T cells phenotype was performed by flow cytometry. (A) T central memory (TCM) positive cells (CD45RO+CCR7+CD62L+), CD62L expression in TCM and T Effector memory cells (TEM) (CD45RO+CCR7-CD62L- cells). (B) T exhaustion markers PD-1, TIM-3 and LAG-3 as geomean fluorescence intensity. Values on the graphs represent the mean± SD values of 3 experiments carried out on a total of at least 5 different donors. P values were calculated by RM one-way as described in material and methods. Geomean is the geometrical mean fluorescence intensity.
Figure 7
Figure 7
ITF3756 treatment reduced exhaustion and increased T central memory phenotype in CD3/CD28-stimulated CD8+ purified T-cells during the exhaustion process. Purified CD8+ T-cells were pre-treated with ITF3756 for 2 hours and then stimulated with anti-CD3/CD28 beads for 3 days followed by another run of stimulation in the presence of the inhibitor for 2 days. Cells were counted at the end of each stimulation period, beads removed, and cells placed in new medium with fresh beads for the next stimulation. At day 5 after stimulation cells were collected and analysed by flow cytometry, qPCR and RNASeq. (A, B) Characterization of exhaustion markers and T-cells phenotype was performed by flow cytometry. (A) Exhaustion markers (B) T central memory phenotype. Paired t-test analysis of 10 donors at day 5 of exhaustion process is shown *P≤ 0.05, **≤ 0.01, ***< 0.001. Geomean is the geometrical mean fluorescence intensity. (C–F) Gene expression analysis of mRNA extracted at day 5 by RNASeq and by qPCR in 6 donors. (C) Summary of significantly differently expressed genes (DEGs). Up- and down- regulated genes were defined as follows: -1< log2(Fold change) <1 and padj<0.01. (D) The heatmap shows hierarchical clustering of RNASeq data of CD3/CD28-stimulated CD8+ T-cells treated or not with ITF3756. Gene Ontology of Molecular Function (MF), Biological Processes (BP) and Transcription Factor Binding motif enrichment (TRANFAC/JASPAR PWMs) is reported for each cluster. Top 3 gene sets per clusters are shown. (E) The heatmap shows the modulation of specific genes observed in the RNASeq analysis. Log2 Fold Changes of ITF3756 modulated genes compared to the untreated control were reported. (F) Real Time qPCR analysis of gene expression of a selected panel of genes known to be involved in T-cells exhaustion, activation and differentiation in 6 donors. The heatmap shows log2 Fold Changes of ITF3756 modulated genes compared to the untreated control. P values were calculated by Paired t-test analysis. Asterisks indicate statistically significant changes (P ≤ 0.05).
Figure 8
Figure 8
Schematic overview of the pathogenesis and outcomes of COVID-19 and potential therapeutic effects of HDACi. In mild Sars-CoV-2 infection cases, infected airway epithelial cells recall and activate monocytes and resident macrophages through the release of cytokines and chemokines. These cells, in turn, trigger a specific innate immune response to eliminate the pathogen. The increase in pro-inflammatory signals foster the recruitment of adaptive immune cells, including CD4+ and CD8+ T cells. This immune response leads to the elimination of the infected cells, viral clearance and resolution of the disease. In severe infections instead, a dysfunctional immune response characterized by an excessive infiltration of monocytes and macrophages, lymphopenia and increased T cell exhaustion, lead to unaffected viral elimination and lung tissue damage. Moreover, the hyperproduced cytokines circulate to other organs, causing multi-organ damage. In this context, HDACi act at multiple levels: i) reducing cytokines release by epithelial cells, monocytes and macrophages; ii) inhibiting the pro-inflammatory effects of IFN-I iii) reducing monocyte activation and T cell exhaustion and promoting T cell differentiation versus a T central memory phenotype. Created with BioRender.com.

References

    1. Merad M, Martin JC. Pathological Inflammation in Patients With COVID-19: A Key Role for Monocytes and Macrophages. Nat Rev Immunol (2020) 20:355–62. doi: 10.1038/s41577-020-0331-4 - DOI - PMC - PubMed
    1. Wu C, Chen X, Cai Y, Xia J, Zhou X, Xu S, et al. . Risk Factors Associated With Acute Respiratory Distress Syndrome and Death in Patients With Coronavirus Disease 2019 Pneumonia in Wuhan, China. JAMA Intern Med (2020) 180:934–43. doi: 10.1001/jamainternmed.2020.0994 - DOI - PMC - PubMed
    1. Perico L, Benigni A, Casiraghi F, Ng LFP, Renia L, Remuzzi G. Immunity, Endothelial Injury and Complement-Induced Coagulopathy in COVID-19. Nat Rev Nephrol (2021) 17:46–64. doi: 10.1038/s41581-020-00357-4 - DOI - PMC - PubMed
    1. Wu Z, McGoogan JM. Characteristics of and Important Lessons From the Coronavirus Disease 2019 (COVID-19) Outbreak in China. JAMA (2020) 323:1239–42. doi: 10.1001/jama.2020.2648 - DOI - PubMed
    1. Gamage AM, Tan KS, Chan WOY, Liu J, Tan CW, Ong YK, et al. . Infection of Human Nasal Epithelial Cells With SARS-CoV-2 and a 382-Nt Deletion Isolate Lacking ORF8 Reveals Similar Viral Kinetics and Host Transcriptional Profiles. PloS Pathog (2020) 16:e10009130. doi: 10.1371/journal.ppat.1009130 - DOI - PMC - PubMed

Publication types