. 2022 May 12:30:101274.
doi: 10.1016/j.bbrep.2022.101274. eCollection 2022 Jul.

Acute bioenergetic insulin sensitivity of skeletal muscle cells: ATP-demand-provoked glycolysis contributes to stimulation of ATP supply

Affiliations

Acute bioenergetic insulin sensitivity of skeletal muscle cells: ATP-demand-provoked glycolysis contributes to stimulation of ATP supply

Rosie A Donnell et al. Biochem Biophys Rep. .

Abstract

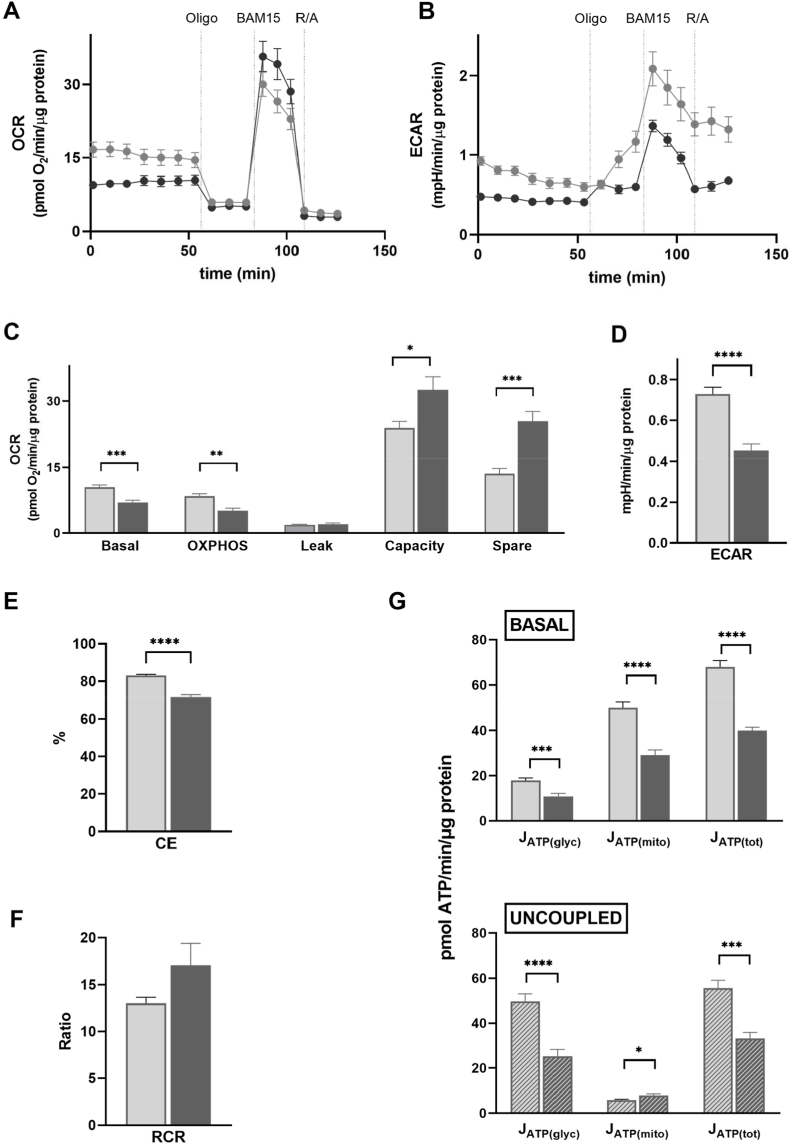
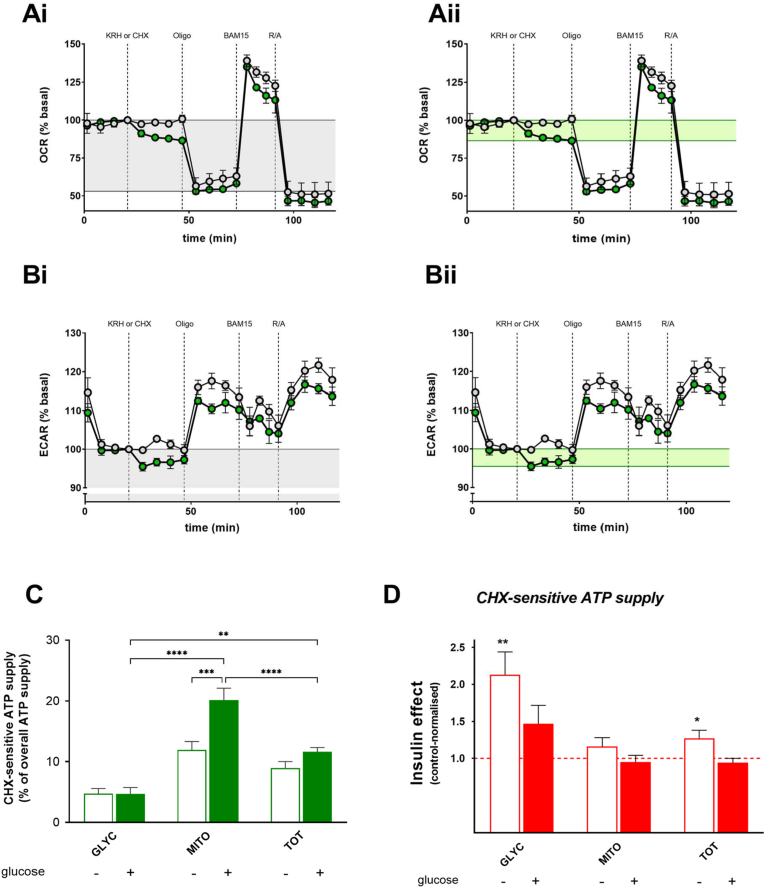
Skeletal muscle takes up glucose in an insulin-sensitive manner and is thus important for the maintenance of blood glucose homeostasis. Insulin resistance during development of type 2 diabetes is associated with decreased ATP synthesis, but the causality of this association is controversial. In this paper, we report real-time oxygen uptake and medium acidification data that we use to quantify acute insulin effects on intracellular ATP supply and ATP demand in rat and human skeletal muscle cells. We demonstrate that insulin increases overall cellular ATP supply by stimulating the rate of glycolytic ATP synthesis. Stimulation is immediate and achieved directly by increased glycolytic capacity, and indirectly by elevated ATP demand from protein synthesis. Raised glycolytic capacity does not result from augmented glucose uptake. Notably, insulin-sensitive glucose uptake is increased synergistically by nitrite. While nitrite has a similar stimulatory effect on glycolytic ATP supply as insulin, it does not amplify insulin stimulation. These data highlight the multifarious nature of acute bioenergetic insulin sensitivity of skeletal muscle cells, and are thus important for the interpretation of changes in energy metabolism that are seen in insulin-resistant muscle.

Keywords: ATP demand; Cellular energy metabolism; Efficiency of mitochondrial ATP synthesis; Oxidative phosphorylation; Skeletal muscle insulin resistance; Type 2 diabetes.


Conflict of interest statement

The authors declare no conflict of interest. The sponsors (10.13039/501100000643Daphne Jackson Trust, 10.13039/501100000291Kidney Research UK and the University of Plymouth) had no role in the design, execution, interpretation or writing of the study. It was the decision of the authors only to submit the manuscript for publication.

Figures

Fig. 1
Fig. 1
– Bioenergetics of L6 myocytes. Myoblasts (light-grey symbols) and myotubes (dark-grey symbols) were grown and assayed in the presence of 5 mM glucose. Oxygen consumption rate (OCR) and extracellular acidification rate (ECAR) were measured in the absence and cumulative presence of 5 μg/mL oligomycin (Oligo), 0.7 μM N5,N6-bis(2-fluorophenyl)[1,2,5]oxadiazolo[3,4-b]pyrazine-5,6-diamine (BAM15), and 1 μM rotenone with 1 μM antimycin A (R/A). Mitochondrial OCRs (panel C), basal ECAR (panel D), coupling efficiency of oxidative phosphorylation (CE, panel E), and the cell respiratory control ratio (RCR, panel F) were derived as described in the text. Glycolytic, mitochondrial and total ATP supply (JATP(glyc), JATP(mito), JATP(tot)) rates were determined without effectors (BASAL, panel G) and in the presence of oligomycin and BAM15 (UNCOUPLED, panel G). Bioenergetic parameters reflecting the uncoupled state, were calculated from the peak OCR and ECAR values observed in the combined presence of oligomycin and BAM15. Data are means ± SEM of 6–34 separate measurements from 2 to 5 assays. Differences between myoblasts and myotubes were evaluated for statistical significance by Mann-Whitney tests (*P < 0.05, **P < 0.01, ***P < 0.001, ****P < 0.0001). Basal: mitochondrial OCR in the absence of effectors; OXPHOS: OCR coupled to ATP synthesis; Leak: OCR linked to mitochondrial proton leak; Capacity: mitochondrial OCR stimulated by BAM15; Spare: difference between Capacity and Basal.
Fig. 2
Fig. 2
– Insulin sensitivity of muscle cell bioenergetics. The acute effect of 100 nM human insulin on coupling efficiency of oxidative phosphorylation (panel A), ECAR (panel B), and on glycolytic (GLYC), mitochondrial (MITO) and total (TOT) ATP supply rates (panels C, D, F) was measured under basal (coupling +) and uncoupled (coupling –) conditions with or without 5 mM glucose. For glucose-free runs, myoblasts were cultured at 2% instead of 10% fetal bovine serum (FBS) from 16 h before the experiment. The insulin effects shown in panels A, C, D and F are expressed relative to the respective control parameters measured in the absence of insulin (cf. Fig. 1). Data are means ± SEM of 6–22 separate measurements from 2 to 4 independent XF runs. Absolute differences in panel B were evaluated for statistical significance by Mann-Whitney tests. Control-normalised effects were assessed for significance by one sample t tests (*P < 0.05, **P < 0.01, ***P < 0.001, ****P < 0.0001). Lactate release data from cells grown and assayed in the presence of 5 mM glucose (panel E), and assayed with and without 100 nM human insulin, are means ± SEM of 8–21 separate measurements from 2 to 5 independent assays, and were fitted to linear expressions ‘forced’ through the origin. The mean (SEM) fit slopes are 3.8 (0.39) and 5.1 (0.24) pmol lactate released per min per μg protein for control and insulin-exposed L6 myoblasts, respectively. The shaded areas between dotted lines reflect 95% confidence intervals.
Fig. 3
Fig. 3
– Effect of insulin on ATP demand in primary human myotubes. ATP demand from protein synthesis was estimated indirectly from XF data [23]. As shown by typical (means ± SEM of 3–5 measurements from a single experiment) OCR and ECAR traces (panels A and B), 1 μM cycloheximide (CHX, green) or KRH (grey), 1.9 μg/mL oligomycin (Oligo), 1.5 μM BAM15, and 1 μM rotenone with 1 μM antimycin A (R/A) were added sequentially after 4 basal measurements. The oligomycin-sensitive OCR and basal ECAR in CHX traces (grey-shaded, panels Ai and Bi) were used to derive overall ATP supply, while the CHX-sensitive OCR and ECAR of the same traces were used to determine ATP supply used specifically to make protein (green-shaded, panels Aii and Bii). KRH traces were used to correct the CHX sensitivity for minor buffer addition effects. CHX-sensitive glycolytic (GLYC), mitochondrial (MITO) and total (TOT) ATP supply rates in untreated cells (expressed as percentage of the respective overall rates, panel C) and acute effects of 100 nM human insulin on these CHX-sensitive rates (panel D) were measured with and without 5 mM glucose. The insulin effects shown in panel D are expressed relative to the respective control parameters measured in the absence of insulin. Differences between CHX-sensitive ATP supply rates were tested for statistical significance by two-way ANOVA with Tukey's post-hoc analysis, while control-normalised insulin effects were tested for significance by one sample t tests (*P < 0.05, **P < 0.01, ****P < 0.0001). Data in panels C and D are means ± SEM of 4–21 and 13-23 separate measurements from 1 to 4 and 4 independent assays, respectively. (For interpretation of the references to colour in this figure legend, the reader is referred to the Web version of this article.)
Fig. 4
Fig. 4
– Insulin stimulation of glycolytic ATP supply is not linked to glucose uptake. Glycolytic ATP supply (panel A – JATP(glyc)) was measured in L6 myoblasts under conditions identical to those applied for the 2DG (2-deoxyglucose) uptake assay (panel B), i.e., cells were cultured at 2% FBS from 16 h before the experiment and 5 mM glucose was added during the XF assay before other effectors. Cells were exposed transiently to 1 μM NaNO2 for 20 min before the assay and both exposed and non-exposed cells were assayed with or without 100 nM human insulin. Effects are means ± SEM of 12–15 separate measurements from 3 to 4 independent experimental runs and were normalised to the values obtained in cells exposed to neither nitrite nor insulin. Effects were evaluated for statistical significance by one sample t tests (*P < 0.05, ***P < 0.001).

References

    1. Thiebaud D., Jacot E., DeFronzo R.A., Maeder E., Jequier E., Felber J.P. The effect of graded doses of insulin on total glucose uptake, glucose oxidation, and glucose storage in man. Diabetes. 1982;31:957–963. - PubMed
    1. DeFronzo R.A. From the triumvirate to the ominous octet: a new paradigm for the treatment of type 2 diabetes mellitus. Diabetes. 2009;58:773–795. - PMC - PubMed
    1. Rutter G.A., Pullen T.J., Hodson D.J., Martinez-Sanchez A. Pancreatic β-cell identity, glucose sensing and the control of insulin secretion. Biochem. J. 2015;466:203–218. - PubMed
    1. Garber A.J. Obesity and type 2 diabetes: which patients are at risk? Diabetes Obes. Metabol. 2012;14:399–408. - PubMed
    1. Petersen M.C., Shulman G.I. Mechanisms of insulin action and insulin resistance. Physiol. Rev. 2018;98:2133–2223. - PMC - PubMed

LinkOut - more resources