. 2022 May 9:17:745-753.
doi: 10.2147/CIA.S363116. eCollection 2022.

Level of LncRNA GAS5 and Hippocampal Volume are Associated with the Progression of Alzheimer's Disease

Affiliations

Level of LncRNA GAS5 and Hippocampal Volume are Associated with the Progression of Alzheimer's Disease

Xiaopeng Chen et al. Clin Interv Aging. .

Abstract

Purpose: We evaluated the diagnostic value of long non-coding RNA growth arrest-specific transcript 5 (GAS5) and its relationship with hippocampal volume in Alzheimer's disease (AD).

Patients and methods: One hundred and eight patients with AD and 83 healthy controls were included, and demographic data, biochemical parameters, GAS5 levels, and hippocampal volume were recorded. Chi-squared tests or independent sample t-tests were used to compare the baseline characteristics, relative expression of GAS5, and hippocampal volume. Correlations between variables were determined using Spearman's rank correlation test. Receiver operating characteristic (ROC) curves were generated to compare the diagnostic value of GAS5 and total hippocampal volume in AD.

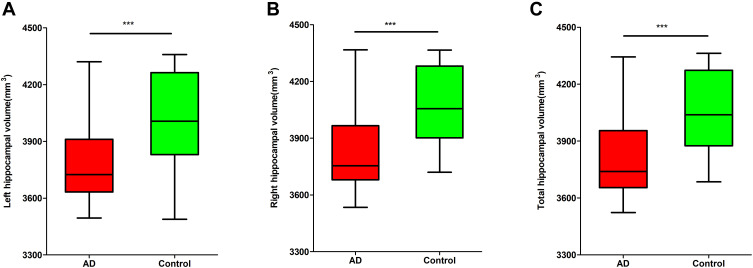
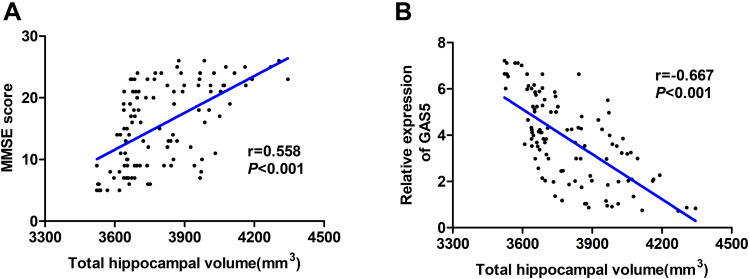
Results: The levels of GAS5 were significantly upregulated in patients with AD compared with those in controls and were negatively correlated with MMSE score. There were differences in left hippocampal volume, right hippocampal volume, and total hippocampal volume between the two groups. Total hippocampal volume was positively correlated with MMSE score and negatively correlated with GAS5 expression in patients with AD. The area under the curve (AUC) of for GAS5 expression was 0.831, the sensitivity was 61.1%, and the specificity was 95.2%. The AUC of the combined total hippocampal volume was 0.891, the sensitivity was 74.1%, and the specificity was 92.8%.

Conclusion: The results suggested that GAS5 may be an excellent indicator of AD progression alone or in combination with hippocampal volume.

Keywords: Alzheimer’s disease; biomarker; long non-coding RNA; receiver operating characteristic.


Conflict of interest statement

The authors report no conflicts of interest in this work.

Figures

Figure 1
Figure 1
Changes in PBMC GAS5 levels in patients with AD. (A) Relative expression of GAS5 in PBMCs was upregulated in patients with AD (n = 108) compared with that in controls (n = 83) (independent sample t-tests). (B) The expression of GAS5 and MMSE scores were negatively correlated in patients with AD (n = 108) (Pearson analysis). ***P < 0.001.
Figure 2
Figure 2
Changes in hippocampal morphology as determined using MRI. (A) Normal hippocampal morphology. (B) Mild hippocampal atrophy (MMSE = 25). (C) Moderate hippocampal atrophy (MMSE = 16). (D) Severe hippocampal atrophy (MMSE = 7).
Figure 3
Figure 3
Alterations in hippocampal volume in patients with AD. (A) Left hippocampal volumes were smaller in the AD group (n = 108) than those in the control group (n = 83). (B) Right hippocampal volumes were smaller in the AD group (n = 108) than those in the control group (n = 83). (C) The total hippocampal volumes were smaller in the AD group (n = 108) than those in the control group (n = 83). ***P < 0.001.
Figure 4
Figure 4
Correlation analysis of total hippocampal volume, MMSE score, and GAS5 levels in patients with AD. (A) Positive correlation between MMSE score and total hippocampal volume. (r = 0.558, P< 0.001) (Pearson analysis). (B) Negative correlation between total hippocampal volume and expression of GAS5 (r =−0.667, P< 0.001) (Pearson analysis).
Figure 5
Figure 5
Receiver operating characteristic curves. (A) ROC curve of GAS5 levels (AUC = 0.831, sensitivity = 61.1%, specificity = 95.2%). (B) ROC curve of total hippocampal volume (AUC = 0.808, sensitivity = 57.4%, specificity = 92.8%). (C) ROC curve of combined GAS5 levels and total hippocampal volume (AUC = 0.891, sensitivity = 74.1%, specificity = 92.8%). (D) Combination diagram of ROC curves.

Similar articles

Cited by

References

    1. Alzheimer’s Association. 2021 Alzheimer’s disease facts and figures. Alzheimers Dement. 2021;17(3):327–406. doi:10.1002/alz.12328 - DOI - PubMed
    1. Sintini I, Whitwell JL. Update on neuroimaging in Alzheimer’s disease. Curr Opin Neurol. 2021;34(4):525–531. doi:10.1097/WCO.0000000000000947 - DOI - PMC - PubMed
    1. Rajan KB, Weuve J, Barnes LL, McAninch EA, Wilson RS, Evans DA. Population estimate of people with clinical Alzheimer’s disease and mild cognitive impairment in the United States (2020-2060). Alzheimers Dement. 2021;17(12):1966–1975. doi:10.1002/alz.12362 - DOI - PMC - PubMed
    1. Tillmann J, Schnakenberg R, Puth MT, Weckbecker K, Just J, Munster E. Barriers in general practitioners’ dementia diagnostics among people with a migration background in Germany (BaDeMi) - study protocol for a cross-sectional survey. BMC Med Res Methodol. 2018;18(1):124. doi:10.1186/s12874-018-0580-0 - DOI - PMC - PubMed
    1. Jia L, Du Y, Chu L, et al. Prevalence, risk factors, and management of dementia and mild cognitive impairment in adults aged 60 years or older in China: a cross-sectional study. Lancet Public Health. 2020;5(12):e661–e671. doi:10.1016/S2468-2667(20)30185-7 - DOI - PubMed

Substances