

Identification of Potential Urinary Metabolite Biomarkers of Pseudomonas aeruginosa Ventilator-Associated Pneumonia
- PMID: 35592849
- PMCID: PMC9112676
- DOI: 10.1177/11772719221099131
Identification of Potential Urinary Metabolite Biomarkers of Pseudomonas aeruginosa Ventilator-Associated Pneumonia
Abstract
Introduction: Ventilator-associated pneumonia (VAP) caused by Pseudomonas aeruginosa is a major cause of morbidity and mortality in hospital intensive care units (ICU). Rapid identification of P. aeruginosa-derived markers in easily accessible patients' samples can enable an early detection of P. aeruginosa VAP (VAP-PA), thereby stewarding antibiotic use and improving clinical outcomes.
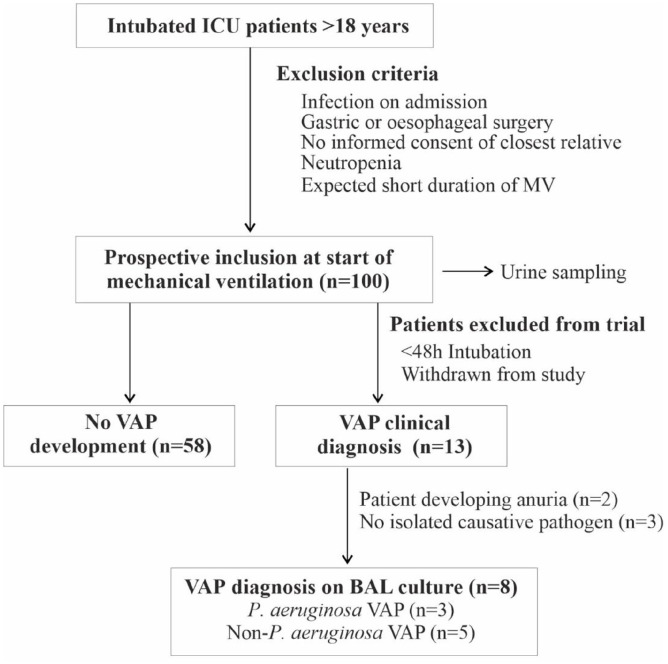
Methods: Metabolites were analysed using liquid chromatography-mass spectrometry (LC-MS) in prospectively collected urine samples from mechanically ventilated patients admitted to the Antwerp University Hospital ICU. Patients were followed from the start of mechanical ventilation (n = 100 patients) till the time of clinical diagnosis of VAP (n = 13). Patients (n = 8) in whom diagnosis of VAP was further confirmed by culturing respiratory samples and urine samples were studied for semi-quantitative metabolomics.
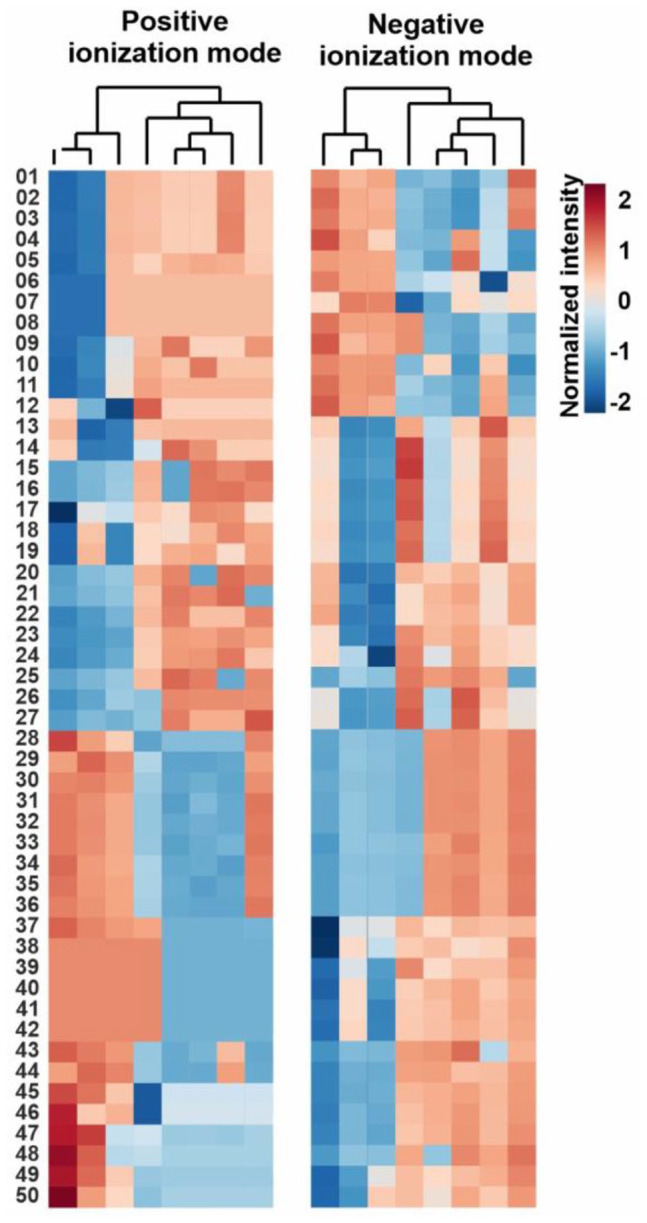
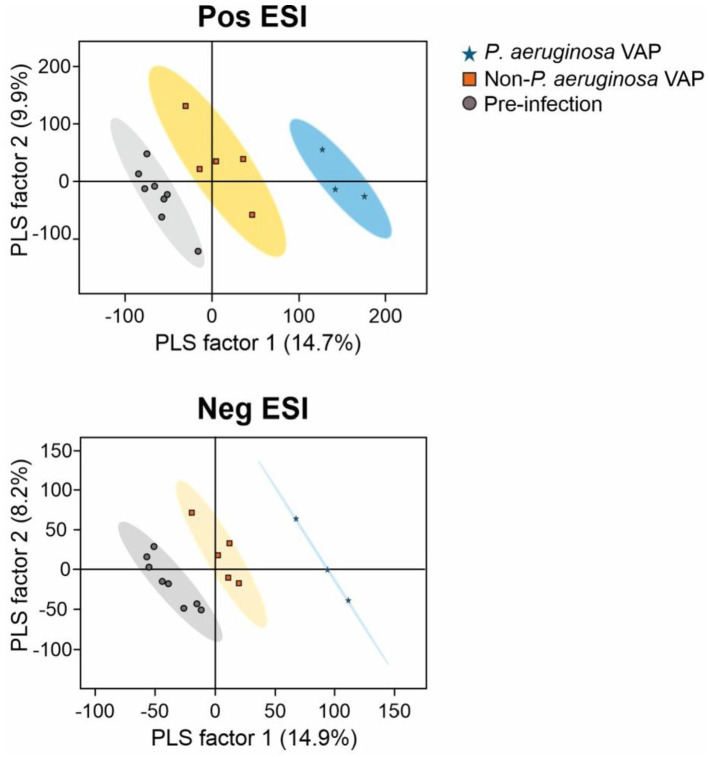
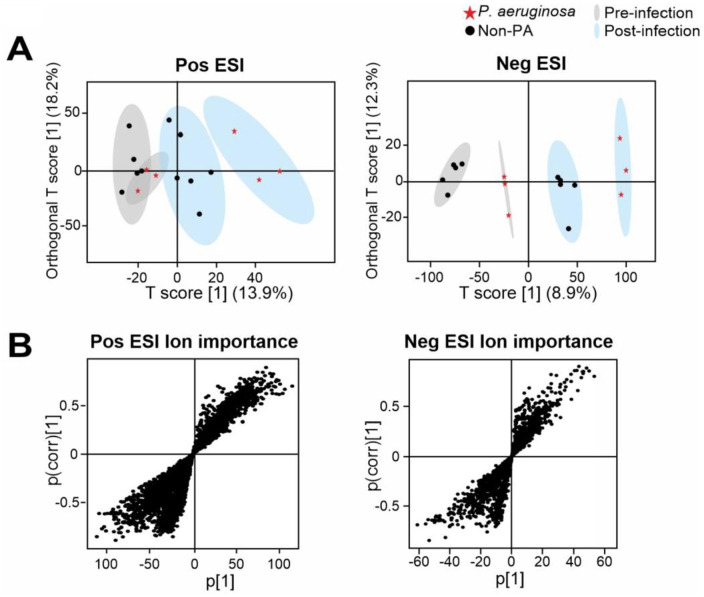
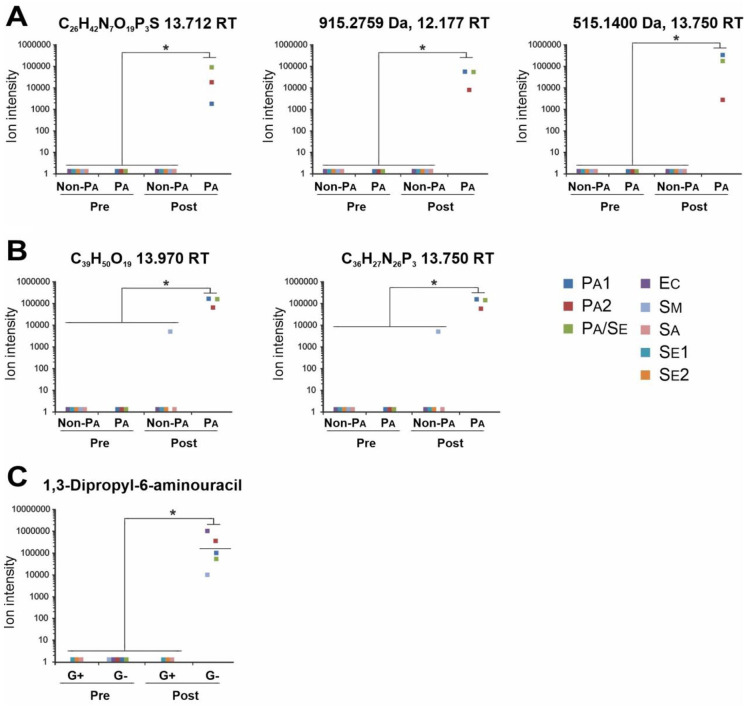
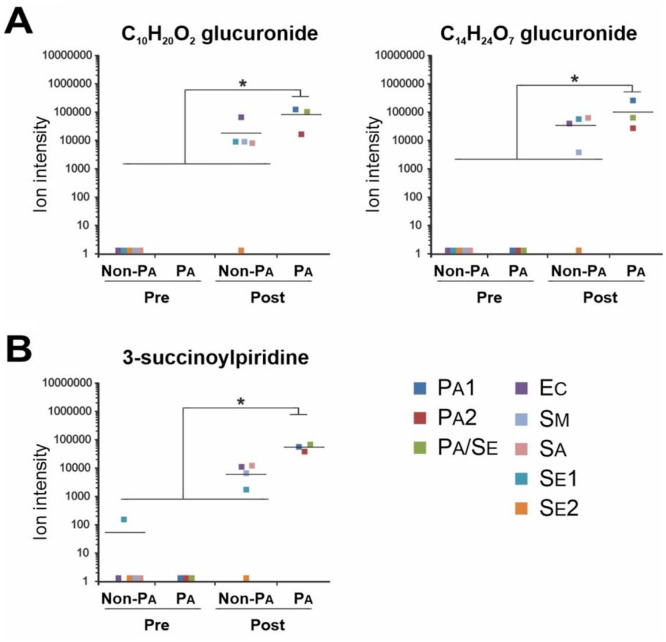
Results: We first show that multivariate analyses highly discriminated VAP-PA from VAP-non-PA as well as from the pre-infection groups (R 2 = .97 and .98, respectively). A further univariate analysis identified 58 metabolites that were significantly elevated or uniquely present in VAP-PA compared to the VAP-non-PA and pre-infection groups (P < .05). These comprised both a known metabolite of histidine as well as a novel nicotine metabolite. Most interestingly, we identified 3 metabolites that were not only highly upregulated for, but were also highly specific to, VAP-PA, as these metabolites were completely absent in all pre-infection timepoints and in VAP-non-PA group.
Conclusions: Considerable differences exist between urine metabolites in VAP-PA compared to VAP due to other bacterial aetiologies as well to non-VAP (pre-infection) timepoints. The unique urinary metabolic biomarkers we describe here, if further validated, could serve as highly specific diagnostic biomarkers of VAP-PA.
Keywords: Hospital-acquired pneumonia; Pseudomonas aeruginosa; VAP; mass spectrometry; metabolomics; urine biomarkers.
© The Author(s) 2022.
Conflict of interest statement
Declaration of Conflicting Interests: The author(s) declared no potential conflicts of interest with respect to the research, authorship, and/or publication of this article.
Figures
Similar articles
-
Impact of the duration of antibiotics on clinical events in patients with Pseudomonas aeruginosa ventilator-associated pneumonia: study protocol for a randomized controlled study.Trials. 2017 Jan 23;18(1):37. doi: 10.1186/s13063-017-1780-3. Trials. 2017. PMID: 28114979 Free PMC article. Clinical Trial.
-
Impact of ureido/carboxypenicillin resistance on the prognosis of ventilator-associated pneumonia due to Pseudomonas aeruginosa.Crit Care. 2011;15(2):R112. doi: 10.1186/cc10136. Epub 2011 Apr 11. Crit Care. 2011. PMID: 21481266 Free PMC article.
-
Evaluation of GeneXpert PA assay compared to genomic and (semi-)quantitative culture methods for direct detection of Pseudomonas aeruginosa in endotracheal aspirates.Antimicrob Resist Infect Control. 2021 Jul 23;10(1):110. doi: 10.1186/s13756-021-00978-9. Antimicrob Resist Infect Control. 2021. PMID: 34301343 Free PMC article.
-
Ventilator-associated pneumonia complicating the acute respiratory distress syndrome.Semin Respir Crit Care Med. 2001 Jun;22(3):317-26. doi: 10.1055/s-2001-15788. Semin Respir Crit Care Med. 2001. PMID: 16088683
-
Worldwide variation in Pseudomonas associated ventilator associated pneumonia. A meta-regression.J Crit Care. 2019 Jun;51:88-93. doi: 10.1016/j.jcrc.2019.02.001. Epub 2019 Feb 6. J Crit Care. 2019. PMID: 30771693 Review.
Cited by
-
Liquid Chromatography-Mass Spectrometry Analytical Methods for the Quantitation of p-Cresol Sulfate and Indoxyl Sulfate in Human Matrices: Biological Applications and Diagnostic Potentials.Pharmaceutics. 2024 May 30;16(6):743. doi: 10.3390/pharmaceutics16060743. Pharmaceutics. 2024. PMID: 38931865 Free PMC article. Review.
-
Untargeted Blood Lipidomics Analysis in Critically Ill Pediatric Patients with Ventilator-Associated Pneumonia: A Pilot Study.Metabolites. 2024 Aug 23;14(9):466. doi: 10.3390/metabo14090466. Metabolites. 2024. PMID: 39330473 Free PMC article.
References
-
- Martin-Loeches I, Povoa P, Rodríguez A, et al.. Incidence and prognosis of ventilator-associated tracheobronchitis (TAVeM): a multicentre, prospective, observational study. Lancet Respir Med. 2015;3:859-868. - PubMed
-
- Koulenti D, Tsigou E, Rello J. Nosocomial pneumonia in 27 ICUs in Europe: perspectives from the EU-VAP/CAP study. Eur J Clin Microbiol Infect Dis. 2017;36:1999-2006. - PubMed
-
- Rello J, Diaz E. Pneumonia in the intensive care unit. Crit Care Med. 2003;31:2544-2551. - PubMed
-
- Crouch Brewer S, Wunderink RG, Jones CB, Leeper KV., Jr. Ventilator-associated pneumonia due to Pseudomonas aeruginosa. Chest. 1996;109:1019-1029. - PubMed
-
- American Thoracic Society, Infectious Diseases Society of America. Guidelines for the management of adults with hospital-acquired, ventilator-associated, and healthcare-associated pneumonia. Am J Respir Crit Care Med. 2005;171:388-416. - PubMed
LinkOut - more resources
Full Text Sources
