. 2023 Mar 1;77(3):874-887.
doi: 10.1002/hep.32581. Epub 2023 Feb 17.

Myeloid p38 activation maintains macrophage-liver crosstalk and BAT thermogenesis through IL-12-FGF21 axis

Affiliations

Myeloid p38 activation maintains macrophage-liver crosstalk and BAT thermogenesis through IL-12-FGF21 axis

María Crespo et al. Hepatology. .

Abstract

Obesity features excessive fat accumulation in several body tissues and induces a state of chronic low-grade inflammation that contributes to the development of diabetes, steatosis, and insulin resistance. Recent research has shown that this chronic inflammation is crucially dependent on p38 pathway activity in macrophages, suggesting p38 inhibition as a possible treatment for obesity comorbidities. Nevertheless, we report here that lack of p38 activation in myeloid cells worsens high-fat diet-induced obesity, diabetes, and steatosis. Deficient p38 activation increases macrophage IL-12 production, leading to inhibition of hepatic FGF21 and reduction of thermogenesis in the brown fat. The implication of FGF21 in the phenotype was confirmed by its specific deletion in hepatocytes. We also found that IL-12 correlates with liver damage in human biopsies, indicating the translational potential of our results. Our findings suggest that myeloid p38 has a dual role in inflammation and that drugs targeting IL-12 might improve the homeostatic regulation of energy balance in response to metabolic stress.


Conflict of interest statement

Nothing to report.

Figures

None
Graphical abstract
FIGURE 1
FIGURE 1
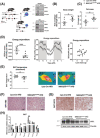
MKK3 and MKK6 deficiency in myeloid cells promotes obesity and alters brown adipose tissue (BAT) thermogenesis and energy expenditure after high‐fat diet (HFD) feeding. (A) Knock‐out strategy for specific deletion of mitogen activated protein kinase kinase 3 (Mkk3) (Map2k3) and Mkk6 (Map2k6) encoding genes in myeloid cells. Immunoblot showing deletion of MKK3 and MKK6 proteins in bone marrow–derived macrophages (BMDMs) and Kupffer cells (KCs). (B–H) Lyzs‐Cre and MKK3/6Lyzs‐KO mice were fed an HFD for 10 weeks, and distinct metabolic parameters were determined: (B) body weight normalized by tibia length; (C) nuclear magnetic resonance analysis of fat mass; (D) energy expenditure (EE) analysis in metabolic cages over a 2‐day period after 6 weeks of HFD. From left to right panels, EE is expressed as accumulative, hour by hour, and as analysis of covariance analysis. EE values are corrected by lean mass; (E) skin temperature surrounding interscapular brown adipose tissue (BAT). (n = 8 mice per group). Right panels show representative infrared thermal images; (F) representative hematoxylin‐eosin stain of BAT; (G) immunohistochemistry staining (upper panel) and immunoblot analysis of UCP1 protein content in BAT (lower panel) (Scale bar: 100 μm); and (H) mRNA levels of thermogenic genes (relative to Gapdh) in BAT. (n = 6–8 mice per group). Data are means ± SEM. *p < 0.05, **p < 0.01, ***p < 0.001 by Student t test (B, C, D left panel, E, H) or two‐way analysis of variance coupled to Bonferroni's multiple test (D, medium panel).
FIGURE 2
FIGURE 2
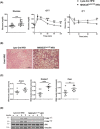
MKK3 and MKK6 deficiency in myeloid cells alters glucose metabolism and promotes steatosis and insulin resistance in the liver after high‐fat diet (HFD) feeding. (A) Glucose metabolism was determined after 8 weeks of HFD in Lyzs‐Cre and MKK3/6Lyzs‐KO mice. From left to right, figure shows fasting glucose levels (n = 12–14 mice per group), glucose tolerance test (GTT), and insulin tolerance test (ITT). (n = 10 mice per group). (B–D) Livers from Lyzs‐Cre and MKK3/6Lyzs‐KO after 10 weeks of HFD were analyzed: (B) representative hematoxylin‐eosin stain (H&E) of livers (scale bar: 100 μm); (C) mRNA levels of genes related to lipogenesis pathway (relative to Gapdh). (n = 8 mice per group); (D) analysis of insulin pathway activation by immunoblot determination of phospho‐Akt levels in livers before (−) or after 15 min of insulin intraperitoneal injection (+). Data are means ± SEM. *p < 0.05, **p < 0.01, ***p < 0.001 by Student t test (A left panel, C) or two‐way ANOVA coupled to Bonferroni's multiple test (A medium and right panels).
FIGURE 3
FIGURE 3
Lack of myeloid MKK3/6 affects whole‐body metabolism through hepatic Fibroblast Growth Factor 21 (FGF21) after high‐fat diet (HFD) feeding. (A–C) Lyzs‐Cre and MKK3/6Lyzs‐KO mice were fed an HFD for 10 weeks and BAT was analyzed: (A) From left to right, CD45+, CD11b+, F4/80+ cells (total BAT‐associated macrophages), CD45+, CD11b+, F4/80+ CD11c+CD206 cells and CD45+, CD11b+, F4/80+ CD11cCD206+ cells in the stromal vascular fraction from BAT determined by flow cytometry. Ratio of CD11c+CD206/CD11cCD206+ is shown. (n = 7–8 mice per group). Representative plots showing BAT‐associated macrophage populations are shown on the right; (B) mRNA levels of hepatic Fgf21 (relative to Gapdh) (n = 7–8 mice per group) and (C) immunoblot analysis of hepatic and circulating FGF21 levels in Lyzs‐Cre and MKK3/6Lyzs‐KO mice after HFD. Immunoblot quantification is shown in left panels. (D–K) Chimeric mice were generated by bone marrow (BM) transplantation of Lyzs‐Cre or MKK3/6Lyzs‐KO BM in Alb‐Cre and FGF21Alb‐KO recipients. After 8 wk of reconstitution, mice were fed an HFD for 18 wk and distinct metabolic parameters determined: (D) experimental scheme for the generation of chimeric mice by bone marrow transplantation; (E) body weight normalized by tibia length; (F) Energy expenditure (EE) analysis of HFD‐fed mice in metabolic cages over a 2‐day period after 16 weeks of HFD; (G) fasting glucose levels; (H) glucose tolerance test (GTT); (I) insulin tolerance test (ITT); (J) skin temperature surrounding interscapular BAT of the indicated recipients. (n = 6–8 mice per group). Right panels show representative infrared thermal images; and (K) representative hematoxylin‐eosin stain of BAT (Scale bar: 100 μm). Data are means ± SEM. *p < 0.05, **p < 0.01, ***p < 0.001 by Student t test (A–G), two‐way analysis of variance coupled to Bonferroni's multiple test (H,I) or one‐way ANOVA coupled to Tukey's multiple test (J); t (p < 0.05) by Student t test (H).
FIGURE 4
FIGURE 4
IL‐12 secreted by liver macrophages modulates hepatic Fgf21 expression and correlates with liver damage in humans. (A) mRNA levels of Fgf21 (relative to Gapdh) in cultured mouse hepatocytes treated 6 h with 0.5 mM palmitate (PA) and then 6 h with conditioned medium (CM) from Lyzs‐Cre and MKK3/6Lyzs‐KO BMDM (n = 3–6 wells per group). (B) Lyzs‐Cre and MKK3/6Lyzs‐KO mice were fed a HFD for 10 weeks, and ResKCs and MoKCs were FACS‐sorted and purified from livers following the gating strategy indicated in Figure S4A. mRNA levels of Il12b and Nos2 were determined by Real Time quantitative PCR (RT‐qPCR) (relative to Gapdh) in both populations of liver macrophages. Resident Kupffer cells (ResKCs) and monocyted‐derived Kupffer cells (MoKCs) are shown in the upper and lower panels, respectively (n = 5–10 pools of 2 mice per group from 3 different experiments). (C–D) BMDM differentiated from Lyzs‐Cre and MKK3/6Lyzs‐KO bone marrows were treated 6 h with 0.1 mM PA and then with LPS (100 ng/mL) at different times: (C) mRNA levels of Il12b and Nos2 genes (relative to Gapdh) in BMDM (n = 3–4 wells per group); (D) levels of IL‐12p70 in supernatants from BMDM (n = 4 pools of 2 mice per group). (E) mRNA levels of Fgf21 (relative to Gapdh) in cultured mouse hepatocytes (left) or mRNA levels of FGF21 (relative to HPRT) in human THLE‐2 cells (right) treated 6 h with 0.5 mM palmitate (PA) and then with recombinant IL‐12p70 (10 ng/mL) at the indicated time points. (n = 6 wells per group). (F) Immunoblot analysis of circulating FGF21 levels in wild‐type mice 6 h after injection with saline or recombinant mouse IL‐12p70 (30 μg/kg). Immunoblot quantification is shown in the right panel (n = 4 mice per group). (G) mRNA levels of Il12b (relative to Gapdh) in livers from in Lyzs‐Cre and MKK3/6Lyzs‐KO mice after HFD (n = 8 mice per group). (H) Serum levels of AST and ALT in Lyzs‐Cre and MKK3/6Lyzs‐KO mice after HFD (n = 5 mice/group). (I) Determination of IL12B mRNA expression (relative to GAPDH) in liver biopsies from a human cohort of patients classified according to the grade of hepatocellular lesions (left panel); and level of steatosis (right panel) where the healthy group correspond to patients without obesity or liver steatosis and the severe group are patients with obesity and massive steatosis (n = 36). (J) Correlation between mRNA levels of IL12B in human livers and AST (R2 = 0.243; p = 0.0009) and ALT (R 2  = 0.243; p = 0.0011) serum concentration in those same individuals. Linear relationships between variables were tested using Pearson's correlation coefficient (n = 41). Data are means ± SEM. *p < 0.05, **p < 0.01 ***p < 0.001, ****p < 0.0001 by Student t test or Welch's test (B, D, E right panel, F‐H, I right panel), one‐way ANOVA coupled to Tukey's multiple test (A, C, H left panel) or Kruskal‐Wallis test coupled to Dunn's multiple test (E left panel); t (p < 0.05), tt (p < 0.01), ttt (p < 0.001), tttt by Student t test or Welch's test (A, C, E left panel, I left panel).

References

    1. Nikolic I, Leiva M, Sabio G. The role of stress kinases in metabolic disease. Nat Rev Endocrinol. 2020;16:697–716. - PubMed
    1. Hotamisligil GS. Inflammation, metaflammation and immunometabolic disorders. Nature. 2017;542:177–85. - PubMed
    1. Daemen S, Schilling JD. The interplay between tissue niche and macrophage cellular metabolism in obesity. Front Immunol. 2019;10:3133. - PMC - PubMed
    1. Lopez BG, Tsai MS, Baratta JL, Longmuir KJ, Robertson RT. Characterization of Kupffer cells in livers of developing mice. Comp Hepatol. 2011;10:2. - PMC - PubMed
    1. Alharthi J, Latchoumanin O, George J, Eslam M. Macrophages in metabolic associated fatty liver disease. World J Gastroenterol. 2020;26:1861–78. - PMC - PubMed

Publication types