. 2022 Aug;16(15):2881-2895.
doi: 10.1002/1878-0261.13230. Epub 2022 Jun 5.

NNK from tobacco smoking enhances pancreatic cancer cell stemness and chemoresistance by creating a β2AR-Akt feedback loop that activates autophagy

Affiliations

NNK from tobacco smoking enhances pancreatic cancer cell stemness and chemoresistance by creating a β2AR-Akt feedback loop that activates autophagy

Xin Chen et al. Mol Oncol. 2022 Aug.

Abstract

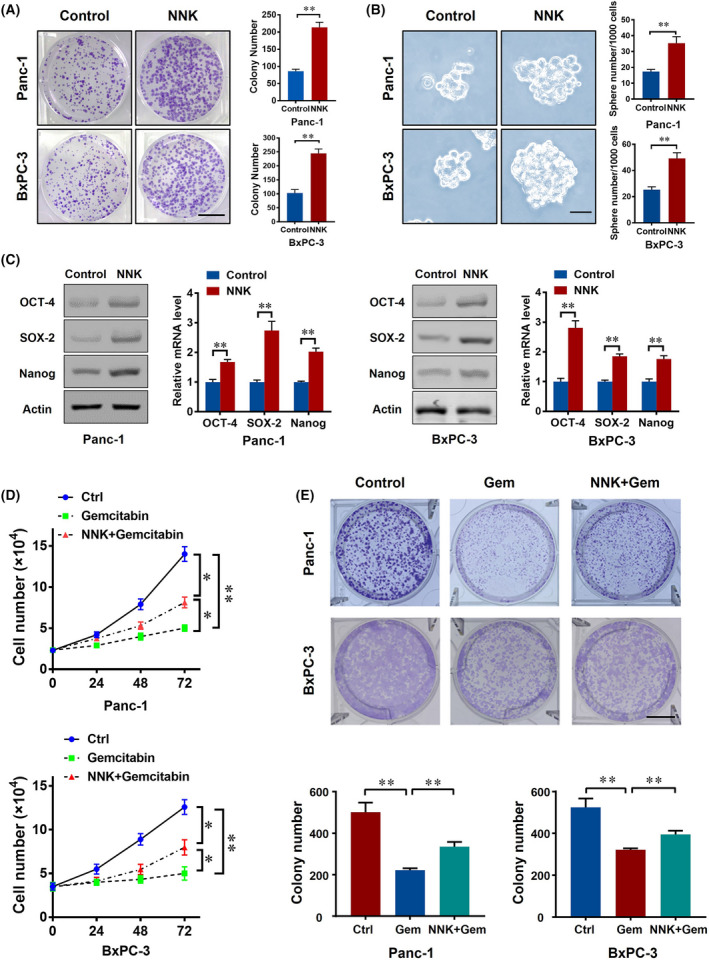
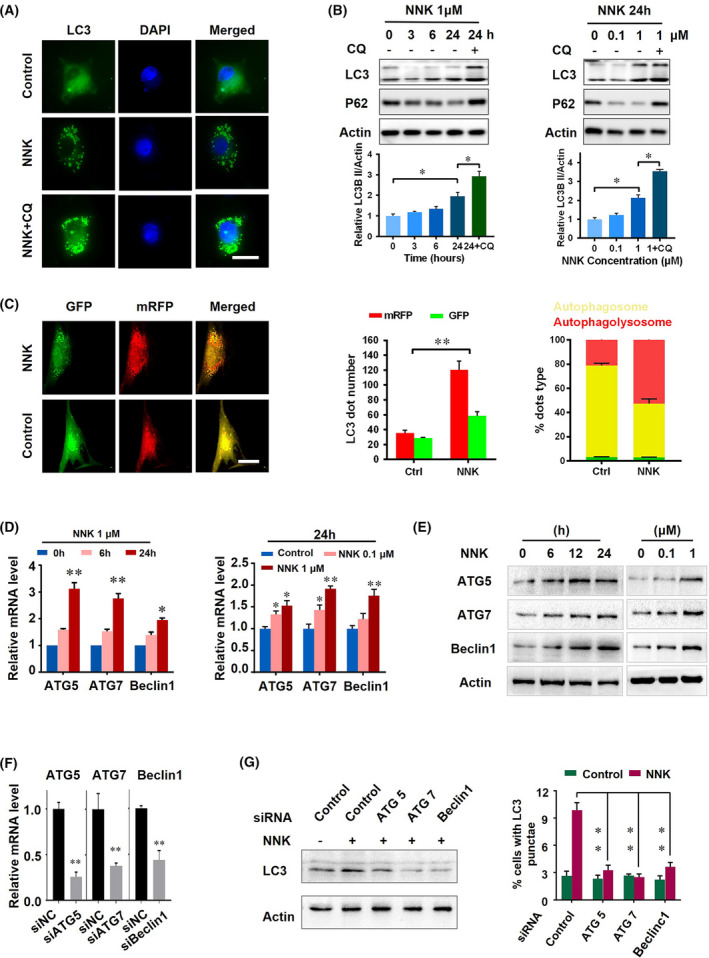
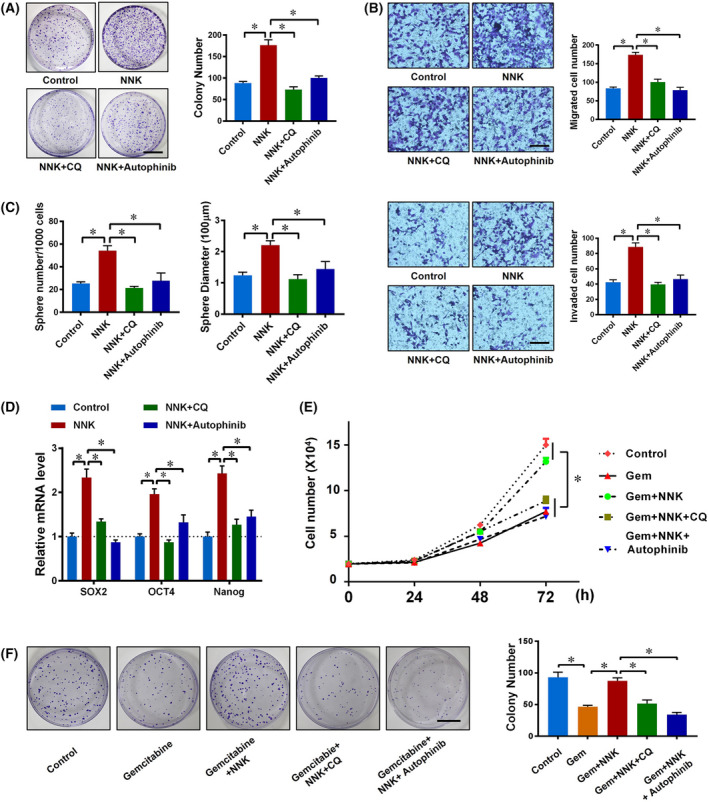
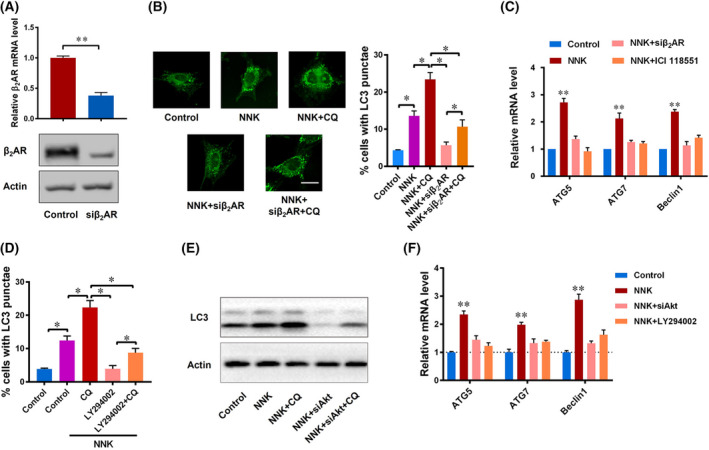
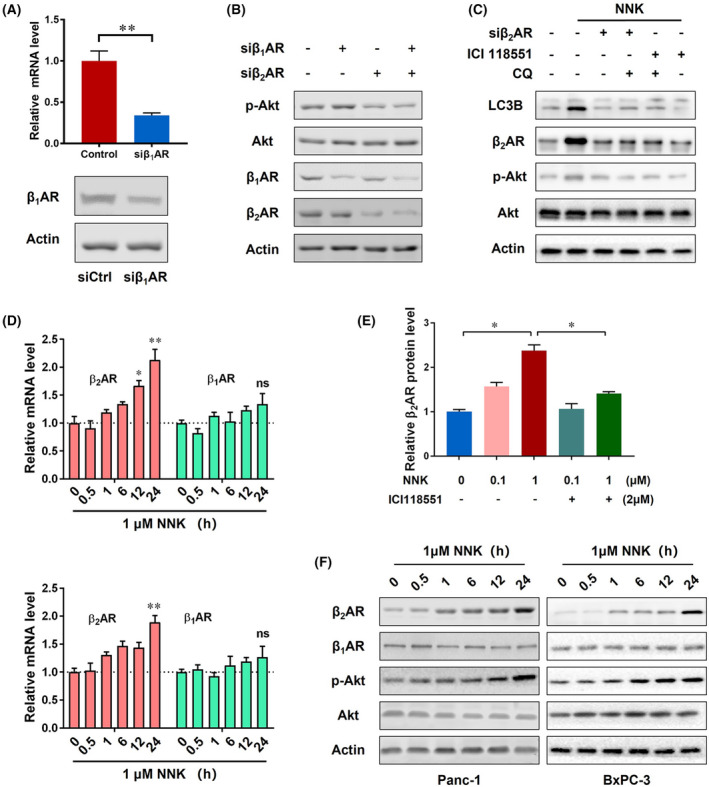
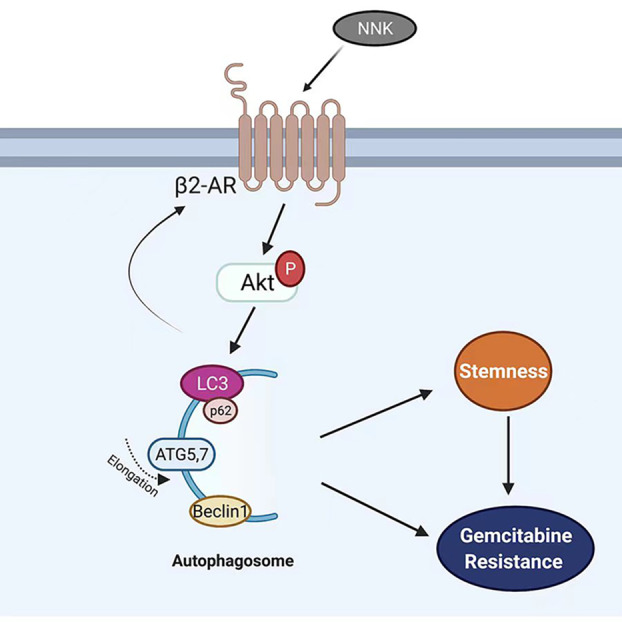
Low responsiveness to chemotherapy is an important cause of poor prognosis in pancreatic cancer. Smoking is a high-risk factor for pancreatic cancer and cancer resistance to gemcitabine; however, the underlying mechanisms remain unclear. 4-(methylnitrosamino)-1-(3-pyridyl)-1-butanone (NNK) is the main metabolite of tobacco burning and has been shown to be associated with cancer development and chemoresistance. However, in pancreatic cancer, its mechanism remains poorly understood. In this study, we found that NNK promoted stemness and gemcitabine resistance in pancreatic cancer cell lines. Moreover, NNK increased autophagy and elevated the expression levels of the autophagy-related markers autophagy-related gene 5 (ATG5), autophagy-related gene 7 (ATG7), and Beclin1. Furthermore, the results showed that NNK-promoted stemness and gemcitabine resistance was partially dependent on the role of NNK in cell autophagy, which is mediated by the β2-adrenergic receptor (β2AR)-Akt axis. Finally, we proved that NNK intervention could not only activate β2AR, but also increase its expression, making β2AR and Akt form a feedback loop. Overall, these findings show that the NNK-induced β2AR-Akt feedback loop promotes stemness and gemcitabine resistance in pancreatic cancer cells.

Keywords: NNK; autophagy; chemoresistance; pancreatic cancer; stemness.


Conflict of interest statement

The authors declare no conflicts of interest.

Figures

Fig. 1
Fig. 1
NNK strengthens stemness and chemoresistance in pancreatic cancer cells. (A) 1000 pancreatic cancer cells were seeded in a 6‐well plate with or without 1 μm 4‐(methylnitrosamino)‐1‐(3‐pyridyl)‐1‐butanone (NNK) treatment; the cell colony formation assay was performed for 10 days. Representative images are shown (left) and cell colony number was quantified (right; scale bar, 1 cm). Data are presented as mean ± SD of three separate experiments. **P < 0.01 by Student's t test. (B) Cells were treated with 1 μm NNK and representative images of the tumor sphere formation assay were captured (left) and sphere number of each group were quantified (right; scale bar, 50 μm). Data are presented as mean ± SD of three separate experiments. **P < 0.01 by Student's t test. (C) Panc‐1 and BxPC‐3 cells were treated with 1 μm NNK, western blot (left) and qPCR (right) of indicated markers were performed 48, 24 h later, respectively. Data are presented as mean ± SD of three separate experiments. **P < 0.01 by Student's t test. (D) Pancreatic cancer cells (20 000 for Panc‐1, 40 000 for BxPC‐3) were seeded in 12‐well plates and received the indicated treatments. The numbers of cancer cells were counted at the indicated timepoints. Data are presented as mean ± SD of three separate experiments. *P < 0.05; **P < 0.01 by one‐way ANOVA test. (E) 1000 pancreatic cancer cells were seeded in 6‐well plates with or without NNK (1 μm), gemcitabine (gem, 5 μm) treatment; cell colony formation assay was performed for 10 days. Representative images are shown and cell colony number was quantified (scale bar, 1 cm). Data are presented as mean ± SD of three separate experiments. **P < 0.01 by one‐way ANOVA test.
Fig. 2
Fig. 2
NNK induces autophagy in pancreatic cancer cells. (A) Panc‐1 cells treated with NNK with or without chloroquine (CQ) cotreatment for 24 h; representative immunofluorescence images of LC3 are shown (scale bar, 15 μm). (B) Panc‐1 cells were treated with increasing concentrations of NNK at the indicated timepoints with or without CQ treatment; protein levels were detected using western blot (upper) and quantified (lower). Data are presented as mean ± SD of three separate experiments. *P < 0.05 by one‐way ANOVA test. (C) Cells were transfected with mRFP‐GFP‐LC3 adenovirus, and 48 h later the cells were treated with 1 μm NNK for another 24 h. Cells were then fixed, and the images were captured using a confocal microscope (scale bar, 15 μm; left). Quantification of red and yellow fluorescent dots (middle and right). **P < 0.01 by Student's t test. (D) Levels of autophagy‐related gene 5 (ATG5), autophagy‐related gene 7 (ATG7), and Beclin1 in Panc‐1 cells treated with 1 μm NNK for 0, 6, 24 h (left). Levels of ATG5, ATG7, and Beclin1 in Panc‐1 cells treated with the indicated concentrations of NNK for 24 h (right). Data are presented as mean ± SD of three separate experiments. *P < 0.05; **P < 0.01 by one‐way ANOVA test. (E) Western blot to show protein expression of Panc‐1 cells treated with 1 μm NNK at the indicated timepoints (left). Panc‐1 cells were treated with the indicated concentrations of NNK and western blot was performed (right). (F) qRT‐PCR to show the knockdown efficiency in Panc‐1 cells. Data are presented as mean ± SD of three separate experiments. **P < 0.01 by one‐way ANOVA test. (G) Panc‐1 cells were pretreated with the indicated siRNA for 24 h, and then received NNK treatment for an additional 24 h; western blot was performed (left) and immunofluorescence of LC3 were performed, then the LC3 punctae was quantified (right). Data are presented as mean ± SD of three separate experiments. **P < 0.01 by one‐way ANOVA test.
Fig. 3
Fig. 3
NNK enhances the stemness and chemoresistance of pancreatic cancer cells by activating autophagy. (A) Panc‐1 cells were divided into a control group, NNK (1 μm) group, NNK (1 μm) plus CQ (10 μm) group, and NNK (1 μm) plus Autophinib (10 μm) group. Cells were seeded in 6‐well plates and a cell colony formation assay was performed for 10 days. Representative images are shown (left) and the cell colony number was quantified (right; scale bar, 1 cm). Data are presented as mean ± SD of three separate experiments. *P < 0.05 by one‐way ANOVA test. (B) Panc‐1 cells were treated as in Fig. 3A. Transwell‐based migration (upper) and invasion (lower) assays were performed and quantified (scale bar, 100 μm). Data are presented as mean ± SD of three separate experiments. *P < 0.05 by one‐way ANOVA test. (C) Panc‐1 cells were treated as in Fig. 3A, then stem cell sphere formation assay was performed. Sphere number (left) and diameter (right) were quantified. Data are presented as mean ± SD of three separate experiments. *P < 0.05 by one‐way ANOVA test. (D) qRT‐PCR showing mRNA changes in Panc‐1 cells with indicated treatments for 24 h. Data are presented as mean ± SD of three separate experiments. *P < 0.05 by one‐way ANOVA test. (E) Panc‐1 cells were seeded in 12‐well plates and then received the indicated treatments; cell numbers were counted and analyzed. Data are presented as mean ± SD of three separate experiments. *P < 0.05 by one‐way ANOVA test. (F) 1000 pancreatic cancer cells were seeded in 6‐well plates with the indicated treatments; cell colony formation assay was performed for 10 days. Representative images are shown (left) and cell colony number was quantified (right) (scale bar, 1 cm). Data are presented as mean ± SD of three separate experiments. *P < 0.05 by one‐way ANOVA test.
Fig. 4
Fig. 4
NNK promotes autophagy by modulating β2AR and Akt. (A) the mRNA (24 h) and protein (48 h) levels of β2‐adrenergic receptor (β2AR) were decreased by siRNA. Data are presented as mean ± SD of three separate experiments. **P < 0.01 by Student's t test. (B) Immunofluorescence staining (left) shows LC3 autophagy spots in the control group, NNK group, NNK plus siβ2AR group, NNK plus siβ2AR, and CQ group of Panc‐1 cells, and LC3 punctae was counted and analyzed (right) (scale bar, 15 μm). Data are presented as mean ± SD of three separate experiments. *P < 0.05 by one‐way ANOVA test. (C) The mRNA levels of ATG5, ATG7, and Beclin1 were determined in the control group, NNK group, NNK group, siβ2AR plus NNK group, and ICI118551 plus NNK group. Data are presented as mean ± SD of three separate experiments. **P < 0.01 compared with other groups by one‐way ANOVA test. (D) Panc‐1 cells were pretreated with LY294002 (10 μm) or CQ (10 μm), then received NNK (1 μm) treatment for 24 h. LC3 punctae was counted and analyzed by immunofluorescence microscopy. Data are presented as mean ± SD of three separate experiments. *P < 0.05 by one‐way ANOVA test. (E) Western blot to show LC3 protein change in each group of Panc‐1 cells 24 h after treatment. (F) qRT‐PCR showing mRNA changes in Panc‐1 cells 24 h after receiving the indicated treatments. Data are presented as mean ± SD of three separate experiments. **P < 0.01 compared with other groups by one‐way ANOVA test.
Fig. 5
Fig. 5
NNK forms a potential β2AR‐Akt feedback loop in pancreatic cancer cells autophagy. (A) The mRNA and protein levels of β1‐adrenergic receptor (β1AR) were decreased by siRNA. Data are presented as mean ± SD of three separate experiments. **P < 0.01 by Student's t test. (B) Western blot assay to detect indicated proteins when cells treated with siβ1AR or siβ2AR 24 h after treatment. (C) Panc‐1 cells were pretreated with siβ2AR, ICI118551 (10 μm), CQ (10 μm), then received NNK (1 μm) treatment for 24 h, and immunoblotting was performed. (D) Panc‐1 (upper) and BxPC‐3 (lower) cells were treated with NNK (1 μm) for the indicated hours and cell total RNA was extracted. qRT‐PCR was performed to examine the mRNA levels of β1AR and β2AR. Data are presented as mean ± SD of three separate experiments. * p  < 0.05; **P < 0.01 compared with the control group by one‐way ANOVA test. (E) Relative protein levels of β2AR when cells were treated with NNK or ICI 118551. Data are presented as mean ± SD of three separate experiments. *P < 0.05 by one‐way ANOVA test. (F) Western blot to show protein expression levels when cells received NNK treatment at the indicated timepoints.
Fig. 6
Fig. 6
Proposed working model of NNK in pancreatic cancer. β2AR, activated by NNK, increase the Akt activity and further promote autophagy, which leads to the formation of stemness and gemcitabine resistance of pancreatic cancer cells. Activation of Akt or downstream signals can increase β2AR expression in a feedback loop.

Similar articles

Cited by

References

    1. Siegel RL, Miller KD, Fuchs HE, Jemal A. Cancer statistics, 2021. CA Cancer J Clin. 2021;71:7–33. 10.3322/caac.21654 - DOI - PubMed
    1. Klein AP. Pancreatic cancer: a growing burden. Lancet Gastroenterol Hepatol. 2019;4:895–6. 10.1016/S2468-1253(19)30323-1 - DOI - PMC - PubMed
    1. Siersema PD. Pancreatic cancer awareness issue 2019. Endoscopy. 2019;51:1009. 10.1055/a-1019-5433 - DOI - PubMed
    1. Midha S, Chawla S, Garg PK. Modifiable and non‐modifiable risk factors for pancreatic cancer: a review. Cancer Lett. 2016;381:269–77. 10.1016/j.canlet.2016.07.022 - DOI - PubMed
    1. Sarvepalli D, Rashid MU, Rahman AU, Ullah W, Hussain I, Hasan B, et al. Gemcitabine: a review of chemoresistance in pancreatic cancer. Crit Rev Oncog. 2019;24:199–212. 10.1615/CritRevOncog.2019031641 - DOI - PubMed

Publication types