Walking and resting blood pressure: An inter-individual response difference meta-analysis of randomized controlled trials
- PMID: 35593130
- PMCID: PMC10358505
- DOI: 10.1177/00368504221101636
Walking and resting blood pressure: An inter-individual response difference meta-analysis of randomized controlled trials
Abstract
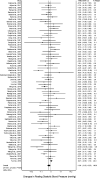
While walking is associated with reductions in resting SBP and DBP, a lack of true IIRD exists, suggesting that factors other than training response variation (random variation, physiological responses associated with behavioral changes that are not the result of walking) are responsible for the observed variation in resting SBP and DBP.
Keywords: Walking; adults; blood pressure; hypertension; meta-analysis.
Conflict of interest statement
The author(s) declared no potential conflicts of interest with respect to the research, authorship, and/or publication of this article.
Figures


Similar articles
-
Inter-individual response differences on resting blood pressure as a result of qigong in adults: An ancillary meta-analysis of randomized trials.Complement Ther Med. 2022 Jun;66:102818. doi: 10.1016/j.ctim.2022.102818. Epub 2022 Feb 22. Complement Ther Med. 2022. PMID: 35217171 Review.
-
Isometric exercise and inter-individual response differences on resting systolic and diastolic blood pressure in adults: a meta-analysis of randomized controlled trials.Blood Press. 2021 Oct;30(5):310-321. doi: 10.1080/08037051.2021.1940837. Epub 2021 Jun 26. Blood Press. 2021. PMID: 34176377
-
Response variation as a result of tai chi on resting blood pressure in hypertensive adults: An aggregate data meta-analysis.Complement Ther Clin Pract. 2022 Nov;49:101641. doi: 10.1016/j.ctcp.2022.101641. Epub 2022 Jul 18. Complement Ther Clin Pract. 2022. PMID: 35870250 Review.
-
Effect of isometric handgrip training on resting blood pressure in adults: a meta-analysis of randomized controlled trials.J Sports Med Phys Fitness. 2017 Jan-Feb;57(1-2):154-160. doi: 10.23736/S0022-4707.16.05887-4. Epub 2015 Nov 11. J Sports Med Phys Fitness. 2017. PMID: 26558836
-
Effects of resistance training on body weight and body composition in older adults: An inter-individual response difference meta-analysis of randomized controlled trials.Sci Prog. 2023 Apr-Jun;106(2):368504231179062. doi: 10.1177/00368504231179062. Sci Prog. 2023. PMID: 37302150 Free PMC article.
Cited by
-
Effect of a Remotely Delivered Self-directed Behavioral Intervention on Body Weight and Physical Health Status Among Adults With Obesity: The D-ELITE Randomized Clinical Trial.JAMA. 2022 Dec 13;328(22):2230-2241. doi: 10.1001/jama.2022.21177. JAMA. 2022. PMID: 36511927 Free PMC article. Clinical Trial.
-
Effectiveness of backward gait training on body composition, cardiopulmonary fitness, inflammation, and metabolic marker in adults: A systematic review and meta-analysis.Int J Crit Illn Inj Sci. 2024 Apr-Jun;14(2):101-111. doi: 10.4103/ijciis.ijciis_74_23. Epub 2024 Jun 21. Int J Crit Illn Inj Sci. 2024. PMID: 39005976 Free PMC article. Review.
-
Resistance training and inter-interindividual response differences on cardiorespiratory fitness in older adults: An ancillary meta-analysis of randomized controlled trials.Sci Prog. 2024 Jan-Mar;107(1):368504241227088. doi: 10.1177/00368504241227088. Sci Prog. 2024. PMID: 38312013 Free PMC article. Review.
-
Effects of ketogenic diet on health outcomes: an umbrella review of meta-analyses of randomized clinical trials.BMC Med. 2023 May 25;21(1):196. doi: 10.1186/s12916-023-02874-y. BMC Med. 2023. PMID: 37231411 Free PMC article.
-
Device-Measured 24-Hour Movement Behaviors and Blood Pressure: A 6-Part Compositional Individual Participant Data Analysis in the ProPASS Consortium.Circulation. 2025 Jan 14;151(2):159-170. doi: 10.1161/CIRCULATIONAHA.124.069820. Epub 2024 Nov 6. Circulation. 2025. PMID: 39504653 Free PMC article.
References
-
- GBD 2015 Risk Factors Collaborators. Global, regional, and national comparative risk assessment of 79 behavioural, environmental and occupational, and metabolic risks or clusters of risks, 1990–2015: a systematic analysis for the Global Burden of Disease Study 2015. Lancet 2016; 388: 1659–1724. 2016/10/14. - PMC - PubMed
-
- World Health Organization. Guideline for the pharmacological treatment of hypertension in adults. Geneva, Switzerland: World Health Organization, 2021. - PubMed
-
- Kearney PM, Whelton M, Reynolds K, et al. Global burden of hypertension: analysis of worldwide data. Lancet 2005; 365: 217–223. - PubMed
-
- Gaziano TA, Bitton A, Anand S, et al. The global cost of nonoptimal blood pressure. J Hypertens 2009; 27: 1472–1477. 2009/05/29. - PubMed
MeSH terms
LinkOut - more resources
Full Text Sources
Medical

