. 2022 Dec;11(24):4865-4879.
doi: 10.1002/cam4.4817. Epub 2022 May 20.

One-year COVID-19 outcomes on the oncology care patient pathway: Results of a French descriptive, cross-sectional comprehensive study (ONCOCARE-COV)

Affiliations

One-year COVID-19 outcomes on the oncology care patient pathway: Results of a French descriptive, cross-sectional comprehensive study (ONCOCARE-COV)

Léonard Laurent et al. Cancer Med. 2022 Dec.

Abstract

Background: The COVID-19 pandemic led to a widely documented disruption in cancer care pathway. Since a resurgence of the pandemic was expected after the first lockdown in France, the global impact on the cancer care pathway over the year 2020 was investigated.

Aims: This study aimed to describe the changes in the oncology care pathway for cancer screening, diagnosis, assessment, diagnosis annoucement procedure and treatment over a one-year period.

Materials & methods: The ONCOCARE-COV study was a comprehensive, retrospective, descriptive, and cross-sectional study comparing the years 2019 and 2020. All key indicators along the cancer care pathway assessing the oncological activity over four periods were described. This study was set in a high-volume, public, single tertiary care center divided in two complementary sites (Reims University Hospital and Godinot Cancer Institute, Reims, France) which was located in a high COVID-19 incidence area during both peaks of the outbreak.

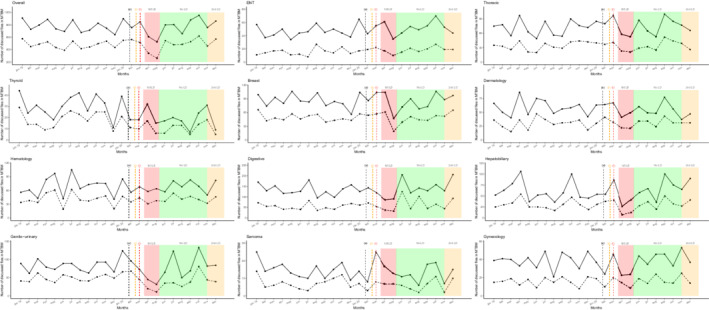
Results: A total of 26,566 patient's files were active during the year 2020. Breast screening (-19.5%), announcement dedicated consultations (-9.2%), Intravenous and Hyperthermic Intraoperative Intraperitoneal Chemotherapy (HIPECs) (-25%), and oncogeriatric evaluations (-14.8%) were heavily disrupted in regard to 2020 activity. We identified a clear second outbreak wave impact on medical announcement procedures (October, -14.4%), radiotherapy sessions (October, -16%), number of new health record discussed in multidisciplinary tumor board meeting (November, -14.6%) and HIPECs (November, -100%). Moreover, 2020 cancer care activity stagnated compared to 2019.

Discussion: The oncological care pathway was heavily disrupted during the first and second peaks of the COVID-19 outbreak. Between lockdowns, we observed a remarkable but non-compensatory recovery as well as a lesser impact from the pandemic resurgence. However, in absence of an increase in activity, a backlog persisted.

Conclusion: Public health efforts are needed to deal with the consequences of the COVID-19 pandemic on the oncology care pathway.

Keywords: COVID-19 pandemic; backlog; cancer care pathway; lockdowns.


Conflict of interest statement

Claire Carlier reported receiving honoraria as a speaker from Bristol Myers Squibb unrelated to this work. Damien Botsen reported receiving honoraria as a speaker and/or in an advisory role from Accord Healthcare, Amgen, Sanofi, Servier, and Pierre Fabre unrelated to this work. Florian Slimano reported receiving honoraria as a speaker and/or in an advisory role from Gilead, and Astra‐Zeneca unrelated to this work. Olivier Bouche reported receiving honoraria as a speaker and/or in an advisory role from Merck KGaA, Roche Genentech, Bayer, Astra‐Zeneca, Grunenthal, MSD, Amgen, Sanofi, Servier, and Pierre Fabre unrelated to this work. All other authors have no conflict of interest.

Figures

FIGURE 1
FIGURE 1
Temporal curves of monthly diagnostic and assessment oncological activity volume (between January 2019 and December 2020) at the Reims University Hospital and Cancer Institute (France), of weekly number of COVID‐19 inpatients. And cumulated number of death due to COVID‐19. The plain curve represents the number of procedures per month between January 2019 and December 2020. The dashed curve in B represents the number of positive FIT. (A) Number of mammograms performed in Marne département. (B) Number of FIT performed in Marne département. (C) Number of overall carcinologic histopathological analyses. (D) Number of overall biomolecular analyses (somatic and germline). (E) Number of interventional radiology diagnostic procedures performed. (F) Number of medical diagnostic announcement. (G) Number of personalized care plan given to patients. (H) Number of post announcement nurse consultations. (I) Number of oncogeriatric evaluations. (J) Mean weekly number of COVID‐19 inpatients. (K) Cumulated number of death due to COVID‐19. (a) The black dashed vertical line marks timeline of first diagnosed COVID‐19 patient in France (January 24, 2020). (b) The orange dashed vertical line marks timeline of first COVID‐19 deceased patient in France (February 15, 2020). (c) The red dashed vertical line marks timeline of first COVID‐19 admitted patient in Reims (February 27, 2020). (d) The red area marks a period of FIT stock shortage (from April 15, 2019 to July 25, 2019). The red area represents the first lockdown period from March 17 to May 11, 2020. The green area represents the period without lockdown from May 11 to October 31, 2020. The orange area represents the second lockdown period from October 31, 2020 to June 30, 2021. COVID‐19, coronavirus disease 2019; FIT, fecal immunochemical test; LD, lockdown; MTBM, multidisciplinary tumor board meetings; w, weeks.
FIGURE 2
FIGURE 2
Temporal curves of monthly MTBM activity volume (between January 2019 and December 2020) at the Reims University Hospital and Cancer Institute (France). The plain curve represents the number of overall files presented per month from January 2019 to December 2020. The dashed curve represents the number of new patients' files presented in MTBM per month from January 2019 to December 2020. (a) The black dashed vertical line marks timeline of first diagnosed COVID‐19 patient in France (January 24, 2020). (b) The orange dashed vertical line marks timeline of first COVID‐19 deceased patient in France (February 15, 2020). (c) The red dashed vertical line marks timeline of first COVID‐19 admitted patient in Reims (February 27, 2020). The red area represents the first lockdown period from March 17 to May 11, 2020. The green area represents the period without lockdown from May 11 to October 31, 2020. The orange area represents the second lockdown period from October 31, 2020 and June 30, 2021. COVID‐19, coronavirus disease 2019; ENT, ear, nose and throat; LD, lockdown; MTBM, multidisciplinary tumor board meetings.
FIGURE 3
FIGURE 3
Temporal curves of monthly therapeutic activity volume (between January 2019 and December 2020) at the Reims University Hospital and Cancer Institute (France). (a) The black dashed vertical line marks timeline of first diagnosed COVID‐19 patient in France (January 24, 2020). (b) The orange dashed vertical line marks timeline of first COVID‐19 deceased patient in France (February 15, 2020). (c) The red dashed vertical line marks timeline of first COVID‐19 admitted patient in Reims (February 27, 2020). (A) Number of active medical oncology patients. (B) Number of prepared chemotherapy units. (C) Number of implanted venous access devices. (D) Number of active radiotherapy patients. (E) Number of CT simulation sessions. (F) Number of radiotherapy courses performed. (G) Number of carcinologic surgeries performed. (H) Number of therapeutic interventional radiology procedures performed. (I) Number of hyperthermic intraperitoneal chemotherapy performed. The red area represents the first lockdown period from March 17 to May 11, 2020. The green area represents the period without lockdown from May 11 to October 31, 2020. The orange area represents the second lockdown period from October 31, 2020 and still ongoing. LD, lockdown; COVID‐19, coronavirus disease 2019.

References

    1. Timeline: WHO's COVID‐19 response [Internet]. Accessed December 16, 2020. https://www.who.int/emergencies/diseases/novel‐coronavirus‐2019/interact...
    1. SPF . COVID‐19: point épidémiologique du 7 janvier 2021 [Internet]. Accessed February 23, 2021. https://www.santepubliquefrance.fr/maladies‐et‐traumatismes/maladies‐et‐...
    1. Blecker S, Jones SA, Petrilli CM, et al. Hospitalizations for chronic disease and acute conditions in the time of COVID‐19. JAMA Intern Med. 2021;181(2):269‐271. - PMC - PubMed
    1. Baum A, Schwartz MD. Admissions to Veterans Affairs hospitals for emergency conditions during the COVID‐19 pandemic. JAMA. 2020;324(1):96‐99. - PMC - PubMed
    1. Bodilsen J, Nielsen PB, Søgaard M, et al. Hospital admission and mortality rates for non‐covid diseases in Denmark during covid‐19 pandemic: nationwide population based cohort study. BMJ. 2021;373:n1135. - PMC - PubMed