. 2022 Jul;31(14):3761-3783.
doi: 10.1111/mec.16539. Epub 2022 Jun 16.

Seasonal dynamics of marine protist communities in tidally mixed coastal waters

Affiliations

Seasonal dynamics of marine protist communities in tidally mixed coastal waters

Mariarita Caracciolo et al. Mol Ecol. 2022 Jul.

Abstract

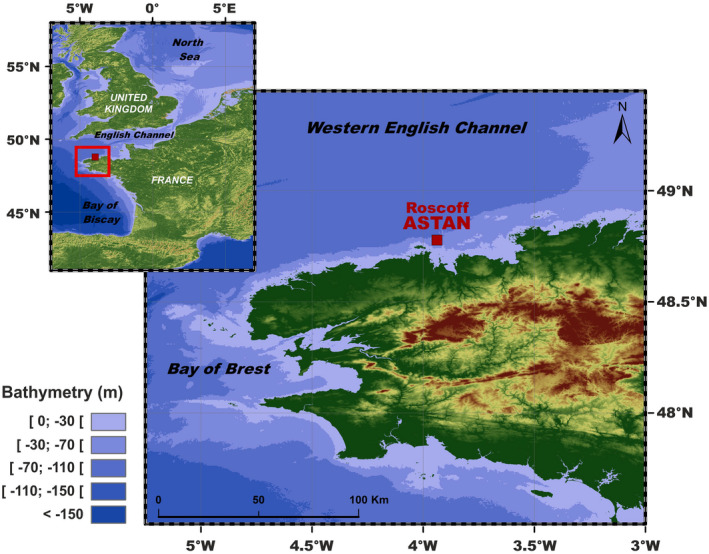
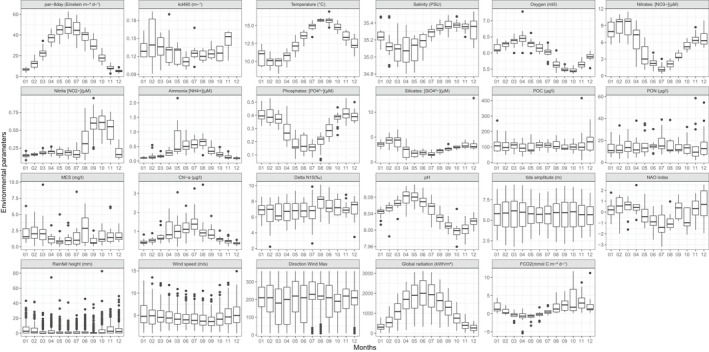
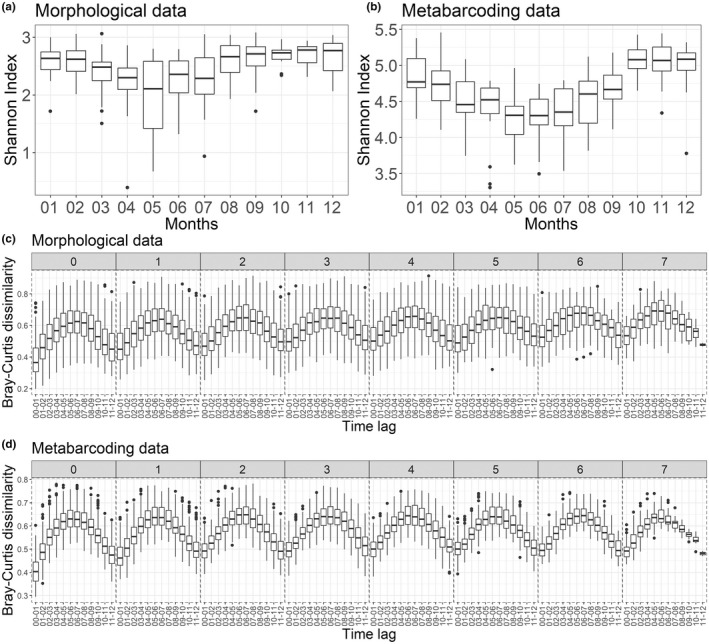
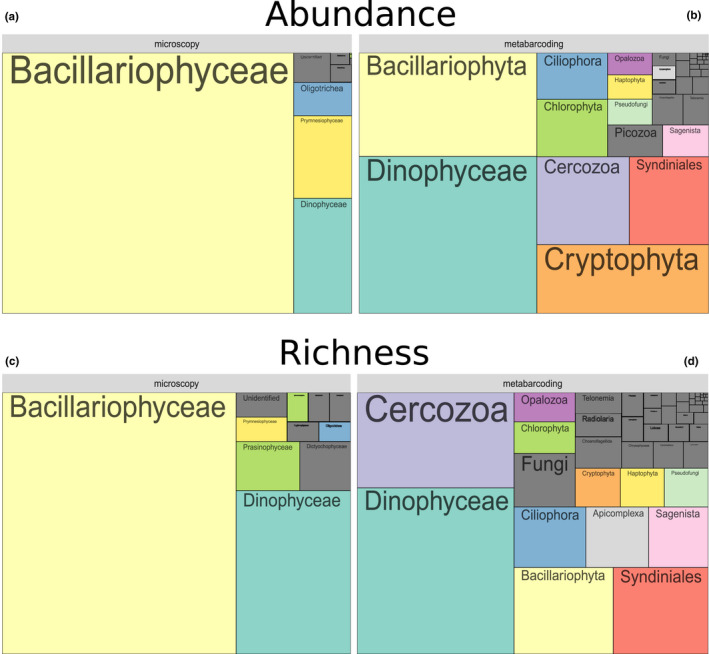
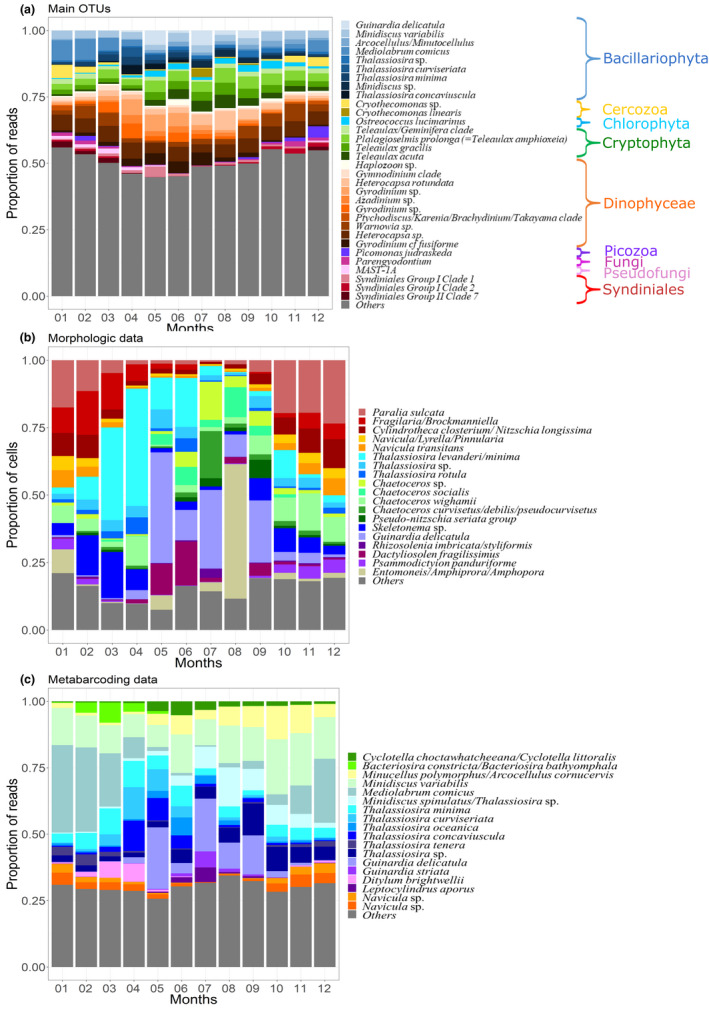
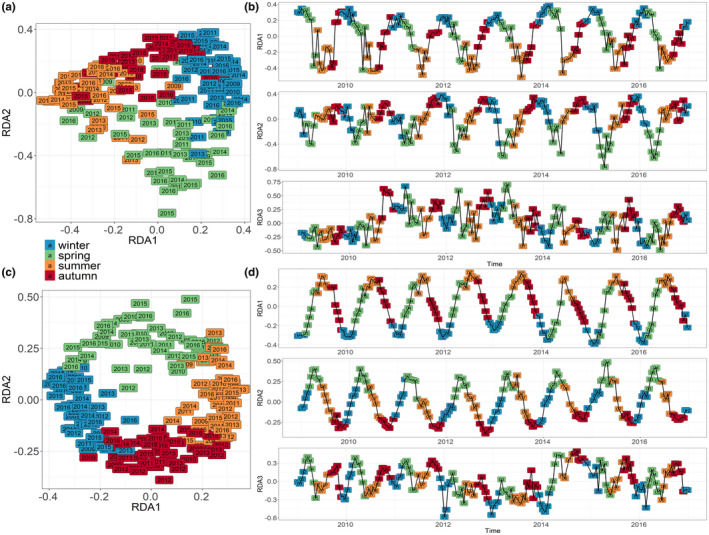
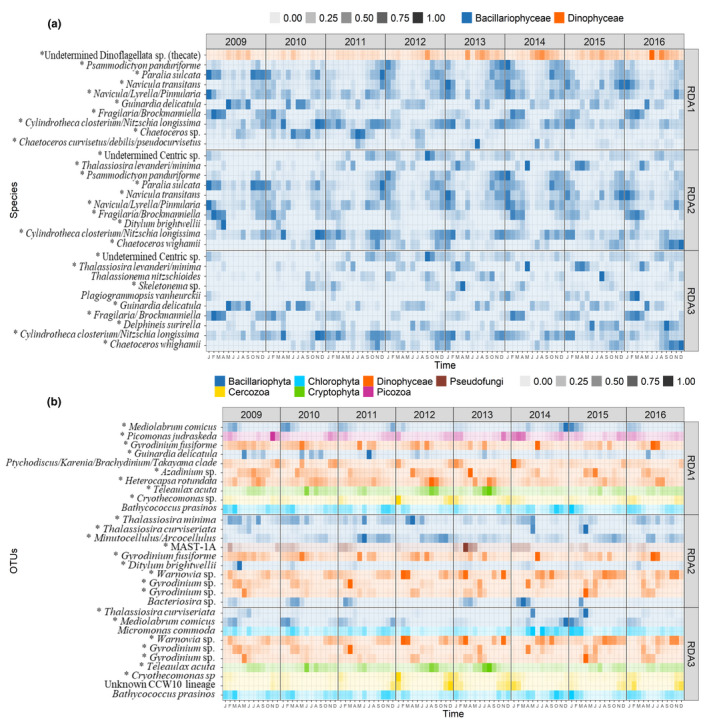
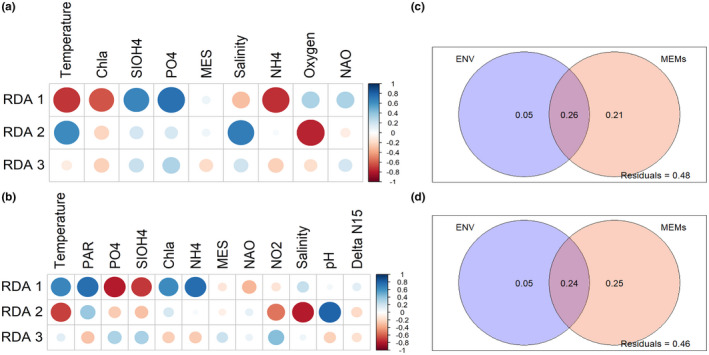
Major seasonal community reorganizations and associated biomass variations are landmarks of plankton ecology. However, the processes of plankton community turnover rates have not been fully elucidated so far. Here, we analyse patterns of planktonic protist community succession in temperate latitudes, based on quantitative taxonomic data from both microscopy counts (cells >10 μm) and ribosomal DNA metabarcoding (size fraction >3 μm, 18S rRNA gene) from plankton samples collected bimonthly over 8 years (2009-2016) at the SOMLIT-Astan station (Roscoff, Western English Channel). Based on morphology, diatoms were clearly the dominating group all year round and over the study period. Metabarcoding uncovered a wider diversity spectrum and revealed the prevalence of Dinophyceae and diatoms but also of Cryptophyta, Chlorophyta, Cercozoa, Syndiniales and Ciliophora in terms of read counts and or richness. The use of morphological and molecular analyses in combination allowed improving the taxonomic resolution and to identify the sequence of the dominant species and OTUs (18S V4 rDNA-derived taxa) that drive annual plankton successions. We detected that some of these dominant OTUs were benthic as a result of the intense tidal mixing typical of the French coasts in the English Channel. Our analysis of the temporal structure of community changes point to a strong seasonality and resilience. The temporal structure of environmental variables (especially Photosynthetic Active Radiation, temperature and macronutrients) and temporal structures generated by species life cycles and or species interactions, are key drivers of the observed cyclic annual plankton turnover.

Keywords: DNA metabarcoding; Western English Channel; annual succession; marine protists; temporal variability; time-series data.


Conflict of interest statement

All authors declare that they have no conflict of interest.

Figures

FIGURE 1
FIGURE 1
Location of the study area. The SOMLIT‐Astan sampling station (48:46′49″ N; 3:58′14″ W) is located in the Western English Channel, 3.5 km from the coast. The water column at this site is 60 m deep and is never stratified due to intense tidal mixing. The site is strongly impacted by storms in winter
FIGURE 2
FIGURE 2
Monthly variations of the hydrological and meteorological parameters at the SOMLIT‐Astan station in the period 2009–2016. Sampling was carried out at high neap tides. PAR is the photosynthetically available radiation calculated as the average light received during the 8 days before sampling. Kd490 is intended as the diffuse attenuation coefficient for downwelling irradiance at 490 nm. Interannual variations of all parameters presented in this figure can be found in Figure S2
FIGURE 3
FIGURE 3
Changes in alpha and beta diversity calculated for the protist assemblages over the period 2009–2016 at the SOMLIT‐Astan sampling station. (a,b) Seasonal variations in the Shannon indexes calculated for the period 2009–2016. (c,d) Interannual recurrence of protist communities shown by the variations in the bray–Curtis dissimilarity index between samples collected along the 2009–2016 period, as a function of increasing lag between sampling dates. The lag values between samples, for each box plot correspond to a number of years (facet labels, from 0 to 7) plus a number of months (x‐axis of each facet, expressed as ranges). For example, the lag between samples considered for the first box plot is 0 years and 0 to 1 months and the lag between samples considered for the last box‐plot in 7 years and 11 to 12 months. Panels (a) and (c) are based on the morphological data set (cell counts) while graphs (b) and (d) are based on the metabarcoding data set
FIGURE 4
FIGURE 4
Low‐taxonomic resolution contribution of protists at the SOMLIT‐Astan time‐series station over the period 2009–2016. The tree maps show the overall contributions of the main phyla or classes to abundance of (a) the 12 main phytoplankton classes for the morphological data set; and (b) the 52 main phyla—or classes—Calculated from the metabarcoding data set and to the (c) total species or (d) OTU richness
FIGURE 5
FIGURE 5
Typical seasonal variations of the dominant OTUs and overall contribution of the major diatoms species to the protist assemblage at the SOMLIT‐Astan sampling station over the period 2009–2016. The histograms show the contributions (a) to total DNA reads abundance of the 32 dominating OTUs (accounting for 51.5% of all reads), (b) of the main diatoms to total diatoms abundances (microscopy count of plankton >10 μm) and (c) of the main diatoms to total diatom reads abundances. All microscopy counts and OTUs were assigned at the highest taxonomic level. Species selected were the 10 most abundant (5 for diatoms) for at least one month, taking into account mean monthly abundances
FIGURE 6
FIGURE 6
Similarity of protist communities (RDA analysis) in monthly samples over the period 2009–2016 at SOMLIT‐Astan sampling station for morphological microscopy (a,b), and DNA metabarcoding (c,d) data sets. (a,c) Annual cycle of protist communities obtained by ordination of the monthly samples through a redundancy analysis (RDA) explaining (a) 48.9% and (b) 52.2% of the total variance of the community, respectively. (b,d) Decomposition of RDA axes that reveals seasonal pattern (RDA1; 19.8%–17.8% and RDA2; 11.5%–9.3%) and biannual broadscale oscillation (RDA3; 4.8%–3.9%)
FIGURE 7
FIGURE 7
Monthly mean abundance (2009–2016), at the SOMLIT‐Astan sampling site, for (a) the morphological species and (b) molecular OTUs as a function of the first three RDA axes (see Figure 6). For each RDA axis the (a) 10 species and (b) 10 OTUs with the highest score were selected. The * indicates dominant OTUs (reported in Figure 5)
FIGURE 8
FIGURE 8
Spearman's correlation calculated between the environmental variables and the RDA axes (a,c), and variance partitioning analyses between environmental drivers and dbMEM (b,d). Spearman's correlations were computed between each axes of the RDA and each environmental parameter selected for (a) morphology and (b) metabarcoding. Variance partitioning between selected environmental variables and dbMEM was also calculated for (c) morphology and (d) metabarcoding data, respectively

References

    1. Allen, W. E. (1936). Occurrence of marine plankton diatoms in a ten year series of daily catches in Southern California. American Journal of Botany, 23(1), 60–63.
    1. Altenburger, A. , Blossom, H. E. , Garcia‐Cuetos, L. , Jakobsen, H. H. , Carstensen, J. , Lundholm, N. , Hansen, P. J. , Moestrup, Ø. , & Haraguchi, L. (2020). Dimorphism in cryptophytes—The case of Teleaulax amphioxeia/Plagioselmis prolonga and its ecological implications. Science Advances, 6(37), 1–9. 10.1126/sciadv.abb1611 - DOI - PMC - PubMed
    1. Aminot, A. , & Kérouel, R. (2007). Dosage automatique des nutriments dans les eaux marines: méthodes en flux continu. In Méthodes d’analyses en milieu marin, (pp. 250). Editions Ifremer.
    1. Arsenieff, L. , le Gall, F. , Rigaut‐Jalabert, F. , Mahé, F. , Sarno, D. , Gouhier, L. , Baudoux, A. C. , & Simon, N. (2020). Diversity and dynamics of relevant nanoplanktonic diatoms in the Western English Channel. ISME Journal, 14(8), 1966–1981. 10.1038/s41396-020-0659-6 - DOI - PMC - PubMed
    1. Arsenieff, L. , Simon, N. , Rigaut‐Jalabert, F. , le Gall, F. , Chaffron, S. , Corre, E. , Com, E. , Bigeard, E. , & Baudoux, A. C. (2019). First viruses infecting the marine diatom Guinardia delicatula. Frontiers in Microbiology, 9, 3235. 10.3389/fmicb.2018.03235 - DOI - PMC - PubMed

Publication types

Substances

LinkOut - more resources