. 2022 Jun 6;219(6):e20211756.
doi: 10.1084/jem.20211756. Epub 2022 May 20.

The long noncoding RNA Malat1 regulates CD8+ T cell differentiation by mediating epigenetic repression

Affiliations

The long noncoding RNA Malat1 regulates CD8+ T cell differentiation by mediating epigenetic repression

Jad N Kanbar et al. J Exp Med. .

Abstract

During an immune response to microbial infection, CD8+ T cells give rise to short-lived effector cells and memory cells that provide sustained protection. Although the transcriptional programs regulating CD8+ T cell differentiation have been extensively characterized, the role of long noncoding RNAs (lncRNAs) in this process remains poorly understood. Using a functional genetic knockdown screen, we identified the lncRNA Malat1 as a regulator of terminal effector cells and the terminal effector memory (t-TEM) circulating memory subset. Evaluation of chromatin-enriched lncRNAs revealed that Malat1 grouped with trans lncRNAs that exhibit increased RNA interactions at gene promoters and gene bodies. Moreover, we observed that Malat1 was associated with increased H3K27me3 deposition at a number of memory cell-associated genes through a direct interaction with Ezh2, thereby promoting terminal effector and t-TEM cell differentiation. Our findings suggest an important functional role of Malat1 in regulating CD8+ T cell differentiation and broaden the knowledge base of lncRNAs in CD8+ T cell biology.


Conflict of interest statement

Disclosures: G.W. Yeo is a co-founder, member of the Board of Directors, on the SAB, equity holder, and paid consultant for Locanabio and Eclipse BioInnovations. In addition, G.W. Yeo is a visiting professor at the National University of Singapore. G.W. Yeo’s interest(s) have been reviewed and approved by the University of California, San Diego in accordance with its conflict-of-interest policies. J.T. Chang reported grants from Takeda and Eli Lilly outside the submitted work. No other disclosures were reported.

Figures

None
Graphical abstract
Figure 1.
Figure 1.
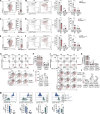
In vivo shRNA screen reveals lncRNA Malat1 as a critical regulator of CD8+ T cell differentiation. (A) CD45.1+ P14 T cells were transduced with a shRNA pool; 7 d after infection TE- (KLRG1hiCD127lo) and MP-phenotype (KLRG1loCD127hi) cells were isolated by FACS. (B) Enrichment of shRNA construct in MP cells relative to TE cells, reported as the average Z-score from two independent screens, n = 20 mice per screen (left). Validation of three Malat1KD shRNAs in activated CD8+ T cells with locus coordinates for each Malat1 primer set (right). FC, fold change. (C) P14 CD8+ T cells were transduced with Malat1 shRNA (Malat1KD, CD45.1) or nontarget shRNA (NT, CD45.1.2) and adoptively co-transferred at a 1:1 ratio into CD45.2 recipient mice that were subsequently infected with LCMV. Splenocytes were harvested on days 3, 5, and 7. (D) Quantification of total splenic NT and Malat1KD ratios at day 3, 5, and 7 after infection. (E–G) Quantification of splenic NT and Malat1KD KLRG1hi and KLRG1lo-phenotype cells, representative flow cytometry plots (E), quantification of frequencies (F), and numeric ratio of cells (G). (H–J) Quantification of splenic NT and Malat1KD CX3CR1hiKLRG1hi and CX3CR1loKLRG1lo-phenotype cells, representative flow cytometry plots (H), quantification of frequencies (I), and numeric ratio of cells (J). (K) Quantification of key effector- and memory-associated molecules in KLRG1hi-and KLRG1lo-phenotype cells. gMFI, geometric mean fluorescence intensity. (L and M) Frequency of Ki-67+ (L) and Annexin V+ (M) cells in KLRG1hi- and KLRG1lo-phenotype cells on days 5 and 7 after infection. (N and O) Malat1KD and NT cells on day 7 after infection were cultured ex vivo in the presence of cognate gp33-41 peptide for 5 h and frequency of IL-2+ (N) or IFNγhiTNFhi (O) cells measured. All data are from one representative experiment out of two independent experiments with n = 5–6 per group; *, P < 0.05; **, P < 0.005; ***, P < 0.0005 paired t test (F, I, and K–O), one sample t test (D, G, and J) . Graphs indicate mean ± SEM, symbols represent individual mice. D, day.
Figure S1.
Figure S1.
lncRNA Malat1 regulates CD8+ T cell differentiation. P14 CD8+ T cells were transduced with Malat1 shRNA (Malat1KD, CD45.1) or nontarget shRNA (NT, CD45.1.2) and adoptively co-transferred at a 1:1 ratio into CD45.2 recipient mice that were subsequently infected with LCMV (see Fig. 1 C). (A, C, and E) Quantification of splenic NT and Malat1KD (A), Malat1KD #2 (C), or Malat1KD #3 (E) ratios at day 7. (B, D, and F) Representative flow cytometry plots of TE- and MP-phenotype cells (left) and quantification (right) among co-transferred cells. (G–I) Quantification of splenic NT and Malat1KD CD62LhiCD44hi and CD62LloCD44hi-phenotype cells, representative flow cytometry plots (G), quantification of frequencies (H), and numeric ratio of cells (I) at days 3, 5, and 7. (J–L) Quantification of splenic NT and Malat11KD CD127hiCD62Lhi-, CD127hiCD62Llo-, and CD127loCD62Llo-phenotype cells, representative flow cytometry plots (J), quantification of frequencies (K), and numeric ratio of cells (L) at days 3, 5, and 7. (M) Representative flow cytometry plots and quantification of key TE- and MP-associated molecules at day 7. All data are from one representative experiment out of two independent experiments with n = 5–6 per group; *, P < 0.05; **, P < 0.005; ***, P < 0.0005, paired t test (A–F, H, K, and M), one sample t test (I and L). Graphs indicate mean ± SEM, symbols represent individual mice. D, day.
Figure 2.
Figure 2.
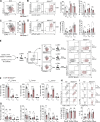
Malat1 regulates CD8+ T cell memory formation and represses generation of secondary TEM cells. (A and C) Quantification of splenic NT and Malat1KD ratios on days 35 and 65 after infection. (B and D) Representative flow cytometry plots of t-TEM, TEM, and TCM cells (left) and quantification (right) among co-transferred cells. (E) P14 CD8+ T cells were transduced with Malat1 shRNA (Malat1KD, CD45.1) or nontarget shRNA (NT, CD45.1.2) and adoptively co-transferred at a 1:1 ratio into CD45.2 recipient mice, which were then infected with LCMV. 35 d after primary infection, Malat1KD and NT cells were sorted from t-TEM, TEM, or TCM subsets, mixed at a 1:1 (5,000 Malat1KD cells/5,000 NT cells) ratio, and adoptively transferred into naive CD45.2 recipient followed by infectious challenge with LCMV (secondary infection). (F) Frequency of secondary memory populations derived from transferred t-TEM (left), TEM (middle), and TCM (right) donor cells was assessed at 30 d after secondary LMCV infection. (G) Quantification of secondary memory subsets derived from t-TEM (left), TEM (middle), and TCM (right) donor populations. (H and I) Malat1KD and NT secondary t-TEM, TEM, and TCM cells were cultured ex vivo in the presence of cognate gp33-41 peptide for 5 h and frequency of IFNγhiTNFhi (H) or IL-2+ (I) cells measured. All data are from one representative experiment out of two independent experiments with n = 4–7 (AD), n = 9–10 (EG), or n = 4–6 (H and I) mice per group; *, P < 0.05; **, P < 0.005; ***, P < 0.0005, paired t test. Graphs indicate mean ± SEM, symbols represent individual mice. D, day.
Figure S2.
Figure S2.
lncRNA Malat1 regulates memory CD8+ T cell differentiation. P14 CD8+ T cells were transduced with Malat1 shRNA (Malat1KD #2 or Malat1KD #3, CD45.1) or nontarget shRNA (NT, CD45.1.2); cells were adoptively co-transferred at a 1:1 ratio into CD45.2 recipient mice that were subsequently infected with LCMV. (A and C) Quantification of splenic NT and Malat1KD #2 (A) or Malat1KD #3 (C) ratios at day 35 after infection. (B and D) Representative flow cytometry plots of t-TEM, TEM, and TCM cells (left) and quantification (right) among co-transferred cells. (E) Representative flow cytometry plots and quantification of t-TEM, TEM, and TCM cell-associated molecules. All data are from one representative experiment out of two independent experiments with n = 4–5 per group; *, P < 0.05; **, P < 0.005; ***, P < 0.0005, paired t test. Graphs indicate mean ± SEM, symbols represent individual mice. D, day.
Figure S3.
Figure S3.
lncRNA MALAT1 knockdown reduces siIEL TRM cell differentiation. (A) P14 CD8+ T cells were transduced with Malat1 shRNA (Malat1KD, Malat1KD #2, or Malat1KD #3, CD45.1) or nontarget shRNA (NT, CD45.1.2) and adoptively co-transferred at a 1:1 ratio into CD45.2 recipient mice that were subsequently infected with LCMV. (B) Quantification of siIEL NT and Malat1KD ratios at day 7 after infection. (C) Representative flow cytometry plots of CD69+CD103+-phenotype cells (left) and quantification (right) at day 7 after infection among co-transferred cells. (D, F, and H) Quantification of siIEL NT and Malat1KD (D), Malat1KD #2 (F), or Malat1KD #3 (H) ratios at day 35 after infection. (E, G, and I) Representative flow cytometry plots of TRM cells (left) and quantification (right) at day 35 among co-transferred cells. All data are from one representative experiment out of two independent experiments with n = 4–5 mice per group; **, P < 0.005, paired t test. Graphs indicate mean ± SEM, symbols represent individual mice. D, day.
Figure 3.
Figure 3.
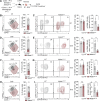
scRNA-seq reveals that Malat1 depletion upregulates memory-associated factors. (A) tSNE analysis of Malat1KD and NT cells on day 7 after LCMV infection. (B) Clustering analysis of Malat1KD and NT cells as one plot (left) or separated by sample type (right). (C) Bar graph quantifying proportion of Malat1KD and NT cells among each cluster type. (D and E) TE signature enrichment of all Malat1KD and NT cells displayed on tSNE plots (D) or split by scRNA-seq clusters (E). (F and G) MP signature enrichment of all Malat1KD and NT cells displayed on tSNE plots (F) or split by scRNA-seq clusters (G). (H and I) scRNA-seq expression profiles of genes relevant to CD8+ T cell trafficking (H) and effector and memory differentiation (I) in Malat1KD and NT cells split by scRNA-seq clusters. (J) Average expression profiles of genes relevant to CD8+ T cell differentiation, cytotoxicity, and trafficking in Malat1KD and NT cells split by scRNA-seq clusters. (K) Representative flow cytometry plots and quantification of protein expression of memory-associated genes and TE-associated genes in Malat1KD and NT KLRG1hi and KLRG1lo cells at days 5 and 7 after infection. All data are from one representative experiment out of two independent experiments with n = 57 mice per group; *, P < 0.05; **, P < 0.005; ***, P < 0.0005, paired t test. Graphs indicate mean ± SEM, symbols represent individual mice. D, day.
Figure S4.
Figure S4.
Characterizing lncRNAs in activated CD8+ T cells. (A) Reproducibility of GRID-seq libraries for expression of all RNA enriched chromatin (reads per kilobase, 1-kb binned genome; left) and DNA interaction level of all chromatin interacting RNA (reads per kilobase, 1-kb binned genome; right). (B) Differential lncRNA chromatin interaction regions between Clusters 2 and 3 lncRNAs displayed by direct comparison in a violin plot (left). Number of unique gene interactions between Clusters 2 or 3 lncRNAs (right). (C) Distribution of genomic annotations from differential lncRNA chromatin interaction regions between Clusters 2 and 3. Statistical significance was determined in by Student’s t test, ***, P < 0.0005 (B) and Pearson’s Chi-squared test, **, P < 0.005 (C).
Figure 4.
Figure 4.
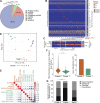
Malat1 clusters with trans lncRNAs that focus chromatin interactions on gene promoters and gene bodies. (A) Distribution of genome-wide RNA chromatin interactions in P14 CD8+ T cells 4 d after activation. snRNA, small nuclear RNA; miRNA, microRNA; rRNA, ribosomal RNA; snoRNA, small nucleolar RNA. GRID-seq analyses was performed in duplicate and samples pooled together for analysis. (B) Heatmap of chromatin-enriched lncRNA across the murine genome. Rows represent chromatin-enriched lncRNAsand columns represent the murine genome binned at 1-kb resolution. (C) Enlarged representative region of lncRNAs from chromosomes Chr 19 and X and their chromatin interactions on chromosomes 18, 19, and X at 1-kb resolution. (D) PCA plot and k-means clustering of all 66 lncRNAs colored by cluster groups. PCA vectors used were the entire mouse genome binned into 1-kb segments removing bins with zero interactions. lncRNAs with similar global genome chromatin interaction patterns clustered together. (E) Spearman correlation matrix plot and hierarchical clustering of 11 highly trans lncRNAs with rectangles surrounding each cluster. lncRNA gene names are color-coded to match colors of k-means clusters in D. (F) Differential lncRNA chromatin interaction regions between Cluster 2 and 1 lncRNAs, displayed by direct comparison in a violin blot with box-plot denoting median, 25th, and 75th percentile (left). Number of unique gene interactions between Cluster 2 and 1 lncRNAs (right). (G) Distribution of genomic annotations from differential lncRNA chromatin interaction regions of Cluster 2 and 1 lncRNAs (left) and Malat1 alone (right). Statistical significance was determined by Student’s t test, ***, P < 0.0005 (F) and Pearson’s Chi-squared test, ***, P < 0.0005 (G).
Figure 5.
Figure 5.
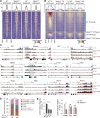
Malat1 enriches on chromatin marked by the epigenetic repressive histone mark H3K27me3. (A) Coverage heatmap of H3K27me3, H3K27ac, H4K3me3, and H3K4me1 epigenetic marks from TE cells (left) and H3K27me3 from MP cells (right) at Malat1-interacting genomic regions ±25 kb. (B and C) Cumulative distribution of coverage of each epigenetic mark from TE cells (B) and only the H3K27me3 mark from TE and MP cells (C) within Malat1-interacting regions at 100-kb resolution. (D) Normalized covered regions per 1,000 bp of each epigenetic mark at Malat1-interacting genomic regions. (E) Heatmap of Malat1 interaction level on gene bodies of TE- and MP-associated genes. (F) Probability density distribution of Malat1 interactions from E. (G) Malat1 RNA interaction level of differentially expressed genes in Cluster 0 cells compared to all other cells. (H) Heatmap representing expression of selected genes in Cluster 0 Malat1KD and NT cells compared to all other cells. Statistical significance was determined in by Student’s t test, ***, P < 0.0005 (B, C, F, and G).
Figure 6.
Figure 6.
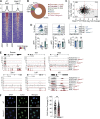
Malat1 interacts with Ezh2 to maintain H3K27me3 deposition on memory-associated genes. (A) Deposition of H3K27me3 and H3K4me3 centered on DMRs ± 2 kb in Malat1KD and NT cells at day 7 after infection. (B) Deposition of H3K27me3 ± 5 kb in FACS-purified TE and MP subsets of NT and Malat1KD cells. 3,646 peaks were enriched in NT relative to Malat1KD TE cells (blue annotation); conversely, 108 peaks were enriched in Malat1KD relative to NT TE cells (dark red annotation). 875 peaks were enriched NT relative to Malat1KD MP cells (light blue annotation); conversely, 209 peaks were enriched in Malat1KD relative to NT MP cells (light red annotation). (C) Alignment tracks of H3K27me3 in Malat1KD and NT TE and MP cells for key genes associated with memory and TE differentiation. Gray highlight denotes differential peak sites observed in NT relative to Malat1KD TE cells. (D) Genomic annotations of differential peak sites observed in Malat1KD and NT TE or MP cells. (E) Ezh2 pull-down RIP-qPCR analyses of Ezh2-bound RNA in WT CD8+ T cells (left) and Ezh2-bound lncRNA in Malat1KD and NT cells (right). Statistical significance was determined by Student’s t test, **, P < 0.005 (E) and Pearson’s Chi-squared test, **, P < 0.005 (D).
Figure S5.
Figure S5.
Impact of Malat1 knockdown on Ezh2 function and nuclear localization. (A) Deposition of Ezh2 centered on DMRs (Fig. 6 A) ± 2 kb in Malat1KD and NT cells at day 7 after infection. (B) Genomic annotations of DMRs from Fig. 6 A. (C) Log fold change of H3K27me3 deposition as a function of log fold change gene expression in Malat1KD versus NT cells at day 7 after infection. (D) Representative flow cytometry plot of H3K27me3, H3K4me3, and Ezh2 levels in Malat1KD and NT TE and MP cells at day 7 after infection. (E) Alignment tracks of H3K27me3 (Malat1KD and NT), H3K4me3 (Malat1KD and NT), Ezh2, and RNA expression (Malat1KD and NT) for key genes associated with memory cells. Gray highlight denotes H3K27me3 DMRs. (F) Ezh2 immunofluorescence in Malat1KD and NT cells 5 d after in vitro transduction (left) and bar graph quantification of area coverage of Ezh2 within the nucleus (right). Flow cytometry data are from one representative experiment out of two independent experiments with n = 4 mice per group (D); **, P < 0.005, paired t test. Graphs indicate mean ± SEM, symbols represent individual mice.

Similar articles

Cited by

References

    1. Arun, G., Aggarwal D., and Spector D.L.. 2020. MALAT1 long non-coding RNA: Functional implications. Noncoding RNA. 6:22. 10.3390/ncrna6020022 - DOI - PMC - PubMed
    1. Banerjee, A., Gordon S.M., Intlekofer A.M., Paley M.A., Mooney E.C., Lindsten T., Wherry E.J., and Reiner S.L.. 2010. Cutting edge: The transcription factor eomesodermin enables CD8+ T cells to compete for the memory cell niche. J. Immunol. 185:4988–4992. 10.4049/jimmunol.1002042 - DOI - PMC - PubMed
    1. Bernard, D., Prasanth K.V., Tripathi V., Colasse S., Nakamura T., Xuan Z., Zhang M.Q., Sedel F., Jourdren L., Coulpier F., et al. . 2010. A long nuclear-retained non-coding RNA regulates synaptogenesis by modulating gene expression. EMBO J. 29:3082–3093. 10.1038/emboj.2010.199 - DOI - PMC - PubMed
    1. Boland, B.S., He Z., Tsai M.S., Olvera J.G., Omilusik K.D., Duong H.G., Kim E.S., Limary A.E., Jin W., Milner J.J., et al. . 2020. Heterogeneity and clonal relationships of adaptive immune cells in ulcerative colitis revealed by single-cell analyses. Sci Immunol. 5:eabb4432. 10.1126/sciimmunol.abb4432 - DOI - PMC - PubMed
    1. Chang, J.T., Wherry E.J., and Goldrath A.W.. 2014. Molecular regulation of effector and memory T cell differentiation. Nat. Immunol. 15:1104–1115. 10.1038/ni.3031 - DOI - PMC - PubMed

Publication types

MeSH terms

Substances