

Grassland allergenicity increases with urbanisation and plant invasions
- PMID: 35594005
- PMCID: PMC9481851
- DOI: 10.1007/s13280-022-01741-z
Grassland allergenicity increases with urbanisation and plant invasions
Abstract
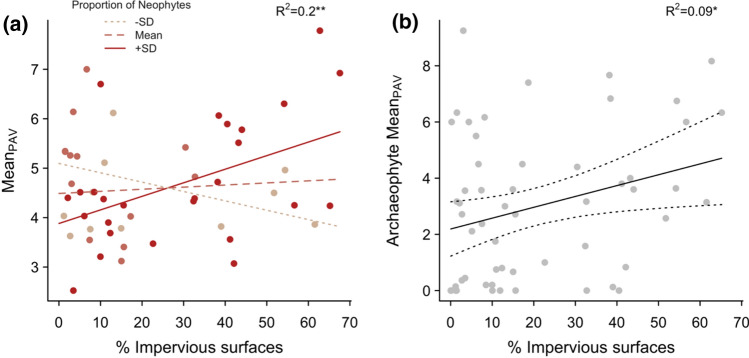
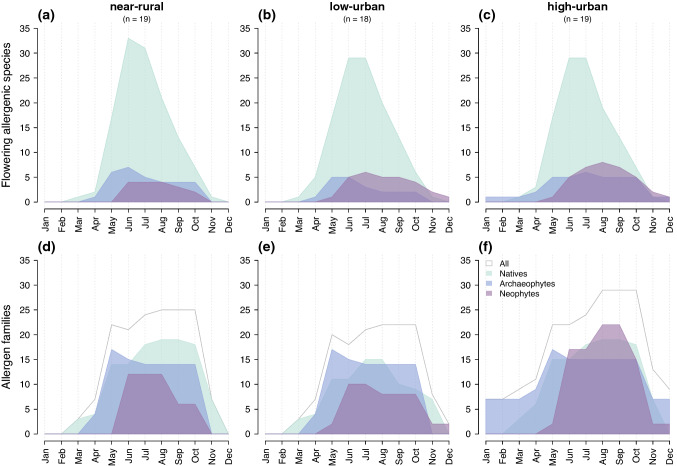
Pollen allergies have been on the rise in cities, where anthropogenic disturbances, warmer climate and introduced species are shaping novel urban ecosystems. Yet, the allergenic potential of these urban ecosystems, in particular spontaneous vegetation outside parks and gardens, remains poorly known. We quantified the allergenic properties of 56 dry grasslands along a double gradient of urbanisation and plant invasion in Berlin (Germany). 30% of grassland species were classified as allergenic, most of them being natives. Urbanisation was associated with an increase in abundance and diversity of pollen allergens, mainly driven by an increase in allergenic non-native plants. While not inherently more allergenic than native plants, the pool of non-natives contributed a larger biochemical diversity of allergens and flowered later than natives, creating a broader potential spectrum of allergy. Managing novel risks to urban public health will involve not only targeted action on allergenic non-natives, but also policies at the habitat scale favouring plant community assembly of a diverse, low-allergenicity vegetation. Similar approaches could be easily replicated in other cities to provide a broad quantification and mapping of urban allergy risks and drivers.
Keywords: Alien plants; Biochemical diversity; Ecosystem disservices; Novel ecosystems; Public health; Urban ecology.
© 2022. The Author(s).
Conflict of interest statement
The authors declare no conflict of interest.
Figures


Similar articles
-
Ecosystem functioning in urban grasslands: The role of biodiversity, plant invasions and urbanization.PLoS One. 2019 Nov 22;14(11):e0225438. doi: 10.1371/journal.pone.0225438. eCollection 2019. PLoS One. 2019. PMID: 31756202 Free PMC article.
-
Estimation of the Allergenic Potential of Urban Trees and Urban Parks: Towards the Healthy Design of Urban Green Spaces of the Future.Int J Environ Res Public Health. 2019 Apr 15;16(8):1357. doi: 10.3390/ijerph16081357. Int J Environ Res Public Health. 2019. PMID: 30991765 Free PMC article.
-
Temporal variation of allergenic potential in urban parks during the vegetation period: a case study from Bratislava, Slovakia.Environ Sci Pollut Res Int. 2024 Jan;31(2):2026-2041. doi: 10.1007/s11356-023-31137-9. Epub 2023 Dec 5. Environ Sci Pollut Res Int. 2024. PMID: 38052730 Free PMC article.
-
The urban jungle and allergy.Immunol Allergy Clin North Am. 2003 Aug;23(3):371-87. doi: 10.1016/s0889-8561(03)00006-7. Immunol Allergy Clin North Am. 2003. PMID: 14524381 Review.
-
Resilience and restoration of tropical and subtropical grasslands, savannas, and grassy woodlands.Biol Rev Camb Philos Soc. 2019 Apr;94(2):590-609. doi: 10.1111/brv.12470. Epub 2018 Sep 24. Biol Rev Camb Philos Soc. 2019. PMID: 30251329 Review.
Cited by
-
Immunologic, genetic, and ecological interplay of factors involved in allergic diseases.Front Allergy. 2023 Aug 3;4:1215616. doi: 10.3389/falgy.2023.1215616. eCollection 2023. Front Allergy. 2023. PMID: 37601647 Free PMC article. Review.
-
Environmental degradation and the increasing burden of allergic disease: The need to determine the impact of nitrogen pollution.Front Allergy. 2023 Feb 2;4:1063982. doi: 10.3389/falgy.2023.1063982. eCollection 2023. Front Allergy. 2023. PMID: 36819832 Free PMC article. No abstract available.
-
Early-life exposure to residential greenness and risk of asthma in a U.S. bronchiolitis cohort.Allergy. 2024 Nov;79(11):3036-3046. doi: 10.1111/all.16359. Epub 2024 Oct 21. Allergy. 2024. PMID: 39429165
References
-
- Aerts R, Bruffaerts N, Somers B, Demoury C, Plusquin M, Nawrot TS, Hendrickx M. Tree pollen allergy risks and changes across scenarios in urban green spaces in Brussels, Belgium. Landscape and Urban Planning. 2021;207:104001. doi: 10.1016/j.landurbplan.2020.104001. - DOI
-
- Bartoń K. MuMIn: Multi-model inference. R Package. Version. 2020;1:17.
-
- Bergmann K-C, Zuberbier T, Augustin J, Mücke H-G, Straff W. Climate change and pollen allergy: Cities and municipalities should take people suffering from pollen allergy into account when planting in public spaces. Allergo Journal International. 2012;21:103–107. doi: 10.1007/s15007-012-0045-4. - DOI
MeSH terms
Substances
Grants and funding
LinkOut - more resources
Full Text Sources
Medical
