. 2022 Jul 5;328(1):74-76.
doi: 10.1001/jama.2022.8045.

Excess Mortality in Massachusetts During the Delta and Omicron Waves of COVID-19

Affiliations

Excess Mortality in Massachusetts During the Delta and Omicron Waves of COVID-19

Jeremy Samuel Faust et al. JAMA. .

Abstract

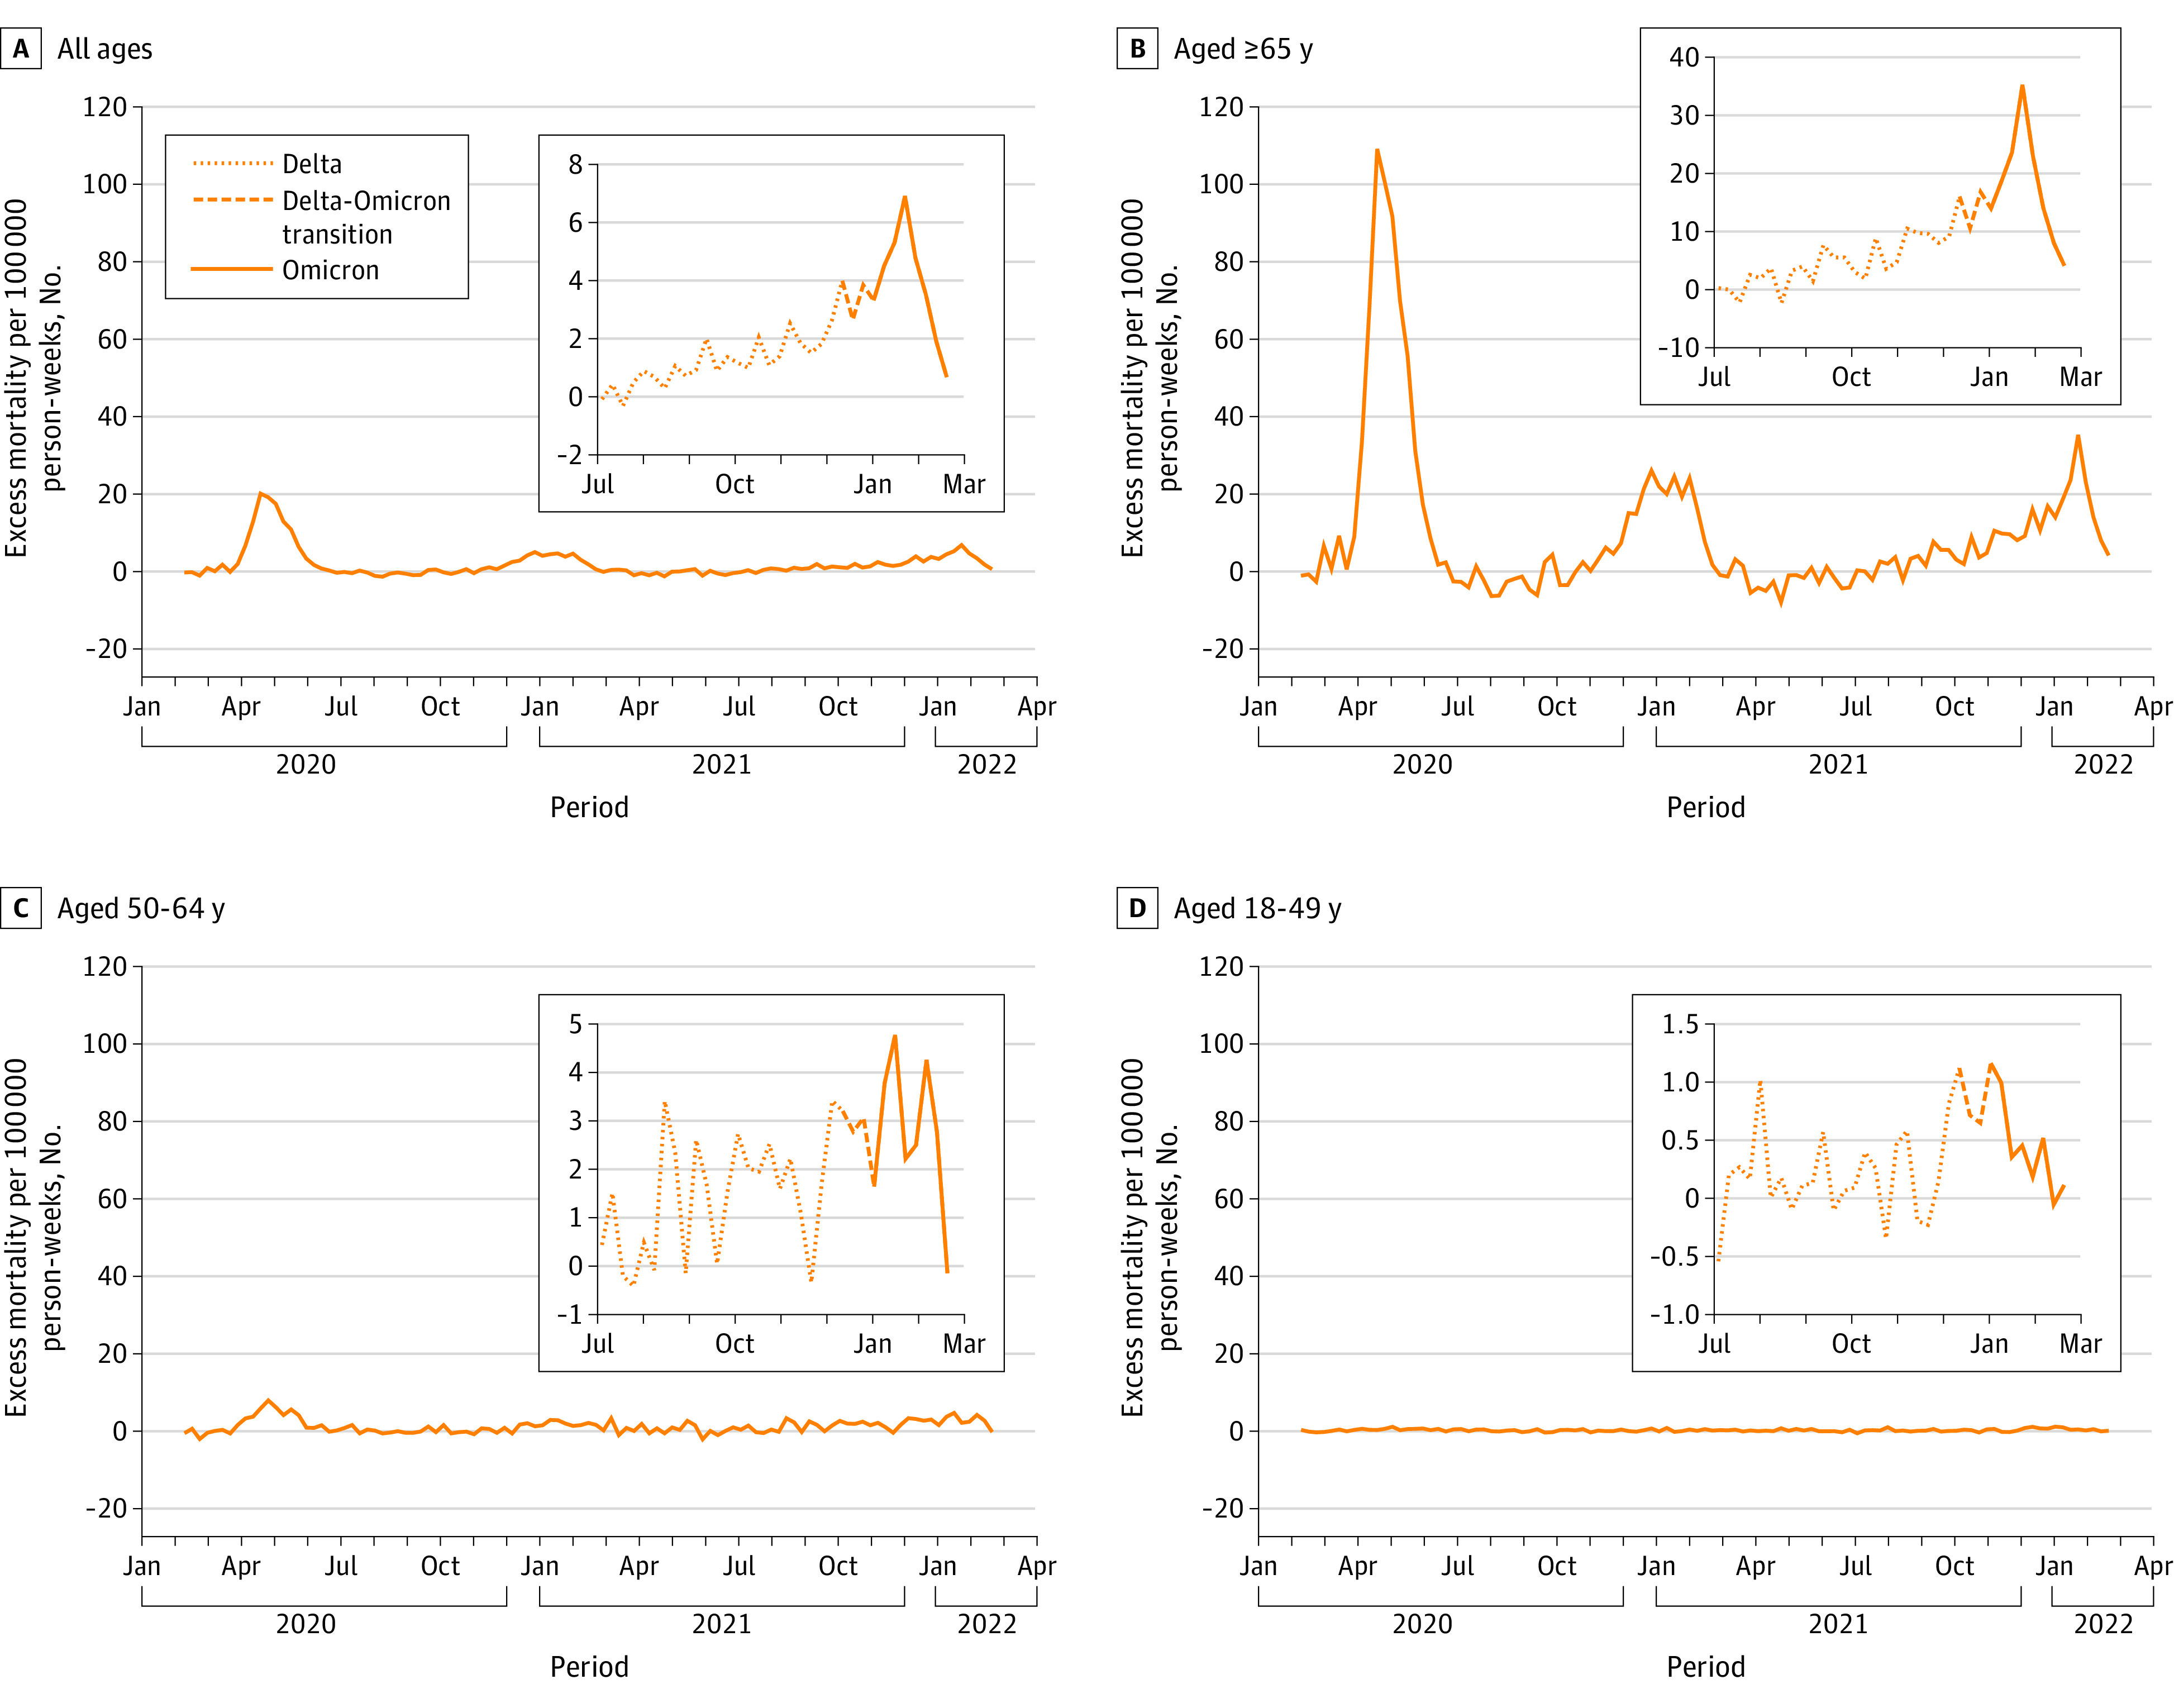
This modeling study estimates the excess deaths attributable to COVID-19 disease in Massachusetts during the Delta (June to December 2021) and Omicron (December 2021 to February 2022) waves.


Conflict of interest statement

Conflict of Interest Disclosures: Dr Krumholz reported receiving consulting fees from UnitedHealth, Element Science, Aetna, Reality Labs, F-Prime, and Tesseract/4Catalyst; serving as an expert witness for Martin/Baughman law firm, Arnold and Porter law firm, and Siegfried and Jensen law firm; being a cofounder of Hugo Health, a personal health information platform; being a cofounder of Refactor Health, an enterprise health care, artificial intelligence–augmented data management company; receiving contracts from the Centers for Medicare & Medicaid Services through Yale New Haven Hospital to develop and maintain performance measures that are publicly reported; and receiving grants from Johnson & Johnson outside the submitted work. No other disclosures were reported.

Figures

Figure.
Figure.. Weekly All-Cause Excess Deaths in Massachusetts per 100 000 Person-Weeks From February 9, 2020, Through February 20, 2022
Insets for each age group are enlargements of the Delta period (dotted lines), Delta-Omicron transition period (dashed lines), and Omicron period (solid lines). Baseline (0 excess deaths) was determined with seasonal autoregressive integrated moving average.

Comment in

References

    1. Bilinski A, Emanuel EJ. COVID-19 and excess all-cause mortality in the US and 18 comparison countries. JAMA. 2020;324(20):2100-2102. doi:10.1001/jama.2020.20717 - DOI - PMC - PubMed
    1. Woolf SH, Chapman DA, Sabo RT, Zimmerman EB. Excess deaths from COVID-19 and other causes in the US, March 1, 2020, to January 2, 2021. JAMA. 2021;325(17):1786-1789. doi:10.1001/jama.2021.5199 - DOI - PMC - PubMed
    1. Bhattacharyya RP, Hanage WP. Challenges in inferring intrinsic severity of the SARS-CoV-2 Omicron variant. N Engl J Med. 2022;386(7):e14. doi:10.1056/NEJMp2119682 - DOI - PubMed
    1. Broad Institute . Broad COVID dashboard. Accessed April 4, 2022. https://covid-19-sequencing.broadinstitute.org
    1. Rossen LM, Ahmad FB, Anderson RN, et al. . Disparities in excess mortality associated with COVID-19—United States, 2020. MMWR Morb Mortal Wkly Rep. 2021;70(33):1114-1119. doi:10.15585/mmwr.mm7033a2 - DOI - PMC - PubMed

Supplementary concepts