. 2022 Jun 17;479(11):1237-1256.
doi: 10.1042/BCJ20220153.

Trafficking regulator of GLUT4-1 (TRARG1) is a GSK3 substrate

Affiliations

Trafficking regulator of GLUT4-1 (TRARG1) is a GSK3 substrate

Xiaowen Duan et al. Biochem J. .

Abstract

Trafficking regulator of GLUT4-1, TRARG1, positively regulates insulin-stimulated GLUT4 trafficking and insulin sensitivity. However, the mechanism(s) by which this occurs remain(s) unclear. Using biochemical and mass spectrometry analyses we found that TRARG1 is dephosphorylated in response to insulin in a PI3K/Akt-dependent manner and is a novel substrate for GSK3. Priming phosphorylation of murine TRARG1 at serine 84 allows for GSK3-directed phosphorylation at serines 72, 76 and 80. A similar pattern of phosphorylation was observed in human TRARG1, suggesting that our findings are translatable to human TRARG1. Pharmacological inhibition of GSK3 increased cell surface GLUT4 in cells stimulated with a submaximal insulin dose, and this was impaired following Trarg1 knockdown, suggesting that TRARG1 acts as a GSK3-mediated regulator in GLUT4 trafficking. These data place TRARG1 within the insulin signaling network and provide insights into how GSK3 regulates GLUT4 trafficking in adipocytes.

Keywords: adipocytes; glucose transport; glycogen synthase kinase; insulin signalling; trafficking regulator of GLUT4-1.


Conflict of interest statement

The authors declare that there are no competing interests associated with the manuscript.

Figures

Figure 1.
Figure 1.. TRARG1 phosphorylation causes apparent higher molecular weight bands by immunoblotting.
(A) Subcellular fractionation of 3T3-L1 adipocytes. A longer exposure time for the TRARG1 blot is presented to better visualize higher molecular weight bands (TRARG1 (long)). Apparent higher molecular weight TRARG1 bands are enriched in PM fractions (WCL; whole cell lysate, PM; plasma membrane, LDM; low density microsomes, HDM; high densty microsomes). (B) HA-tagged murine TRARG1 (HA-TRARG1) expressed in HEK-293E cells shows multiple bands by immunoblotting (HA-T1; N-terminally tagged HA-TRARG1, EV; empty vector control). (C) Schematic of the domains in TRARG1 and post-translational modifications detected by mass spectrometry of HA-TRARG1 (murine) overexpressed in HEK-293E cells. (D) Table of TRARG1 Ser/Thr/Tyr, Lys and Cys mutants used to study TRARG1 post-translocation modifications (PTMs) in Figure 1. Murine TRARG1 residue positions are indicated. (E) HA-TRARG1 phosphomutants with Ser/Thr mutated to Ala or Glu (7A/7E) expressed in HEK-293E cells exhibited a molecular weight similar to the apparent lower or higher molecular weight of HA-TRARG1, respectively. Lys-Arg (K-R) and Cys-Ser mutation had no effect on TRARG1 band patterning. Dashed line indicates where lanes have been excluded. (F) Immunoblotting analysis of TRARG1 phosphomutants (12A, 11E) expressed in 3T3-L1 adipocytes. (G) In vitro Lambda protein phosphatase (LPP) treatment of 3T3-L1 adipocytes lysates removed apparent higher molecular weight TRARG1 bands. (H) Apparent higher molecular weight TRARG1 bands were removed by LPP treatment in TRARG1 expressed in HEK-293E cells. (I) Apparent higher molecular weight TRARG1 bands were present in white adipose tissue (epididymal white adipose tissue; EWAT, subcutaneous white adipose tissue; SWAT) lysates, but not brown adipose tissue (BAT) lysates as analyzed by immunoblotting. The apparent higher molecular weight TRARG1 bands were removed by LPP treatment. (J) Apparent higher molecular weight TRARG1 bands were increased in intensity in 3T3-L1 adipocytes treated with phosphatase inhibitors, calyculin A (CalyA) or okadaic acid (Oka). (K) Quantification of (J). The ratio of apparent higher molecular weight (HWM) TRARG1 (as indicated by the bands in the pink box in (J)) signal to total TRARG1 (as indicated by the bands in the blue box in (J)) signal was quantified as a metric of TRARG1 phosphorylation (n = 3, mean ± SEM, * P < 0.05; *** P < 0.001, comparisons with cells under DMSO condition). For panels A, B, D, E, F, G, H and I, the migration positions of molecular mass markers (kilodaltons) are shown to the right. Higher molecular weight (HMW) TRARG1 bands indicated by arrow.
Figure 2.
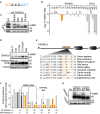
Figure 2.. TRARG1 is dephosphorylated with insulin in a PI3K/AKT-dependent manner.
(A) 3T3-L1 adipocytes were serum-starved prior to insulin (INS) stimulation (100 nM, 20 min). Where indicated, a PI3K inhibitor (wortmannin (WM), 100 nM), Akt inhibitor (MK-2206 (MK), 10 µM), mTOR inhibitor (rapamycin (rapa), 100 nM), or MAPK inhibitor (GDC-0994 (GDC), 1 µM) was administered 20 min prior to insulin treatment. Samples were analyzed by immunoblotting. A longer exposure time for the TRARG1 blot is presented to better visualize higher molecular weight bands (TRARG1 (long)). (B) Quantification of (A). The ratio of apparent higher molecular weight (HMW) TRARG1 (as indicated by the arrow and pink box in (A)) signal to total TRARG1 (as indicated by the blue box in (A)) signal was quantified as a metric of TRARG1 phosphorylation (n = 3, mean ± SEM, * P < 0.05; ** P < 0.01; ns, non-significant, comparisons with cells without insulin or drug treatment). (C) Bar plot indicating the log2-transformed median fold change (FC) in phosphorylation of insulin versus basal or insulin + MK versus insulin alone at Class I TRARG1 phosphosites reported by Humphrey et al. [24]. SILAC-labeled adipocytes were serum-starved prior to insulin stimulation (100 nM, 20 min). The Akt inhibitor, MK-2206 (10 µM), was administered 30 min prior to insulin treatment where indicated. Only sites down-regulated (log2 FC −0.58) following insulin stimulation are shown. Dashed lines indicate where log2 FC = 0.58 or −0.58. For panel A, the migration positions of molecular mass markers (kilodaltons) are shown to the right. Higher molecular weight (HMW) TRARG1 bands indicated by arrow.
Figure 3.
Figure 3.. TRARG1 is a GSK3 substrate.
(A) 3T3-L1 adipocytes were serum-starved, followed by treatment with insulin (INS; 100 nM) or insulin (100 nM) and isoproterenol (Iso; 1 nM) for 20 min. Samples were analyzed by immunoblotting (Hormone sensitive lipase; HSL). Dashed lines indicate where the image was cut to remove lanes. (B) Quantification of (A). The ratio of apparent higher molecular weight TRARG1 signal to total TRARG1 signal was quantified (n = 2, mean ± S.D., n.s = non-significant comparisons with basal condition). (C) 3T3-L1 adipocytes were serum-starved (except for the FBS lane), followed by treatment with insulin (100 nM), CHIR99021 (CHIR) (left panel) or LY2090314 (LY) (right panel) at indicated doses for 20 min. Samples were analyzed by immunoblotting (Glycogen synthase; GS). (D) Quantification of (C). The ratio of apparent higher molecular weight TRARG1 signal to total TRARG1 signal was quantified (n = 3, mean ± SEM., * P < 0.05; ** P < 0.01; comparisons with basal condition). (E) Epididymal white adipose tissue (EWAT) was excised from mice and minced. Explants were serum-starved in DMEM/2% BSA/20 mM HEPES, pH 7.4 for 2 h followed by treatment with insulin (10 nM) or LY2090314 (GSK3i) (500 nM) for 30 min at 37°C. Treatment was terminated and tissues were solubilized in RIPA buffer and subjected to analysis by immunoblotting. (F) Quantification of (E). The ratio of apparent higher molecular weight (HMW) TRARG1 signal to total TRARG1 signal was quantified (n = 4, mean ± SEM, * P < 0.05; ** P < 0.01; *** P < 0.001, comparisons with basal condition). (G) 3T3-L1 adipocytes on day 6 post-differentiation were transfected with esiRNA targeting GSK3α and/or β. Cells transfected with esiRNA targeting luciferase (Luc) were used as control. Seventy-two hours post-transfection, cells were serum-starved for 2 h and harvested for analysis by immunoblotting. (H and I) Quantification of (G). TRARG1 phosphorylation (HMW/total) (H), glycogen synthase (GS) phosphorylation, GSK3α and GSK3β (I) were quantified (n = 3, mean ± SEM, * P < 0.05; ** P < 0.01, comparisons with cells transfected with esiRNA targeting luciferase). (J) 3T3-L1 adipocytes were serum-starved in basal DMEM media containing 100 nM LY2090314 for 2 h. Cells were lysed and homogenized and cell lysates were immunoprecipitated with anti-TRARG1 antibody or IgG as a control. Immunoprecipitated TRARG1 was treated with GSK3α, β or reaction buffer alone. All samples were analyzed by immunoblotting. For panels A, C, E, G, and J, the migration positions of molecular mass markers (kilodaltons) are shown to the right. Higher molecular weight (HMW) TRARG1 bands indicated by arrow.
Figure 4.
Figure 4.. Murine TRARG1 is primed at S84 for subsequent phosphorylation by GSK3 within a highly conserved region.
(A) GSK3 substrate consensus motif. Pre-phosphorylated (primed) site is labeled in blue and GSK3 target site is labeled in orange. (B) 3T3-L1 adipocytes were serum-starved followed by treatment with GSK3 inhibitor LY2090314 (100 nM, 20 min) or DMSO as a control. Cell lysates were subjected to phosphoproteomic analysis. Bar plot of log2-transformed mean FC of all detected TRARG1 sites and S641, S645 and S649 on glycogen synthase from this analysis is shown. Numbers following underscore indicate the number of phosphorylation sites detected on that peptide (significance is indicated by *adj. P < 0.05; **adj. P < 0.01; ***adj. P < 0.001, t-test). (C) Murine HA-TRARG1 phosphomutants generated by mutating T88, T89 and S90 to Ala (88–90A), S85 to Ala (85A), S84 to Ala (84A) or S79 and S80 to Ala (79–80A), or wild-type HA-TRARG1 were transfected into HEK-293E cells. Cells were lysed 24 h post-transfection and samples were analyzed by immunoblotting. (D) Mouse HA-TRARG1 phosphomutants generated by mutating S72 to Ala (72A), S72 and S76 to Ala (72,76A), S72, S76 and S80 to Ala (72,76,80A) or S84 to Ala (84A), or wild-type HA-TRARG1 were transfected in HEK-293E cells. Cells were lysed 24 h post-transfection and samples were analyzed by immunoblotting. A longer exposure time for the TRARG1 blot is presented to better visualize higher molecular weight bands (TRARG1 (long)). (E) The phosphosite-rich region between residue 69 and 91 on murine TRARG1 is highly conserved across vertebrate species. Insulin/GSK3 regulated sites are labeled in blue. Other conserved Ser/Thr residues within this region are labeled in orange. (F) Polymorphism of TRARG1 residues in 64 placental mammals. Ser/Thr residues conserved across murine and human TRARG1 are colored in orange; Bars colored in dark grey indicate Ser/Thr residues present in murine but not human TRARG1 sequence. Equivalent residue numbers for mouse (Mus musculus, Mm) and human (Homo sapiens, Hs) TRARG1 are shown below the bars. A full list of species included in the analysis is provided in Supplemental Table S2. (G) Wild-type murine TRARG1, murine TRARG1 with S84 mutated to Ala (84A), wild-type human TRARG1, human TRARG1 with S87 (equivalent to S84 in murine TRARG1) mutated to Ala (87A) were expressed in HEK-293E cells. Cells were lysed 24 h post-transfection and samples were analyzed by immunoblotting. For panels C, D and G, the migration positions of molecular mass markers (kilodaltons) are shown to the right. Higher molecular weight (HMW) TRARG1 bands indicated by arrow.
Figure 5.
Figure 5.. GSK3 signaling to TRARG1 does not alter TRARG1 localization but may regulate GLUT4 translocation.
(A) 3T3-L1 adipocytes stably expressing HA-TRARG1, HA-TRARG1-7A or HA-TRARG1-7E were serum-starved for 2 h. Cells were fixed and stained for nuclei (DAPI, blue), GLUT4 (red) and HA (green). Immunofluorescence imaging was performed by confocal microscopy. Instances of colocalization between GLUT4 and HA-TRARG1, HA-TRARG1-7A or HA-TRARG1-7E are indicated by closed arrowheads. Scale bar, 20 µm. (B) Immunoblotting analysis of wild-type TRARG1 (T1) or TRARG1 truncation mutants expressed in HEK-293E cells. del_101–127 and del_129–173 mutants were phosphorylated as indicated by the apparent higher molecular weight bands; del_101–173 mutant was not phosphorylated as indicated by the lack of apparent higher molecular weight band. (C) N-terminally HA-tagged and C-terminally eGFP fused TRARG1 construct (HA-TRARG1-eGFP) and its truncation mutants were expressed in HEK-293E cells. Subcellular localization of these constructs was determined by confocal microscopy. Full-length TRARG1 and del_101–127 mutant were localized to the PM; del_129–173 mutant was localized to intracellular membranes; del_101–173 mutant was cytosolic. (D) Serum-starved or insulin-stimulated 3T3-L1 adipocytes were subjected to subcellular fractionation. Subcellular localization of GSK3 was determined by immunoblotting analysis. Tubulin and caveolin1 were immunoblotted to control for loading of cytosolic and PM proteins, respectively. (E) Knockdown efficiency of Trarg1 as assessed by qPCR (****P < 0.0001, comparison with non-targeting control siRNA). (F) 3T3-L1 adipocytes were serum-starved in the absence (DMSO) or presence of GSK3 inhibitors (10 µM CHIR99021; CHIR or 500 nM LY2090314; LY) before treatment with or without 0.5 nM or 100 nM insulin for 20 min. Surface GLUT4 was quantified by immuno-labeling and expressed relative to cell number as measured by nuclei number (n = 5, mean ± SEM, # P < 0.05, ## P < 0.01, ### P < 0.001, #### P < 0.0001, compared with the DMSO condition with the same insulin treatment and gene knockdown; P < 0.05, ‡‡‡‡ P < 0.0001, compared with the non-targeting (NT) knockdown with the same insulin and drug treatment). (G) Differences in PM GLUT4 between CHIR- or LY-treated and DMSO control condition with the same insulin treatment and gene knockdown as shown in (F) were calculated (mean ± SEM, * P < 0.05, compared with NT knockdown with the same insulin and drug treatment). For panel B and D, the migration positions of molecular mass markers (kilodaltons) are shown to the right. Higher molecular weight (HMW) TRARG1 bands indicated by arrow.

References

    1. Stockli, J., Fazakerley, D.J. and James, D.E. (2011) GLUT4 exocytosis. J. Cell Sci. 124, 4147–4159 10.1242/jcs.097063 - DOI - PMC - PubMed
    1. Jedrychowski, M.P., Gartner, C.A., Gygi, S.P., Zhou, L., Herz, J., Kandror, K.V.et al. (2010) Proteomic analysis of GLUT4 storage vesicles reveals LRP1 to be an important vesicle component and target of insulin signaling. J. Biol. Chem. 285, 104–114 10.1074/jbc.M109.040428 - DOI - PMC - PubMed
    1. Hashiramoto, M. and James, D.E. (2000) Characterization of insulin-responsive GLUT4 storage vesicles isolated from 3T3-L1 adipocytes. Mol. Cell. Biol. 20, 416–427 10.1128/MCB.20.1.416-427.2000 - DOI - PMC - PubMed
    1. Larance, M., Ramm, G., Stockli, J., van Dam, E.M., Winata, S., Wasinger, V.et al. (2005) Characterization of the role of the Rab GTPase-activating protein AS160 in insulin-regulated GLUT4 trafficking. J. Biol. Chem. 280, 37803–37813 10.1074/jbc.M503897200 - DOI - PubMed
    1. Fazakerley, D.J., Naghiloo, S., Chaudhuri, R., Koumanov, F., Burchfield, J.G., Thomas, K.C.et al. (2015) Proteomic analysis of GLUT4 storage vesicles reveals tumor suppressor candidate 5 (TUSC5) as a novel regulator of insulin action in adipocytes. J. Biol. Chem. 290, 23528–23542 10.1074/jbc.M115.657361 - DOI - PMC - PubMed

Publication types

MeSH terms