. 2022 Aug 1;33(9):ar77.
doi: 10.1091/mbc.E22-02-0054. Epub 2022 May 20.

Nucleotide- and Protein-Dependent Functions of Actg1

Affiliations

Nucleotide- and Protein-Dependent Functions of Actg1

Lauren J Sundby et al. Mol Biol Cell. .

Abstract

Cytoplasmic β- and γ-actin proteins are 99% identical but support unique organismal functions. The cytoplasmic actin nucleotide sequences Actb and Actg1, respectively, are more divergent but still 89% similar. Actb-/- mice are embryonic lethal and Actb-/- cells fail to proliferate, but editing the Actb gene to express γ-actin (Actbc-g) resulted in none of the overt phenotypes of the knockout revealing protein-independent functions for Actb. To determine if Actg1 has a protein-independent function, we crossed Actbc-g and Actg1-/- mice to generate the bG/0 line, where the only cytoplasmic actin expressed is γ-actin from Actbc-g. The bG/0 mice were viable but showed a survival defect despite expressing γ-actin protein at levels no different from bG/gG with normal survival. A unique myopathy phenotype was also observed in bG/0 mice. We conclude that impaired survival and myopathy in bG/0 mice are due to loss of Actg1 nucleotide-dependent function(s). On the other hand, the bG/0 genotype rescued functions impaired by Actg1-/-, including cell proliferation and auditory function, suggesting a role for γ-actin protein in both fibroblasts and hearing. Together, these results identify nucleotide-dependent functions for Actg1 while implicating γ-actin protein in more cell-/tissue-specific functions.


Figures
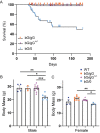
FIGURE 1:
FIGURE 1:
bG/0 mice are viable but are smaller and show increased post-birth mortality. (A) Kaplan-Meier survival curve of bG/gG, bG/gG+/–, and bG/0 mice from P0 to P180 (n ≥ 34 for each genotype). Tick marks indicate when animals were removed from the survival study before 180 d for other analyses performed in this study or animals that survived beyond the 180 d endpoint. (B, C) Body mass for male and female mice, respectively (n ≥ 3 at 3 mo). One-way ANOVA with Bonferroni posttest was performed. *p < 0.05, **p < 0.01, ***p < 0.001. Error bars are SEM. Comparisons are not statistically significant unless indicated otherwise.
FIGURE 2:
FIGURE 2:
The Actbc–g transcript is upregulated with ablation of Actg1. (A-C) Absolute and (D-F) proportional quantification of isoactin and Actbc–g transcript in brain, lung, and MEFs of WT, bG/gG, bG/gG+/–, and bG/0 mice and embryos (n = 4, in triplicate). Transcript amounts (picomoles) were calculated using a standard curve, amplified in parallel. For A-C, two-way ANOVA with Bonferroni posttest was performed. *p < 0.05, **p < 0.01, ***p < 0.001, ****p < 0.0001. Error bars are SEM. Comparisons are not statistically significant unless otherwise indicated.
FIGURE 3:
FIGURE 3:
Mice expressing γ-actin from Actbc–g maintain WT levels of total actin protein. (A-C) Relative actin isoform protein expression in WT, bG/gG, bG/gG+/–, and bG/0 brain, lungs, and MEFs (n = 4). x-axis denotes actin isoform and y-axis denotes relative protein expression normalized to GAPDH and relative to WT. (D-F) Representative Western blots of brain, lung, and MEFs. Two-way ANOVA with Bonferroni posttest was performed. *p < 0.05, **p < 0.01, ***p < 0.001, ****p < 0.0001. Error bars are SEM. Comparisons are not statistically significant unless otherwise indicated.
FIGURE 4:
FIGURE 4:
No growth or morphology phenotypes in bG/0 MEFs. (A) Representative images of WT, bG/gG, and bG/0 MEFs. γ-actin is labeled in magenta, β-actin is labeled in green, and nucleus is labeled in blue. Scale bar: 50 µm. (B) Representative images of phalloidin-stained actin filaments in WT, bG/gG, and bG/0 MEFs. Scale bar: 20 µm. (C) MEF growth curve of WT, bG/gG, bG/gG+/–, and bG/0 embryos cultured for 6 d (n = 4). (D) Quantification of peak:valley ratios across linescans as a measure of stress fiber thickness and (E) relative number of fibers per cell (N = 3, n = 6). Each color represents an independent experiment. (F) Representative linescans of WT, bG/gG, and bG/0 MEFs. (G) Ratio of G- to F-actin for β-, γ-, αsm-, and total actin in WT, bG/gG, and bG/0 MEFs (n = 3). (H) Relative expression of actin-associated proteins SRF, MRTF-A, and YAP normalized to GAPDH in WT, bG/gG, bG/gG+/–, and bG/0 MEFs (n = 4). One- or two-way ANOVA with Bonferroni posttest was performed. For D and E, statistical analysis was performed on the means of independent experiments. Error bars are SEM. *p < 0.05, **p < 0.01, ***p < 0.001, ****p < 0.0001. Comparisons are not statistically significant unless otherwise indicated.
FIGURE 5:
FIGURE 5:
Normal cell motility in bG/0 MEFs. (A-C) Individual cell trajectories mapped from the origin for WT, bG/gG, and bG/0 MEFs for each genotype to characterize random migration patterns. Each different colored line indicates an individual cell path. (D) Directionality, (E) directional autocorrelation, (F) mean square displacement, and (G) speed; N = 4, n = 10 cells per embryo. For G, each color represents an independent experiment. For D-F, two-way ANOVA with repeated measures and Bonferroni posttest was performed. For G, one-way ANOVA with Bonferroni posttest was performed; statistical analysis was performed on the means of independent experiments. Error bars are SEM. Comparisons are not statistically significant unless otherwise indicated.
FIGURE 6:
FIGURE 6:
bG/0 mice exhibit skeletal muscle weakness in the absence of other myopathy phenotypes. (A) Percentage of fibers containing centrally nucleated fibers (CNF) of quadriceps muscle (n ≥ 3). (B) Eccentric force loss (ECC) as a percentage of initial force in extensor digitorum longus (EDL) muscle and (C) specific isometric force in EDL muscle (N ≥ 4, n = 2 muscles per mouse). (D) Relative expression of β-, γ-, and total actin of Dnase-enriched gastrocnemius muscle with representative Western blots of each, normalized to Pan-actin (n = 4). All experiments performed on WT, bG/gG, bG/gG+/–, and bG/0 mice. One- or two-way ANOVA with Bonferroni posttest was performed. *p < 0.05, **p < 0.01, ***p < 0.001, ****p < 0.0001. Error bars are SEM. Comparisons are not statistically significant unless otherwise indicated.
FIGURE 7:
FIGURE 7:
bG/0 mice have progressive hearing loss. (A, B) SEM images and (C, D) ABR of 6 wk- and 16 wk-old WT, bG/gG, and bG/0 mice (n ≥ 3). SEM images of cochlea middle turn OHC. Scale bar: 1 µm. ABR defined frequency in kilohertz is on the x-axis and threshold (in decibels) sound that elicits a response is on the y-axis. One-way ANOVA with Bonferroni posttest was performed. *P < 0.05, **P < 0.01, ***P < 0.001. Error bars are SD. For significance in D, Top symbols: bG/0 compared with WT; Bottom symbols: bG/gG compared with WT. Comparisons are not statistically significant unless indicated otherwise.

References

    1. Artman L, Dormoy-Raclet V, von Roretz C, Gallouzi IE (2014). Planning your every move: the role of β-actin and its post-transcriptional regulation in cell motility. Sem Cell Dev Biol, 34, 33–43. - PubMed
    1. Baarlink C, Wang H, Grosse R (2013). Nuclear actin network assembly by formins regulates the SRF coactivator MAL. Science, 340, 864–867. - PubMed
    1. Belyantseva IA, Perrin BJ, Sonnemann KJ, Zhu M, Stepanyan R, McGee J, Frolenkov G, Walsh E, Friderici K, Friedman T, Ervasti JM (2009). γ-Actin is required for cytoskeletal maintenance but not development. Proc Natl Acad Sci USA, 106, 9703–9708. - PMC - PubMed
    1. Bunnell TM, Burbach BJ, Shimizu Y, Ervasti JM (2011). β-Actin specifically controls cell growth, migration, and the G-actin pool. Mol Biol Cell, 22, 4047–4058. - PMC - PubMed
    1. Bunnell TM, Ervasti JM (2010). Delayed embryonic development and impaired cell growth and survival in Actg1 null mice. Cytoskeleton, 67, 564–572. - PMC - PubMed

Publication types

LinkOut - more resources