Review
. 2022 Jul 13;122(13):11287-11368.
doi: 10.1021/acs.chemrev.1c00965. Epub 2022 May 20.

Methodology-Centered Review of Molecular Modeling, Simulation, and Prediction of SARS-CoV-2

Affiliations
Review

Methodology-Centered Review of Molecular Modeling, Simulation, and Prediction of SARS-CoV-2

Kaifu Gao et al. Chem Rev. .

Abstract

Despite tremendous efforts in the past two years, our understanding of severe acute respiratory syndrome coronavirus 2 (SARS-CoV-2), virus-host interactions, immune response, virulence, transmission, and evolution is still very limited. This limitation calls for further in-depth investigation. Computational studies have become an indispensable component in combating coronavirus disease 2019 (COVID-19) due to their low cost, their efficiency, and the fact that they are free from safety and ethical constraints. Additionally, the mechanism that governs the global evolution and transmission of SARS-CoV-2 cannot be revealed from individual experiments and was discovered by integrating genotyping of massive viral sequences, biophysical modeling of protein-protein interactions, deep mutational data, deep learning, and advanced mathematics. There exists a tsunami of literature on the molecular modeling, simulations, and predictions of SARS-CoV-2 and related developments of drugs, vaccines, antibodies, and diagnostics. To provide readers with a quick update about this literature, we present a comprehensive and systematic methodology-centered review. Aspects such as molecular biophysics, bioinformatics, cheminformatics, machine learning, and mathematics are discussed. This review will be beneficial to researchers who are looking for ways to contribute to SARS-CoV-2 studies and those who are interested in the status of the field.


Conflict of interest statement

The authors declare no competing financial interest.

Figures

Figure 1
Figure 1
Genomics organization and proteins of SARS-CoV-2. Adapted with permission from ref (13). Copyright 2021 John Wiley and Sons.
Figure 2
Figure 2
Six stages of the SARS-CoV-2 life cycle. Stage I: Virus entry. I(a): Virus can enter the host cell via plasma membrane fusion. I(b): Virus can enter the host cell via endosomes. Stage II: Translation of viral replication. Stage III: Replication. Here, nsp12 (RdRp) and nsp13 (helicase) cooperate to perform the replication of the viral genome. Stage IV: Translation of viral structure proteins. Stage V: Virion assembly. Stage VI: Release of a virus.
Figure 3
Figure 3
(a) Illustration of the PB model, in which the molecular surface separates the computational domain into the solute region Ω1 and solvent region Ω2. (b) Electrostatic potential of the SARS-CoV-2 Mpro based on the PB model.
Figure 4
Figure 4
(a) Workflow of molecular dynamics simulations. (b) Workflow of the metropolis Monte Carlo method.
Figure 5
Figure 5
Illustration of the ENM on SARS-CoV-2 Mpro. Reproduced with permission from ref (189). Copyright 2021 Dubanevics and McLeish under Creative Commons Attribution 4.0 International License https://creativecommons.org/licenses/by/4.0/. (a) Mpro secondary structure. (b) Elastic model of Mpro. Cα atoms are in blue, and node-connecting springs are in black. (c) The first real vibrational mode eigenvectors are in yellow.
Figure 6
Figure 6
(a) Procedure of molecular docking simulation. (b) Procedure of quantum mechanics/molecular mechanics (QM/MM) calculation. Reproduced with permission from ref (212). Copyright 2017 Royal Society of Chemistry.
Figure 7
Figure 7
Illustration of the thermodynamic cycle of MM/PB(GB)SA calculations. ΔGcomplex is the total free energy of the complex, and ΔGprotein and ΔGligand are the total free energies of the protein and ligand in solvent, respectively. ΔGbind,sol and ΔGbind,vac are the total free energies in solvent and in vacuum, respectively.
Figure 8
Figure 8
Cα network analysis of three antibody–antigen complexes. Here, circle markers represent antigen (S protein RBD), and cube markers represent antibody or ACE2. The PDB IDs of the three antibody–antigen complexes are 3D0G, 6M0J, and 6W41. The rows represent (a) betweenness centrality, (b) eigencentrality, and (c) subgraph centrality. (d) Illustration of the S protein and ACE2 interaction. The RBD is displayed in green, the ACE2 is given in pink, and mutation D614G is highlighted in red. (e) Difference of FRI of the S protein between the network with wild type and the network with mutant type. (f) Difference of the subgraph centrality between the network with wild type and the network with mutant type.
Figure 9
Figure 9
Illustration of persistent homology filtration. Reused with permission from ref (688). Copyright 2020 Anand et al. under Creative Commons Attribution 4.0 International License https://creativecommons.org/licenses/by/4.0/. (a) Simplicial complex at radius 1.2 has 0-simplexes (black dots), 1-simplexes (red edges), 2-simplexes (yellow triangles), and 3-simplexes (purple tetrahedral). The barcode shows β0 and β1. (b) Persistent homology filtration at radius 0.6, 0.8, and 1.2. (c) 0-, 1-, 2-, and 3-simplex. (d) Topological invariants of three examples.
Figure 10
Figure 10
(a) Expression level of ACE2 in the lung plotted on top of the UMAP coordinates. Expression level of TMPRSS2 in the lung plotted on top of the UMAP coordinates. Expression level of FURIN in the lung plotted on top of the UMAP coordinates. Reproduced with permission from ref (724). Copyright 2020 Lukassen et al. (b and c) UMAP visualization of HBEC samples, colored by expression (normalized and square-root transformed counts) of the ACE2 receptor, CTSL, TMPRSS2, and TMPRSS4 proteases. Reproduced with permission from ref (725). Copyright 2021 Ravindra et al. Under Creative Commons Attribution 4.0 International License https://creativecommons.org/licenses/by/4.0/.
Figure 11
Figure 11
Flow chart of the k-NN algorithm. The features of the training set are {xi}i=1n with formula image
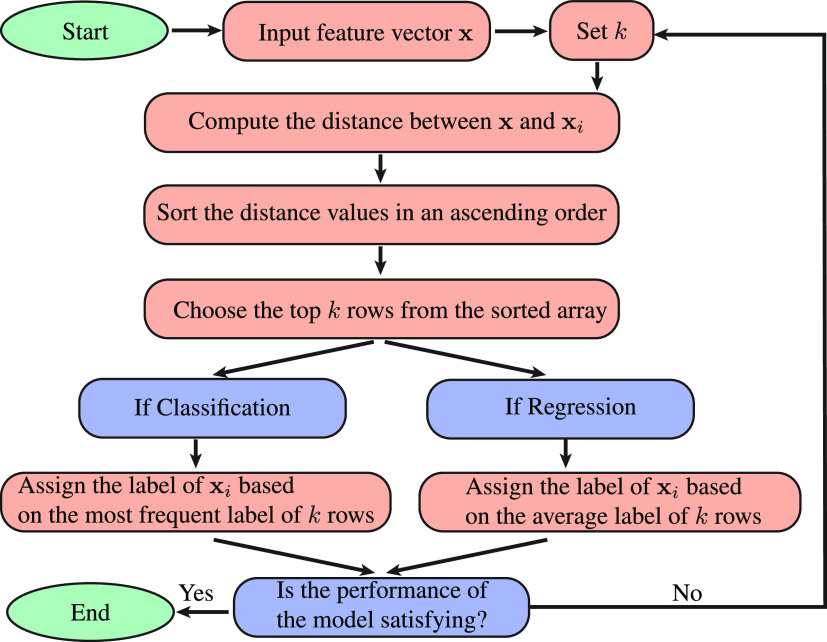
, k shows the number of nearest neighbors, and formula image is a feature representation of the training set.
Figure 12
Figure 12
Group 1 cluster analysis and PCA demonstrate two subgroups. Reproduced with permission from ref (740). Copyright 2021 Assis et al. under Creative Commons Attribution 4.0 International License https://creativecommons.org/licenses/by/4.0/. (a) Reactivity to the SARS-CoV-2 antigens. Samples were clustered using hierarchical clustering analysis. (b) Bar plot of the mean reactivity and the standard error of each cluster to each individual SARS-CoV-2 antigen. (c) Distribution of the samples that were clustered into three groups by PCA.
Figure 13
Figure 13
Structure of ComboNet. ComboNet consists of two networks: a DTI and a target–disease association network. Reused with permission from the authors. Copyright 2021 Jin at el. under Creative Commons Attribution 4.0 International License https://creativecommons.org/licenses/by/4.0/. (a) Workflow of ComnoNet for single-drug synergy. First, a single drug is fed into the DTI network to get its molecular representation zA. Then, such a molecular representation will be the input of the target–disease association network, and its output will be the predicted antiviral effect of a single drug. (b) Workflow of ComnoNet for drug combination synergy. First, drugs will be fed into the DTI network to get their molecular representations zA and zB. Then, the combination of such molecular representations zAB, as well as zA and zB, will be fed into the target–disease association network to get the predicted antiviral effect of a combination of drugs.
Figure 14
Figure 14
Structure of 2D CNN. The feature extraction process includes multiple convolutional layers and pooling layers. The convolutional layer extracts the local features of the initial input, and the average pooling layer increases the translational invariances of the network and reduces the parameters that need to be trained. The output of the last pooling layer is a 2D array. Next, the flattened layer reshapes a 2D array to a 1D array to feed the feature into a fully connected layer. Last, the integrated information will be fed into a regressor for the final prediction.
Figure 15
Figure 15
3D alignment of the available unique 3D structures of SARS-CoV-2 S protein RBD in binding complexes with 19 antibodies as well as ACE2. (a) ACE2 (6XDG), CT-P59 (7CM4), and CB6 (7C01). (b) C135 (7K8Z), C110 (7K8 V), REGN10933 (6XDG), and REGN10987 (6XDG). (c) C119 (7K8W), C144 (7K90), and C121 (7K8Y). (d) LY-CoV481 (7KMI), LY-CoV555 (7KMG), and LY-CoV488 (7KMH). (e) C002 (7K8T), C104 (7K8U), C105 (6XCM), and C102 (7K8M). (f) S309 (6WPS), AZD1061 (7L7E), and ACD8895 (7L7E).
Figure 16
Figure 16
(a) Workflow of a RNN cell. Here, t represents an object at time-step t. xt, yt, and at denote the input x, output y, and activation at time-step t, respectively. ŷt represents the prediction at time-step t. (b) Workflow of a LSTM cell. t represents an object at time-step t. xt, yt, at, and ct denote the input x, output y, activation, and cell state at time-step t, respectively. ŷt represents the prediction at time-step t. ft, ut, ot, ct, and t denote the forget gate state, update gate state, output gate state, cell state, and previous cell state at time-step t. σ is the activation function such as tanh function. (c) Workflow of a GRU cell. Here, t represents an object at time-step t. xt, yt, and at denote the input x, output y, and activation state at time-step t, respectively. ŷt represents the prediction at time-step t. rt, ot, and ut denote the reset gate state, output gate state, and update gate state at time-step t. (d) Illustration of the generative network complex. SMILES strings are encoded into latent vector space through a gated recurrent neural network (GRU)-based encoder.
Figure 17
Figure 17
Illustration of the drug repurposing. Reproduced with permission from ref (900). Copyright 2021 Belyaeva et al. under Creative Commons Attribution 4.0 International License https://creativecommons.org/licenses/by/4.0/. (a) Hypothesis of the relation between SARS-CoV-2 and aging of individuals. Ciliated cells are in blue, stromal/fibroblast cells are in orange, and SARS-CoV-2 viral cells are in red. (b) RNA-seq/GTEx, protein–protein interactions network, drug–target data, and CMap are integrated as a data set. (c and d) Pipeline of the drug discovery/repurposing platform. First is mining relevant drugs by using an autoencoder with blue and orange points in the latent space representing data from the drug screen and the SARS-CoV-2 infection studies. Second is identifying the disease interactome within the protein–protein interaction network by implementing Steiner tree analysis. Last is investigating the drug mechanism from the first step (green diamond).
Figure 18
Figure 18
Illustration of the discovery of PPI inhibitors for SARS-CoV-2. Reproduced with permission from ref (924). Copyright 2021 Elsevier.
Figure 19
Figure 19
AplhaFold2 architecture. Reproduced with permission from ref (799). Copyright 2021 Jumper et al. under Creative Commons Attribution 4.0 International License https://creativecommons.org/licenses/by/4.0/. Arrows show the information flow among the various components described in this paper. Array shapes are (s, r, c), where s shows the number of sequences (Nseq in the main text), r represents the number of residues (Nres in the main text), and c is the number of channels.
Figure 20
Figure 20
(a) Illustration of SARS-CoV-2 mutations given by Mutation Tracker. The interactive version is available at the Web site: https://users.math.msu.edu/users/weig/SARS-CoV-2_Mutation_Tracker.html. (b) Illustration of the analysis of SARS-CoV-2 mutations given by interactive Mutation Analyzer (https://weilab.math.msu.edu/MutationAnalyzer/). (c) Reproduction of Figure 3 of ref (78). The time evolution of 89 SARS-CoV-2 S protein RBD mutations. The green lines represent the mutations that strengthen the infectivity of SARS-CoV-2, and the red lines represent the mutations that weaken the infectivity of SARS-CoV-2. Many mutations overlap their trajectories. Here, the collection date of each genome sequence deposited in GISAID was applied according to the information recorded in June 2020. (d) Reproduction of Figure 2 of ref (79). Illustration of SARS-CoV-2 mutation-induced BFE changes for the complexes of S protein and ACE2. Here, the 100 most observed mutations out of 651 mutations on S protein RBD and their frequencies are illustrated as recorded in April 2021. The highest frequency was 168,801, while the lowest frequency was 28. Therefore, the frequencies of the rest of the 551 mutations were lower than 28. (e) Reproduction of the right chart of Figure 11 of ref (764). Illustration of SARS-CoV-2 RBD mutation-induced binding free energy changes for the complexes of S protein and antibody LY-CoV555. Here, mutations L452R, V483F/A, E484K/Q, F486L, F490L/S, Q493K/R, and S494P could potentially disrupt the binding of antibodies and S protein RBD.

Similar articles

Cited by

References

    1. Owen D. R.; Allerton C. M.; Anderson A. S.; Aschenbrenner L.; Avery M.; Berritt S.; Boras B.; Cardin R. D.; Carlo A.; Coffman K. J.; et al. An oral SARS-CoV-2 Mpro inhibitor clinical candidate for the treatment of COVID-19. Science 2021, 374, 1586–1593. 10.1126/science.abl4784. - DOI - PubMed
    1. Gao K.; Wang R.; Chen J.; Tepe J. J.; Huang F.; Wei G.-W. Perspectives on SARS-CoV-2 Main Protease Inhibitors. J. Med. Chem. 2021, 64, 16922–16955. 10.1021/acs.jmedchem.1c00409. - DOI - PMC - PubMed
    1. Shin M. D.; Shukla S.; Chung Y. H.; Beiss V.; Chan S. K.; Ortega-Rivera O. A.; Wirth D. M.; Chen A.; Sack M.; Pokorski J. K.; et al. COVID-19 vaccine development and a potential nanomaterial path forward. Nat. Nanotechnol. 2020, 15, 646–655. 10.1038/s41565-020-0737-y. - DOI - PubMed
    1. Day M. COVID-19: four fifths of cases are asymptomatic, China figures indicate. BMJ 2020, 369, m1375.10.1136/bmj.m1375. - DOI - PubMed
    1. Long Q.-X.; Tang X.-J.; Shi Q.-L.; Li Q.; Deng H.-J.; Yuan J.; Hu J.-L.; Xu W.; Zhang Y.; Lv F.-J.; et al. Clinical and immunological assessment of asymptomatic SARS-CoV-2 infections. Nat. Med. 2020, 26, 1200–1204. 10.1038/s41591-020-0965-6. - DOI - PubMed

Publication types