. 2022 Jun:80:104062.
doi: 10.1016/j.ebiom.2022.104062. Epub 2022 May 17.

Design, immunogenicity, and efficacy of a pan-sarbecovirus dendritic-cell targeting vaccine

Affiliations

Design, immunogenicity, and efficacy of a pan-sarbecovirus dendritic-cell targeting vaccine

Séverin Coléon et al. EBioMedicine. 2022 Jun.

Abstract

Background: There is an urgent need of a new generation of vaccine that are able to enhance protection against SARS-CoV-2 and related variants of concern (VOC) and emerging coronaviruses.

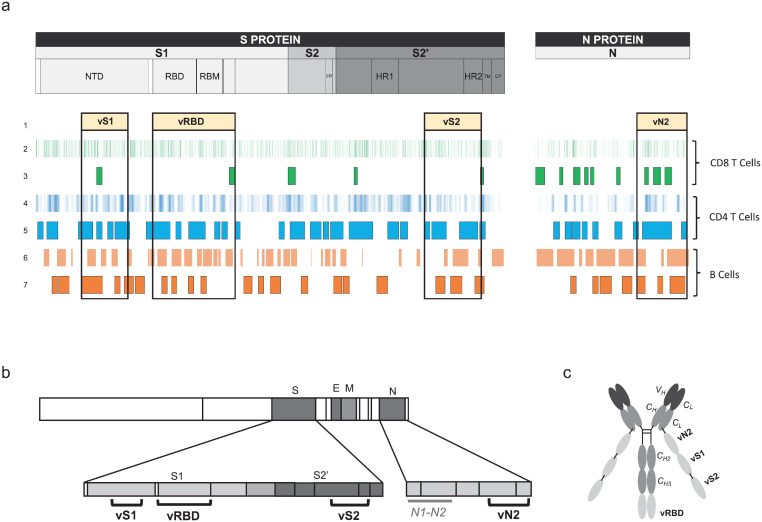
Methods: We identified conserved T- and B-cell epitopes from Spike (S) and Nucleocapsid (N) highly homologous to 38 sarbecoviruses, including SARS-CoV-2 VOCs, to design a protein subunit vaccine targeting antigens to Dendritic Cells (DC) via CD40 surface receptor (CD40.CoV2).

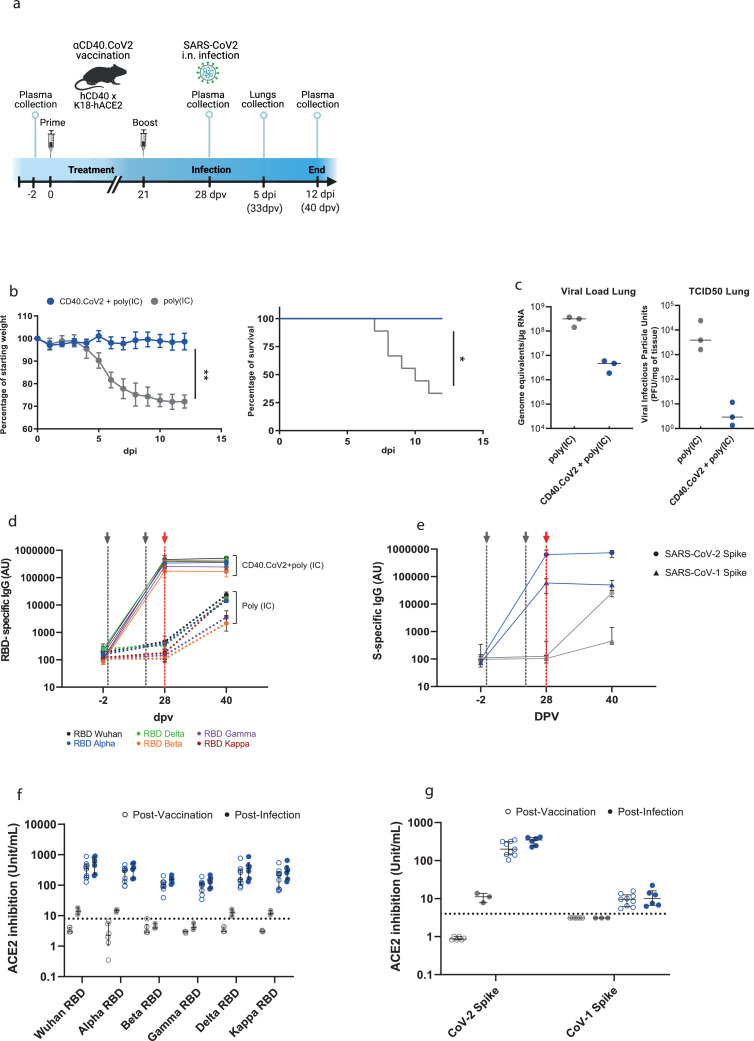
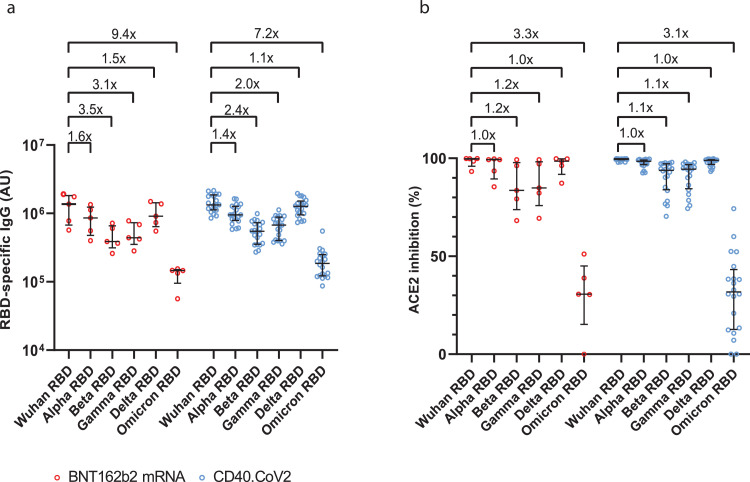
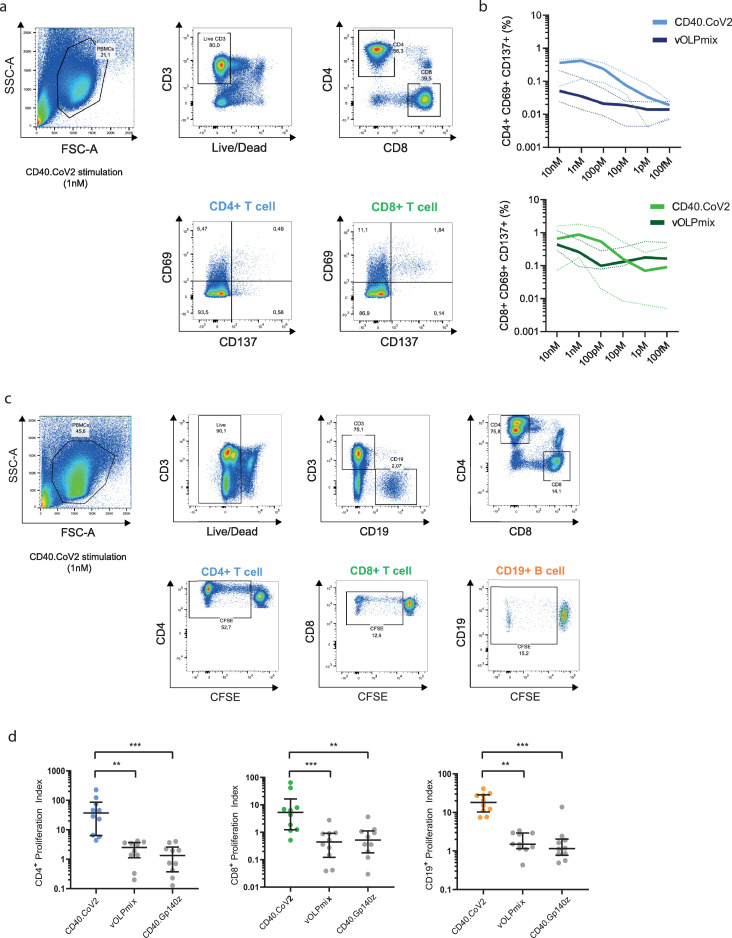
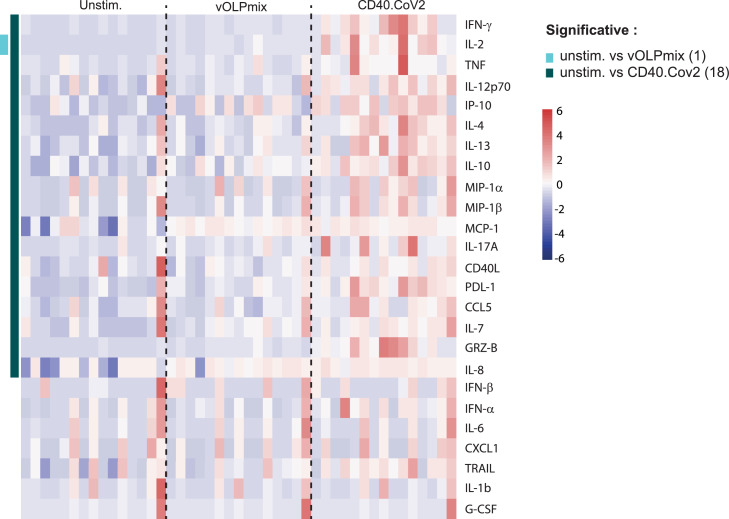
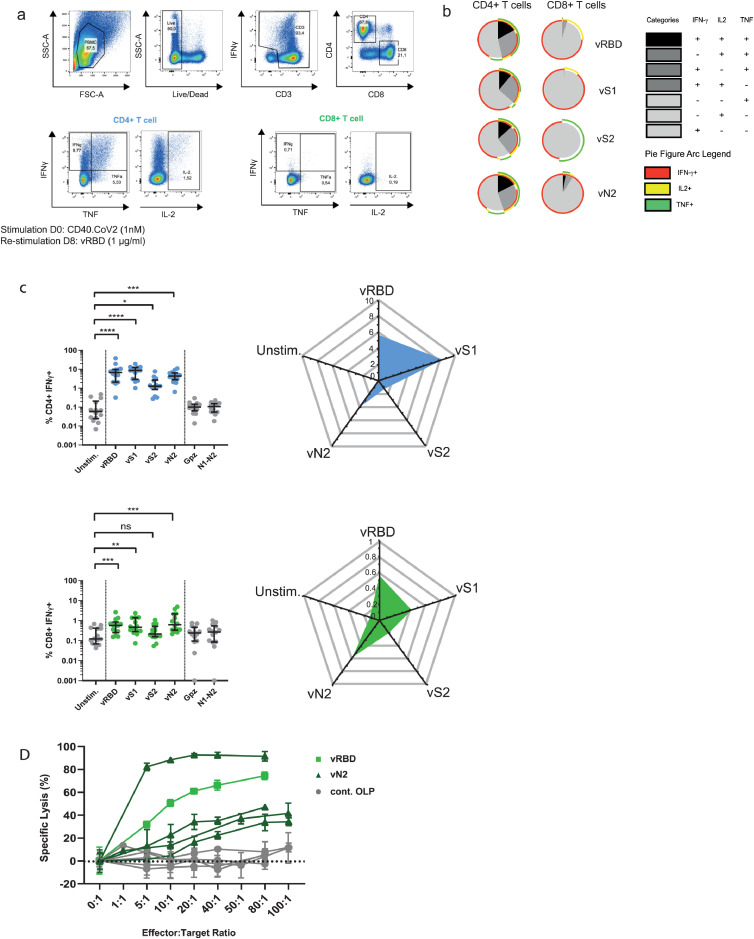
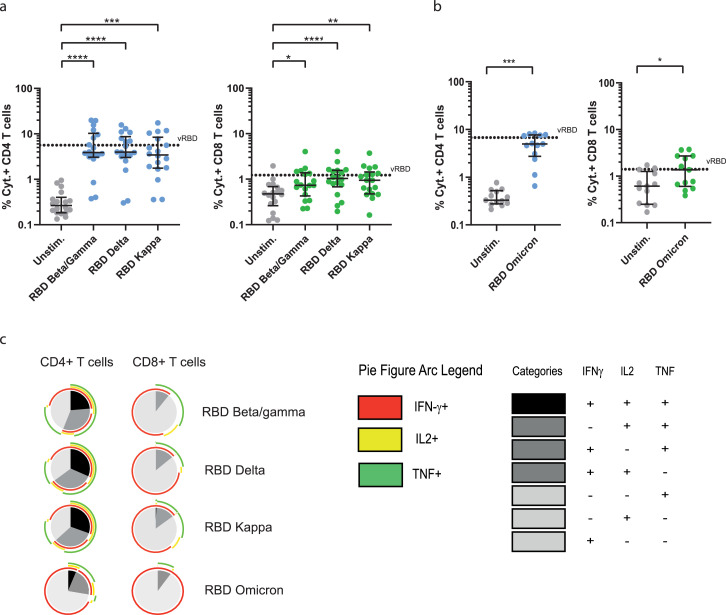
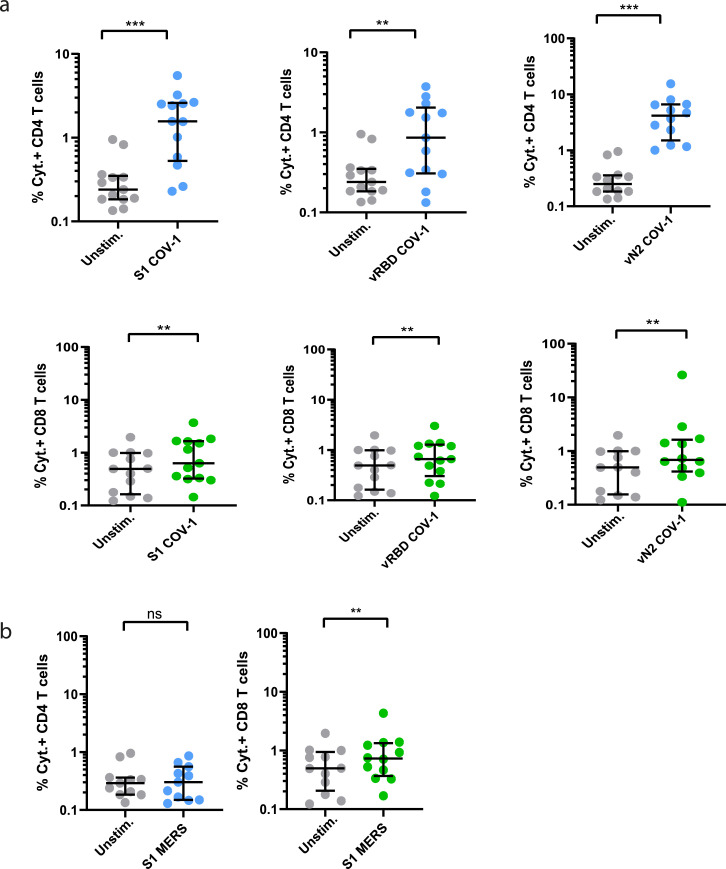
Findings: CD40.CoV2 immunization elicited high levels of cross-neutralizing antibodies against SARS-CoV-2, VOCs, and SARS-CoV-1 in K18-hACE2 transgenic mice, associated with viral control and survival after SARS-CoV-2 challenge. A direct comparison of CD40.CoV2 with the mRNA BNT162b2 vaccine showed that the two vaccines were equally immunogenic in mice. We demonstrated the potency of CD40.CoV2 to recall in vitro human multi-epitope, functional, and cytotoxic SARS-CoV-2 S- and N-specific T-cell responses that are unaffected by VOC mutations and cross-reactive with SARS-CoV-1 and, to a lesser extent, MERS epitopes.

Interpretation: We report the immunogenicity and antiviral efficacy of the CD40.CoV2 vaccine in a preclinical model providing a framework for a pan-sarbecovirus vaccine.

Fundings: This work was supported by INSERM and the Investissements d'Avenir program, Vaccine Research Institute (VRI), managed by the ANR and the CARE project funded from the Innovative Medicines Initiative 2 Joint Undertaking (JU).

Keywords: COVID-19; Pre-clinical model; SARS-CoV-2; Sarbecoviruses; Vaccine.


Conflict of interest statement

The authors S.Z., G.Z., V.G., M.C., S.C., C.L., M.S., and Y.L., are named inventors on patent applications based on this work held by Inserm Transfert. The remaining authors declare no competing interests. Inserm Transfert provided a license of CD40 targeting vaccines to biotech company LinkinVax.

Figures

Fig 1
Figure 1
Selection of SARS-CoV-2 T- and B-cell polyepitope regions for an improved dendritic cell-targeting vaccine platform. (a) Mapping of selected SARS-CoV-2 epitope-enriched regions. (1) Four selected vaccine regions. (2) Predicted SARS-CoV-2 CD8+ T-cell epitopes (NetMHC 4.0). (3) Described SARS-CoV-2 CD8+ T-cell epitopes at the time of vaccine region selection. (4) Predicted SARS-CoV-2 CD4+ T-cell epitopes (NetMHCII 2.3). (5) Described SARS-CoV-2 CD4+ T-cell epitopes at the time of vaccine region selection. (6) Predicted linear B-cell epitopes (BepiPred 2.0). (7) Described SARS-CoV-2 IgM, IgA, and IgG epitopes at the time of vaccine region selection. (b) Vaccine (v) regions (vS1, vRBD, vS2 and vN2) and control region not included in the vaccine (N1-N2) and (c) CD40.CoV2 vaccine construct.
Fig 2
Figure 2
CD40.CoV2-vaccinated animals survive SARS-CoV-2 infection and show neutralizing and cross-reactive antibody responses. (a) Design of the CD40.CoV2 vaccination strategy before SARS-CoV-2 infection. (b) Relative weight and survival of mock-vaccinated (grey) and vaccinated (blue) hCD40/K18-hACE2 transgenic mice after SARS-CoV-2 inoculation. Both parameters were recorded from days 0 to 12 post infection (pi). The mean ± SD is presented. A Mann-Whitney U test was conducted to compare differences in weight between the two groups on day 12 (n = 9–12 animals per group) (**P < 0.01). Kaplan-Meier survival curves were generated (n = 6–9 animals per group) and the P value was calculated using the [log-rank (Mantel-Cox) test] (*P < 0.05). (c) Viral load (genome equivalent/µg RNA) and viral infectious particle units (PFU/mg of tissue) in the lungs of mock-vaccinated (grey) and vaccinated (blue) hCD40/K18-hACE2 transgenic mice (n = 3 animals per group) on day 5 pi with the median plotted as a line. (d) Levels of IgG antibodies (AU) binding to Wuhan and VOCs SARS-CoV-2 RBD proteins before vaccination (baseline, -2 days post-vaccination (dpv), n = 9–12 animals per group), after the completion of the vaccination schedule (28 dpv, n = 9–12 animals per group), and 40 dpv (i.e., day 12 pi time point, n = 3–5 animals per group). (e) Levels of IgG antibodies (AU) binding to SARS-CoV-2 (circles) and SARS-CoV-1 (triangles) S proteins in mock-vaccinated (grey) and vaccinated (blue) animals at -2, 28, and 40 dpv. Medians [Min-Max] are shown. The grey dashed lines represent prime and boost vaccines. The red dashed line represents SARS-CoV-2 inoculation. Neutralizing activity of (f) anti-RBD antibodies (units/mL) and (g) anti-S antibodies (units/mL) in mock-vaccinated (grey) and vaccinated (blue) animals post-vaccination (open circles) and post-infection (solid circles). Medians ± Interquartile ranges (IQRs) are shown. Thirty plasma samples from unvaccinated mice were used to determine the threshold for positivity, defined as the whole units/mL value immediately above the concentration of the highest sample for RBD (i.e., 8 units/mL) and Spike (i.e., 4 units/mL) proteins. These results were reproduced in a second independent experiment (Figure S3).
Fig 3
Figure 3
CD40.CoV2 and mRNA BNT162b2 vaccines elicit similar cross-reactive and neutralizing antibody responses. Levels of IgG antibodies (AU) binding to Wuhan and VOCs SARS-CoV-2 RBD proteins (α, β, γ, δ Omicron) (a) and neutralizing activity of anti-RBD antibodies (percentage of inhibition relative to the Wuhan RBD protein) (b) one week after completion of the vaccination schedule in BNT162b2 mRNA (red) or CD40.CoV2 vaccinated animals (blue) (n = 5 and 20 animals, respectively). Medians ± Interquartile ranges (IQRs) are shown.
Fig 4
Figure 4
Determination of the optimal immunogenic CD40.CoV2 vaccine concentration and proliferation of specific T cells induced by the CD40.CoV2 vaccine. (a) Gating strategy for specific T cells that upregulate activation-induced markers (AIM). (b) Antigen specific activation of CD4+ (blue) and CD8+ (green) T cells from COVID-19 convalescent patients (n = 5) stimulated with various concentrations of CD40.CoV2 vaccine or a combination of OLPs covering the full-length sequence of the vaccine antigens (vOLPmix). Activation of SARS-CoV-2-specific CD4+ and CD8+ T cells is shown as the percentage of CD69+ CD137+ cells within the CD4+ or CD8+ subset after background subtraction. Median values (solid line) ± interquartile ranges (IQRs) (dashed lines) are shown. (c) Gating strategy for assessing the proliferation of specific T and B cells after seven days of CD40.CoV2 stimulation. (d) Proliferation of CD4+ T-cells, CD8+ T-cells, and B-cells from COVID-19 convalescent patients (n = 10) induced by the CD40.CoV2 vaccine, an irrelevant vaccine (CD40 Gp140z [1 nM]), or an equimolar concentration of vOLPmix. Data are expressed as a proliferation index obtained by dividing the frequency of proliferating cells after specific stimulation over background. Median values ± IQRs are shown. [Friedman and Dunn's multiple comparison tests] were used for statistical analysis (**P < 0.01, ***P < 0.001).
Fig 5
Figure 5
Heatmap of standardized biomarker expression in culture supernatants induced by the CD40.CoV2 vaccine. Supernatants from convalescent COVID-19 patient PBMCs collected on day 2 after stimulation with the CD40.CoV2 vaccine (1 nM) or an equimolar concentration of vOLPmix (n = 15). The colors represent standardized expression values centered around the mean, with variance equal to 1. Biomarker hierarchical clustering was computed using the Euclidean distance and Ward's method.
Fig 6
Figure 6
Polyfunctional and cytotoxic specific T-cell responses of convalescent COVID-19 patients after in-vitro stimulation with the CD40.CoV2 vaccine. (a) Representative dot plots of SARS-CoV-2-specific CD4+ and CD8+ T-cell responses after in vitro stimulation of patient PBMCs with the CD40.CoV2 vaccine (1 nM) on D0 and re-stimulation with various vOLPs (vRBD, vS1, vS2 or vN2) (1 µg/ml) on D8. (b) Functional composition of SARS-CoV-2-specific CD4+ and CD8+ T-cell responses induced by the CD40.CoV2 vaccine and various vOLPs (vRBD, vS1, vS2 or vN2) (1 µg/ml). Responses are color coded according to the combination of cytokines produced. The arcs identify cytokine-producing subsets (IFN-γ, IL-2, and TNF) within the CD4+ or CD8+ T cell populations. (c) Frequency and radar charts of the merged median of IFN-γ+ SARS-CoV-2-specific CD4+ (blue) or CD8+ (green) T cells from convalescent COVID-19 patients (n = 14) stimulated or not with the CD40.CoV2 vaccine (1 nM) on D0 and re-stimulated with various vOLPs (vRBD, vS1, vS2 or vN2), cont.OLP (SARS-CoV-2 N1-N2, or Ebola Gpz) (grey) on D8 (1 µg/mL). Median values ± IQRs are shown. [Friedman and Dunn's multiple comparison tests] were used for statistical analysis (*P < 0.05, **P < 0.01, ***P < 0.001, ****P < 0.0001, ns: not significant). (d) Specific lysis of CD8+ T cells stimulated with the CD40.CoV2 vaccine (1 nM) against autologous PHA-blasted PBMCs from five different convalescent COVID-19 patients, pulsed with either vRBD (light green), vN2 (dark green), or cont.OLP (SARS-CoV-2 N1-N2 or M) (grey). The means of triplicate values ± the standard deviation (SD) are shown. Each symbol represents a different patient.
Fig 7
Figure 7
Polyfunctional specific T-cell responses against SARS-CoV-2 VOCs after stimulation with the CD40.CoV2 vaccine. Frequency of total cytokines (IFN-γ ± IL-2 ± TNF) produced by specific CD4+ (blue) or CD8+ (green) T cells from convalescent COVID-9 patients (n = 18) after in-vitro stimulation with the CD40.CoV2 vaccine (1 nM) on D0 and re-stimulation with RBD OLP from various VOCs/VOI (a) or RBD OLP from Omicron VOC (n = 13) (1 µg/mL) (b). Functional composition of SARS-CoV-2-specific CD4+ and CD8+ T-cell responses induced by the CD40.CoV2 vaccine against VOCs/VOI. Responses are color coded according to the combination of cytokines produced. The arcs identify cytokine-producing subsets (IFN-γ, IL-2, and TNF) within the CD4+ and CD8+ T-cell populations (c). Median values ± IQRs are shown. [Friedman's test] and [Wilcoxon U test] were used for comparisons (*P < 0.05, **P < 0.01, ***P < 0.001, ****P < 0.0001).
Fig 8
Figure 8
Cross-reactive specific T-cell responses against SARS-CoV-1 and MERS of convalescent COVID-19 patients after in-vitro stimulation with the CD40.CoV2 vaccine. Frequency of total cytokines (IFN-γ ± IL-2 ± TNF) produced by specific CD4+ (blue) or CD8+ (green) T cells after in-vitro stimulation with the CD40.CoV2 vaccine (1 nM) on D0 and re-stimulation with OLPs representing the sequences of S1, vRBD, and vN2 from (a) SARS-CoV-1 and (b) S1 from MERS (1 µg/mL). Median values ± IQRs are shown. The [Wilcoxon U test] was used for comparisons (**P < 0.01, ***P < 0.001, ns: not significant).

References

    1. Anderson E.J., Rouphael N.G., Widge A.T., et al. Safety and Immunogenicity of SARS-CoV-2 mRNA-1273 vaccine in older adults. N Engl J Med. 2020;383:2427–2438. - PMC - PubMed
    1. Angyal A., Longet S., Moore S., et al. T-cell and antibody responses to first BNT162b2 vaccine dose in previously SARS-CoV-2-infected and infection-naive UK healthcare workers: a multicentre, prospective, observational cohort study. SSRN J. 2021 doi: 10.2139/ssrn.3812375. - DOI - PMC - PubMed
    1. Lozano-Ojalvo D., Camara C., Lopez-Granados E., et al. Differential effects of the second SARS-CoV-2 mRNA vaccine dose on T cell immunity in naive and COVID-19 recovered individuals. Cell Rep. 2021;36 - PMC - PubMed
    1. Kalimuddin S, Tham CYL, Qui M, et al. Early T cell and binding antibody responses are associated with COVID-19 RNA vaccine efficacy onset. Med (N Y). 2021;2(6):682–688.e4 - PMC - PubMed
    1. Mazzoni A., Di Lauria N., Maggi L., et al. First-dose mRNA vaccination is sufficient to reactivate immunological memory to SARS-CoV-2 in subjects who have recovered from COVID-19. J Clin Invest. 2021;131 - PMC - PubMed