. 2022 Aug 15:257:119287.
doi: 10.1016/j.neuroimage.2022.119287. Epub 2022 May 17.

Normal aging in mice is associated with a global reduction in cortical spectral power and network-specific declines in functional connectivity

Affiliations

Normal aging in mice is associated with a global reduction in cortical spectral power and network-specific declines in functional connectivity

Asher J Albertson et al. Neuroimage. .

Abstract

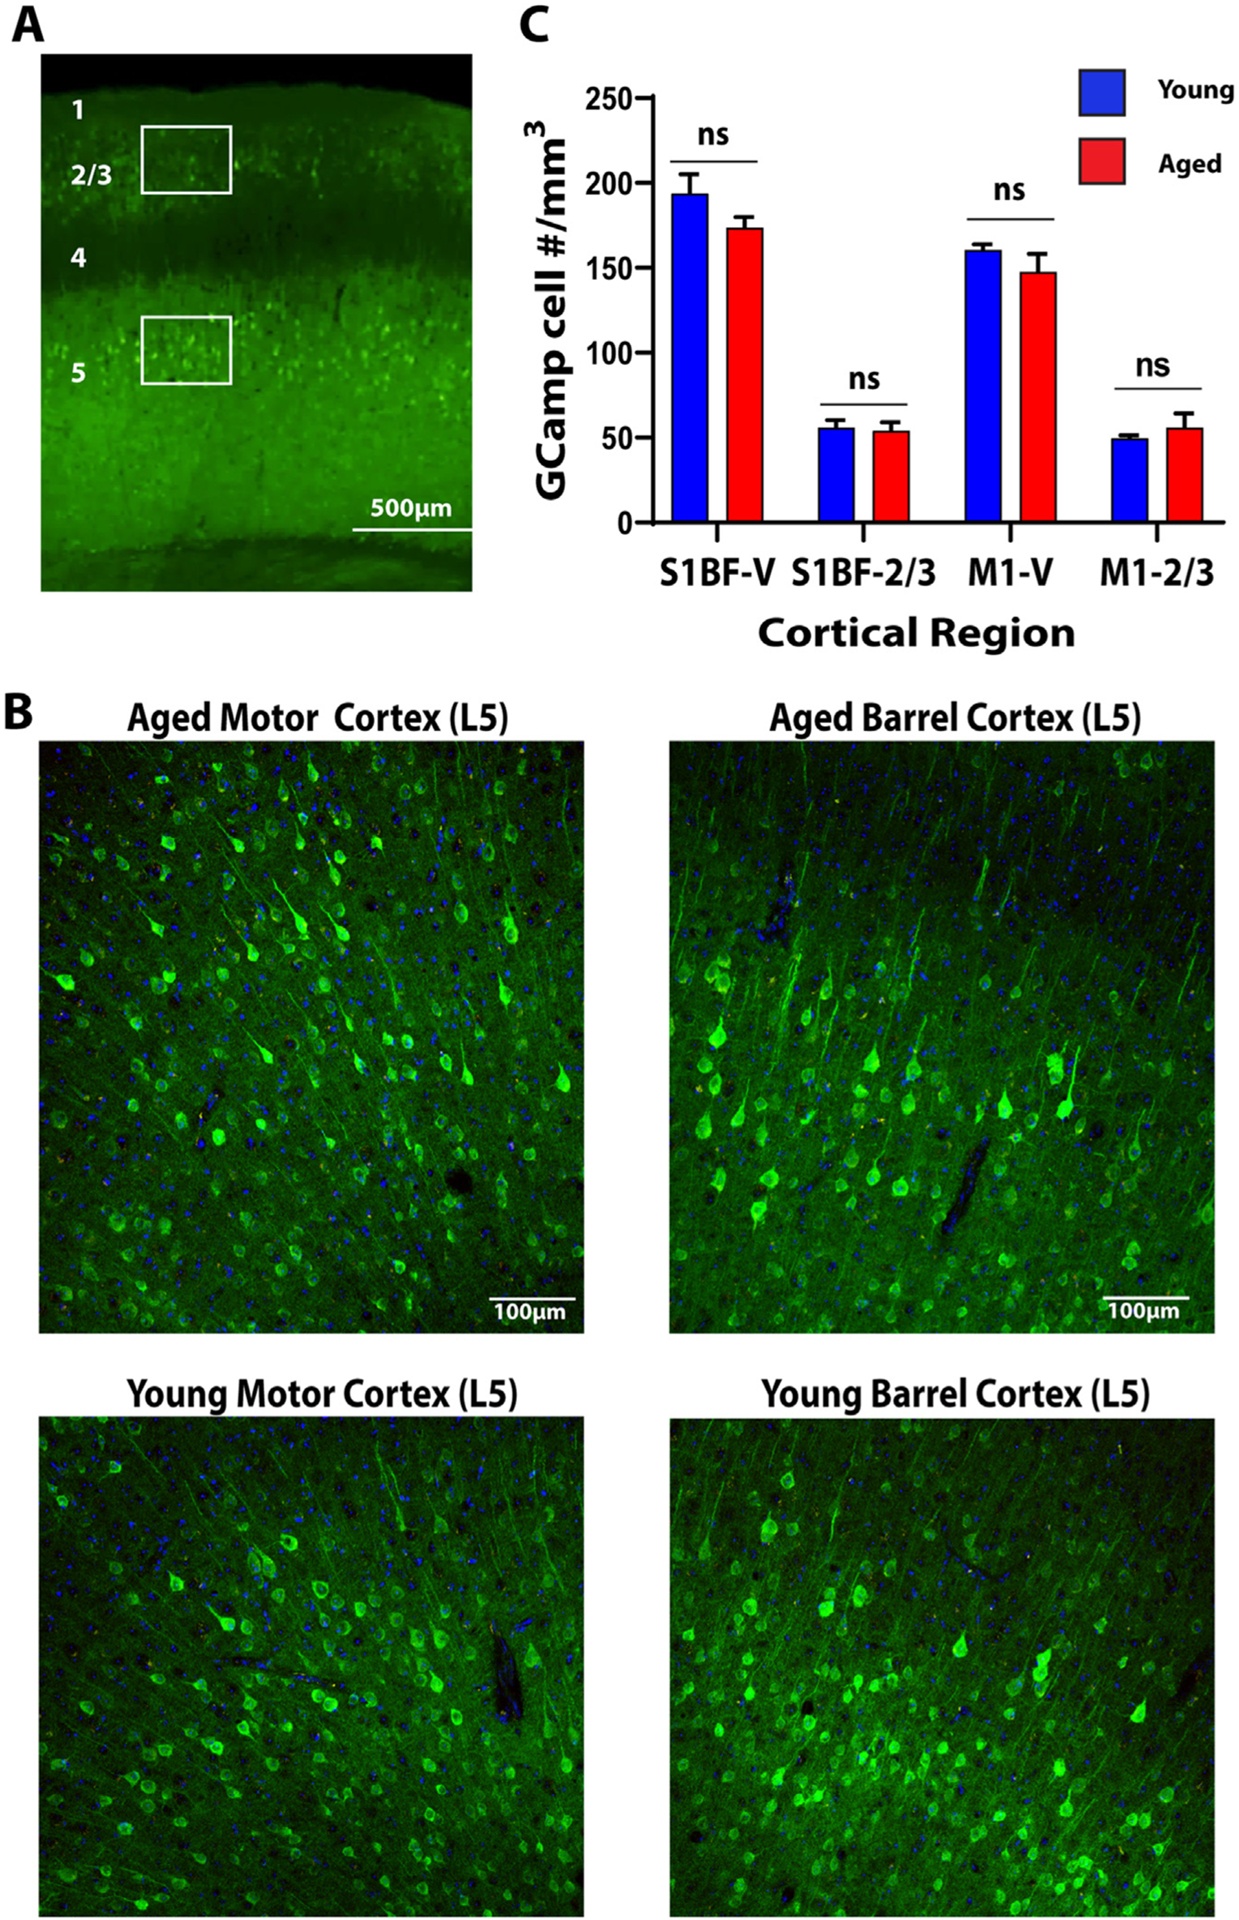
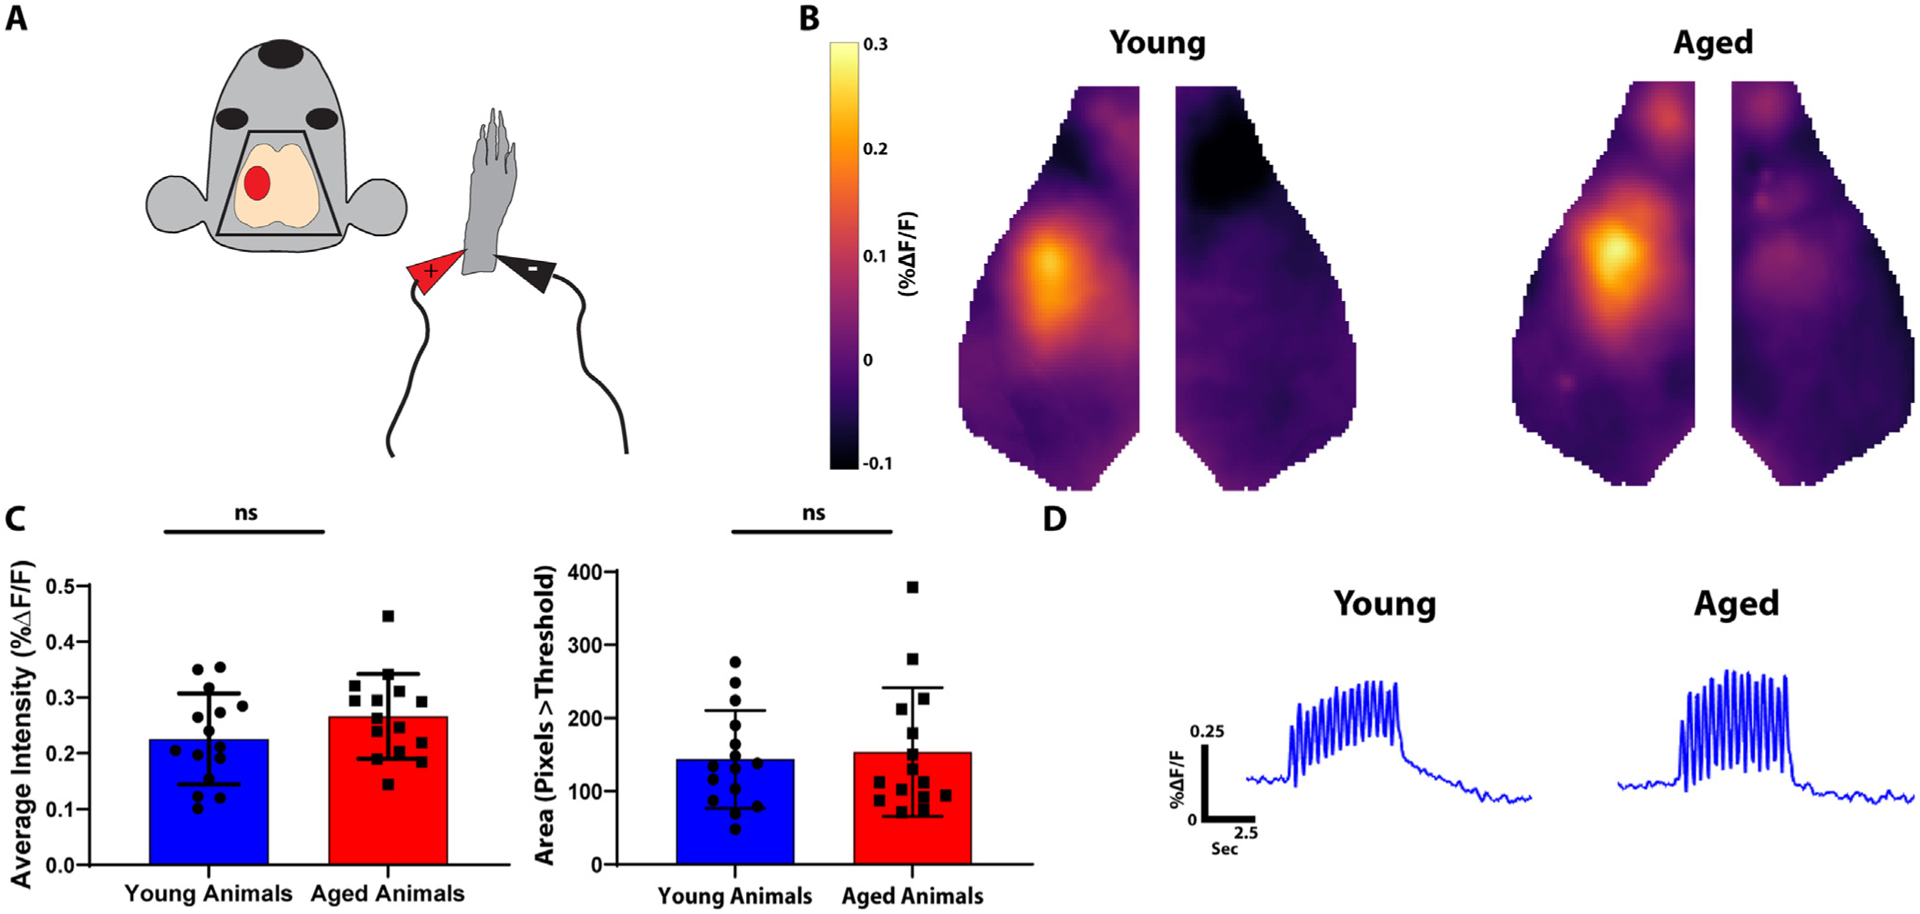
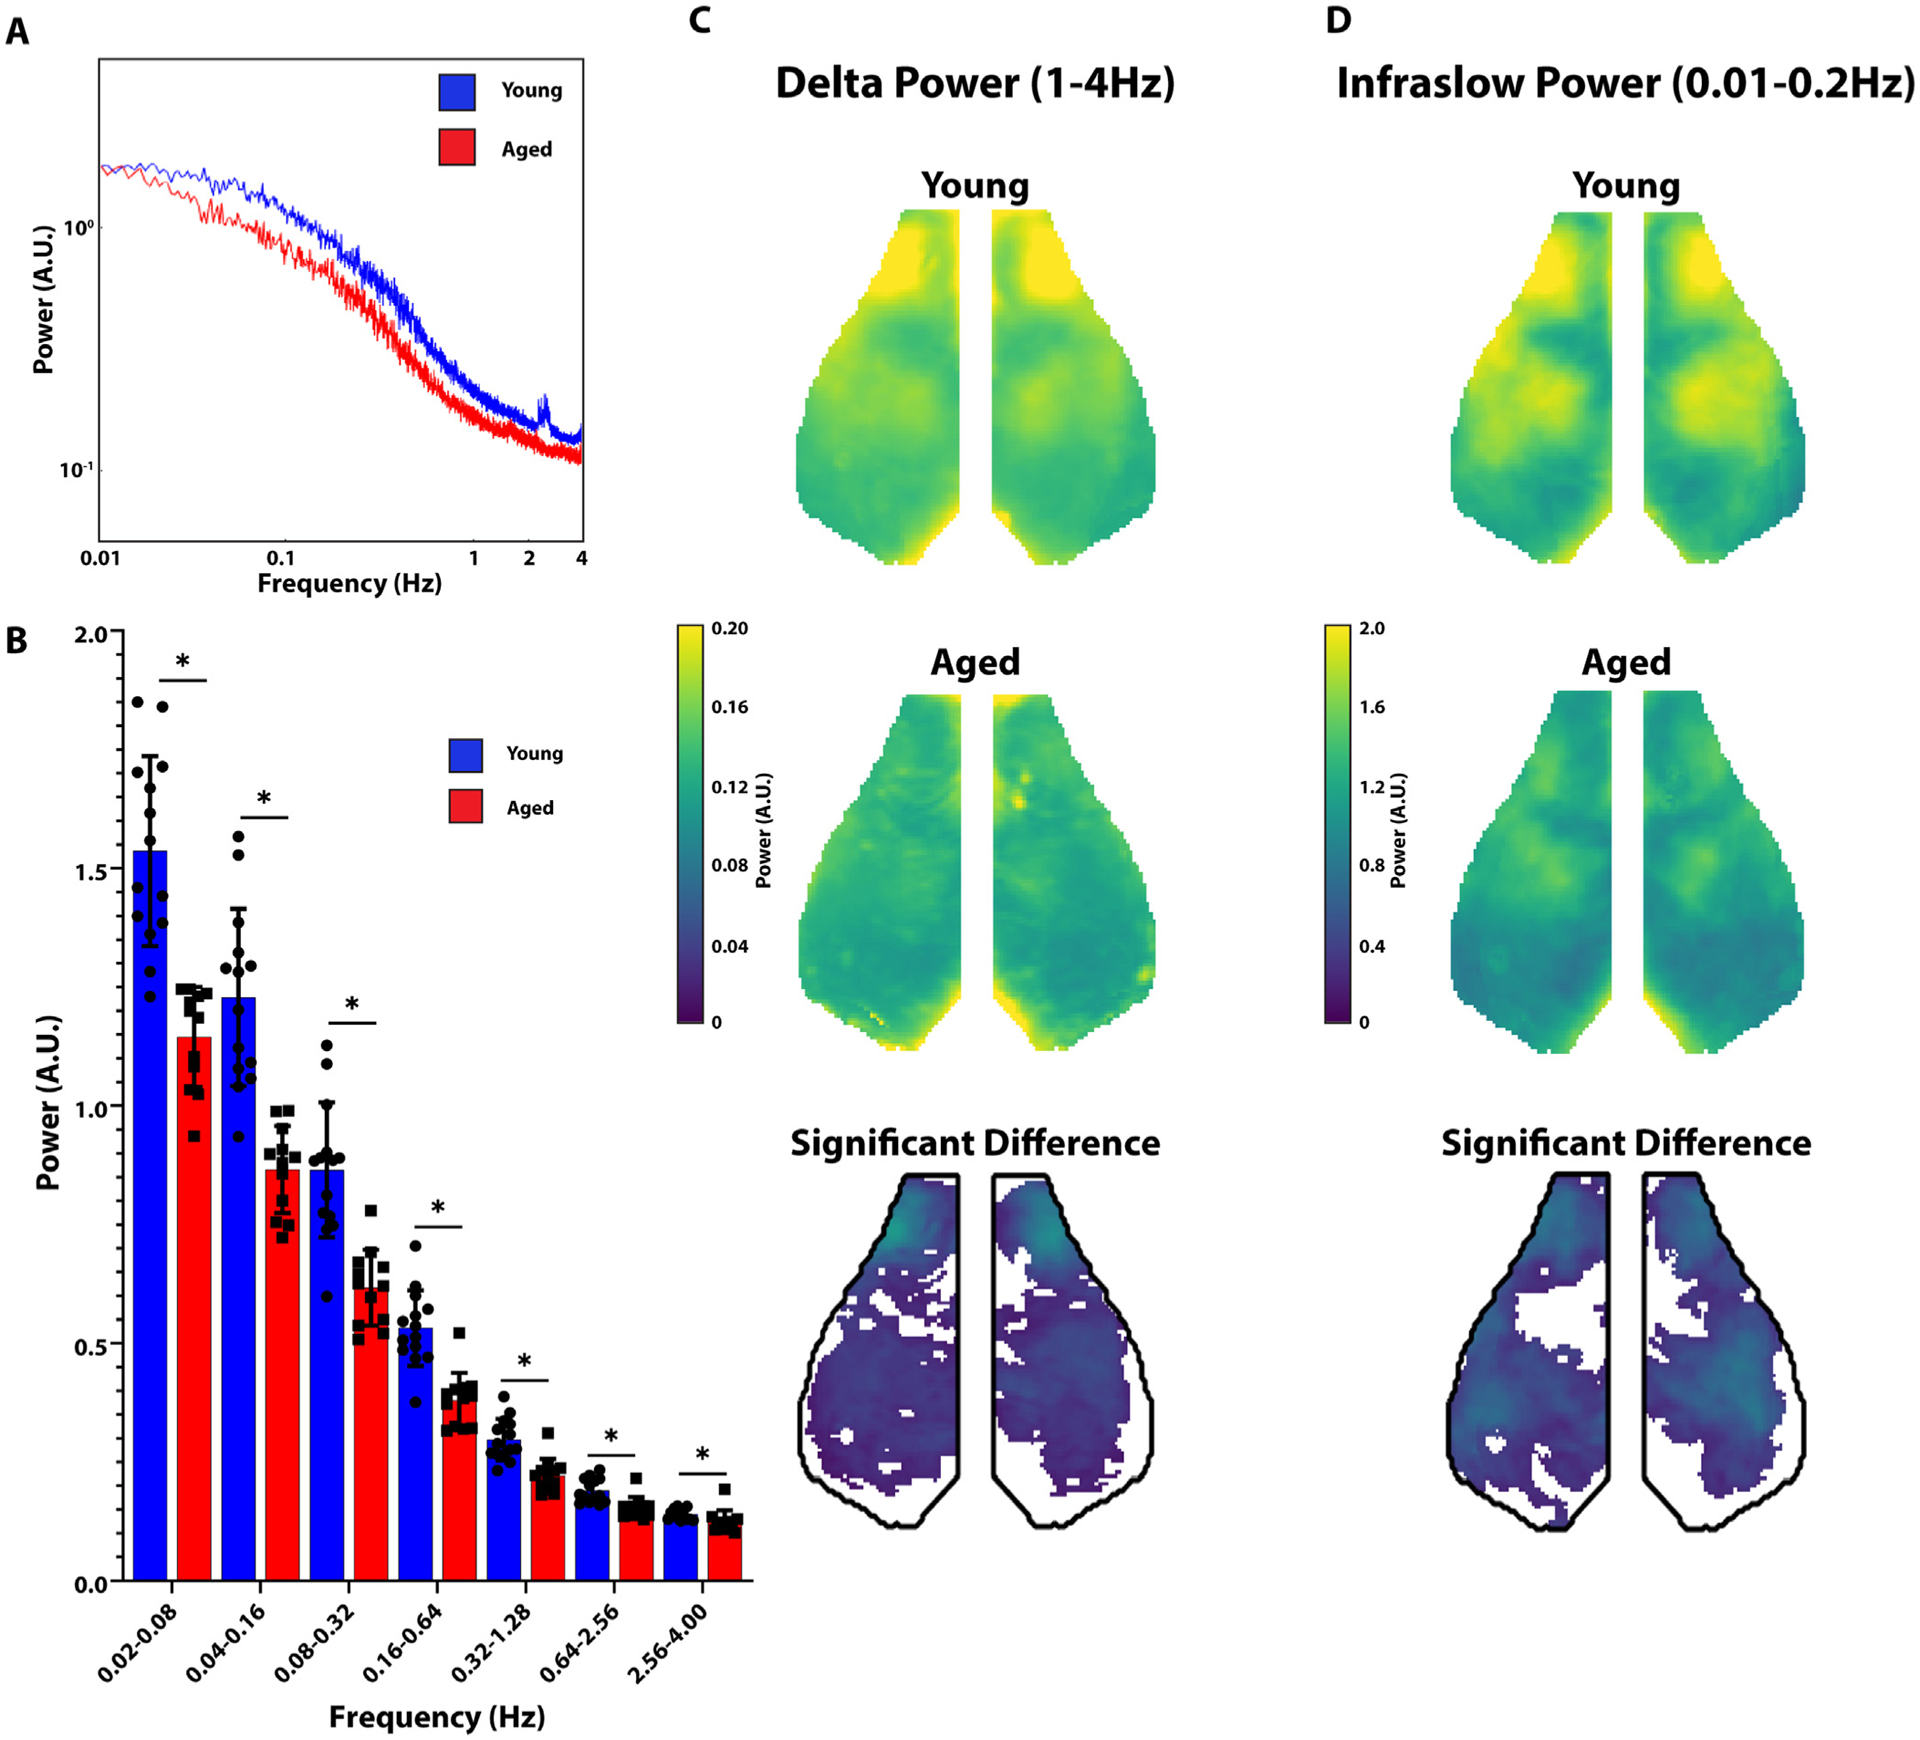
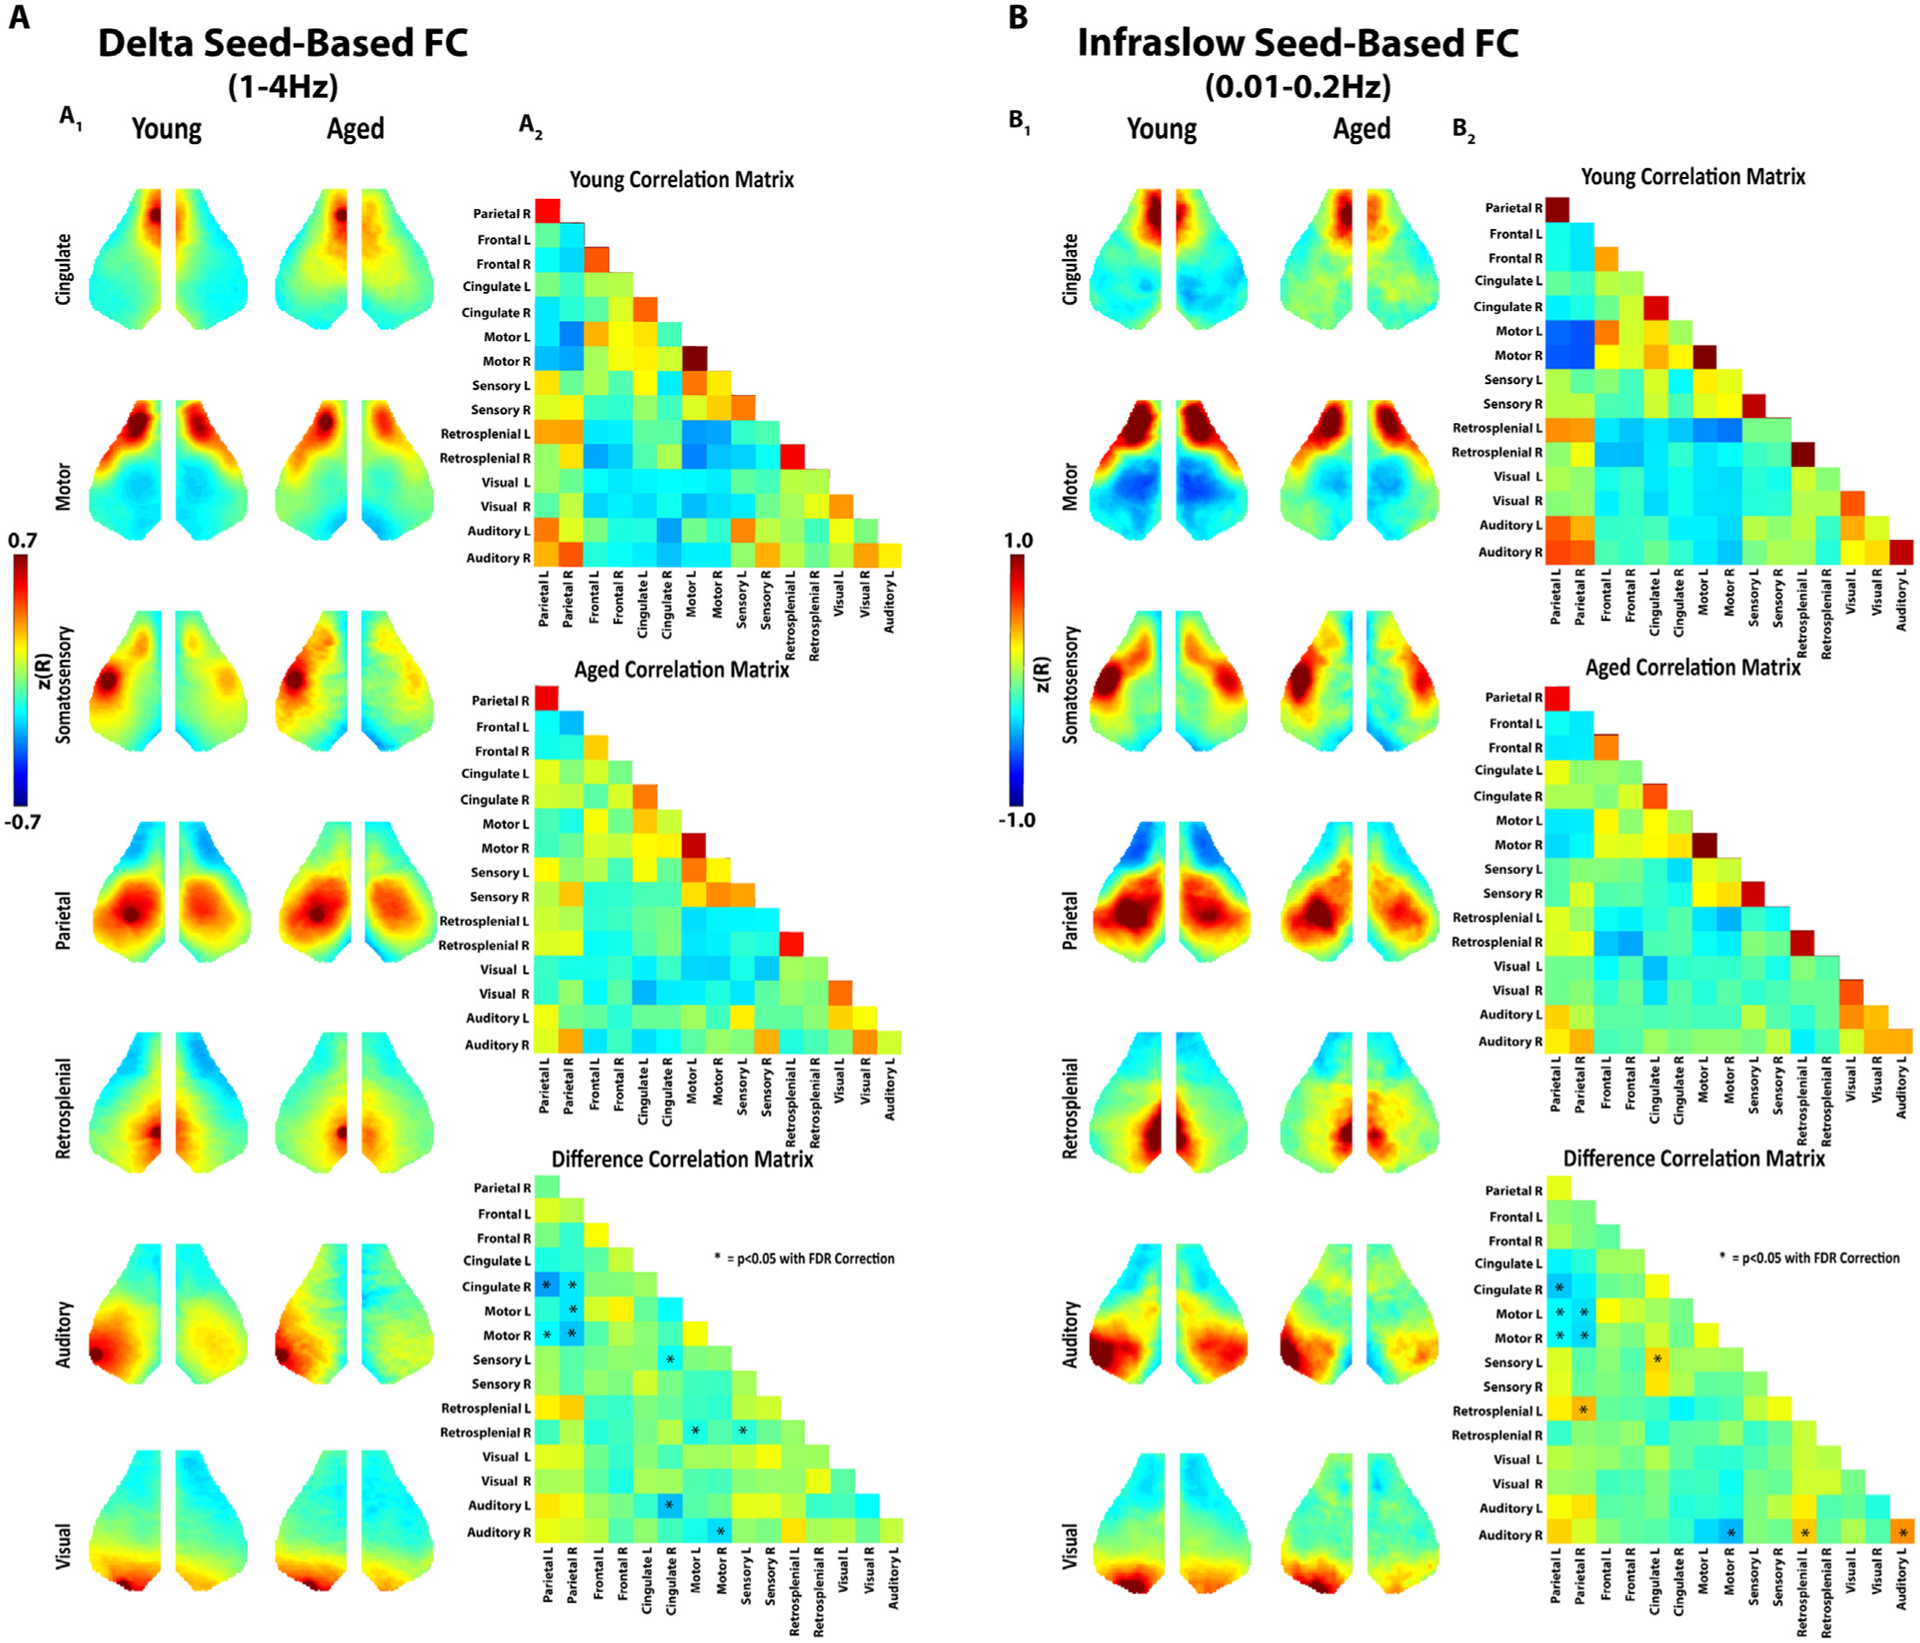
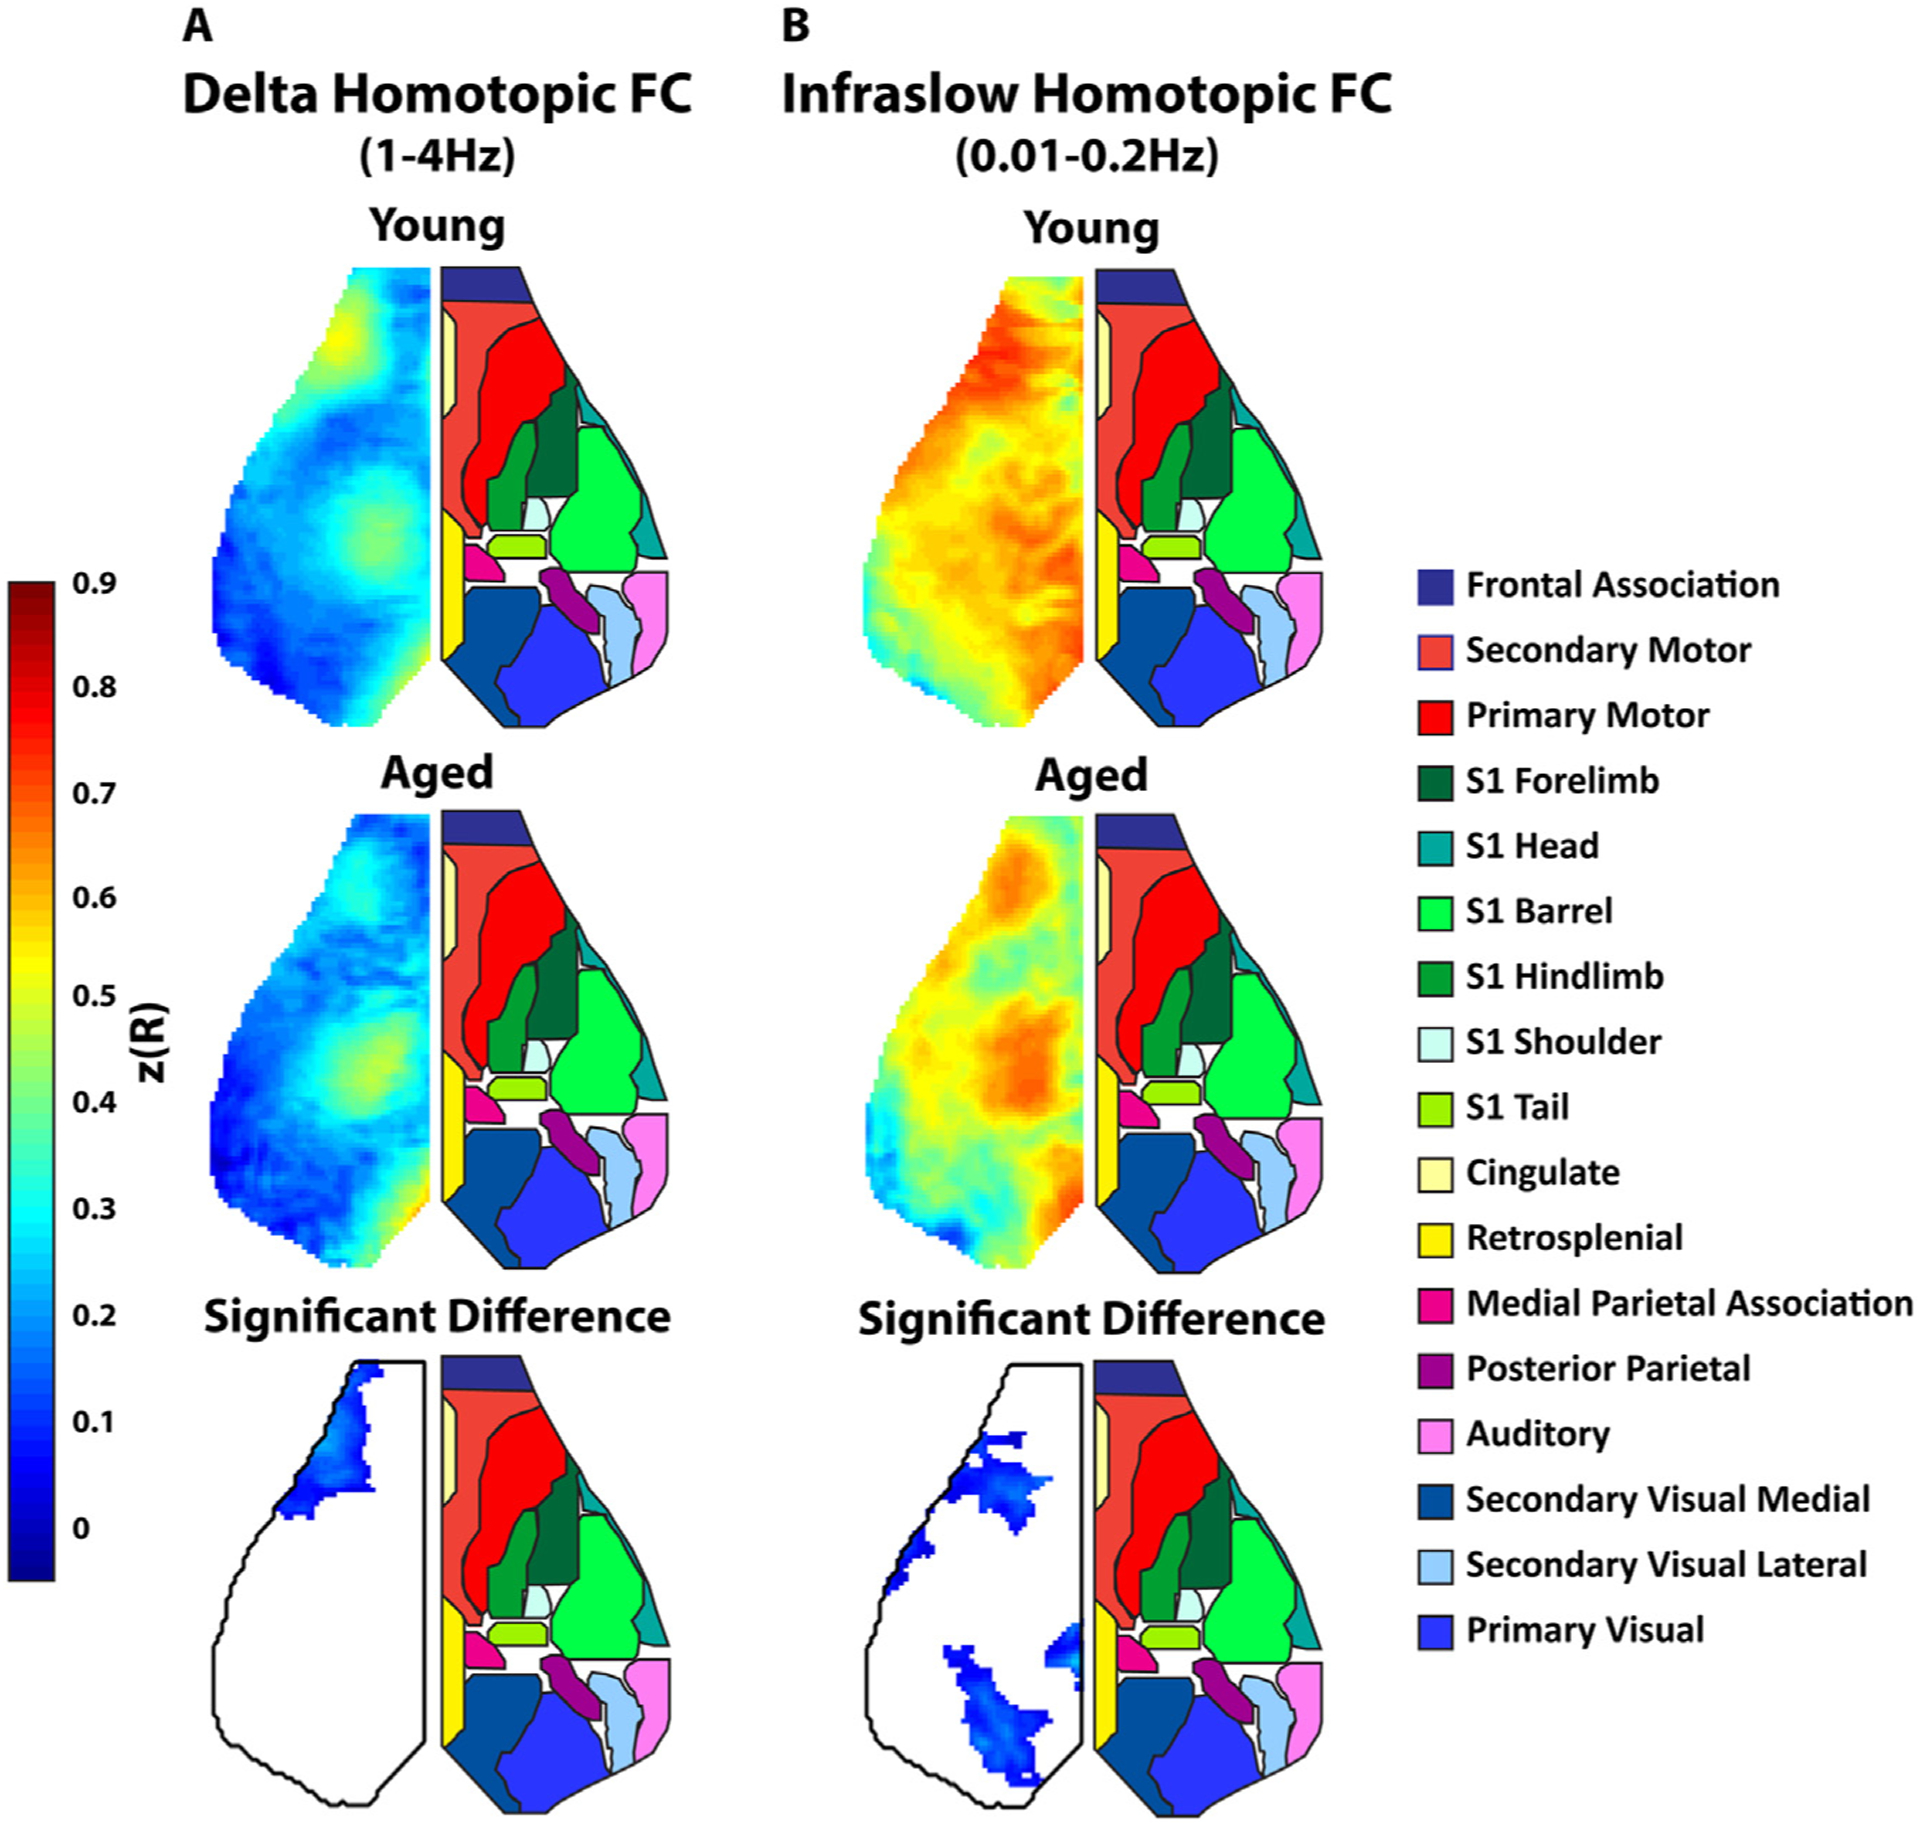
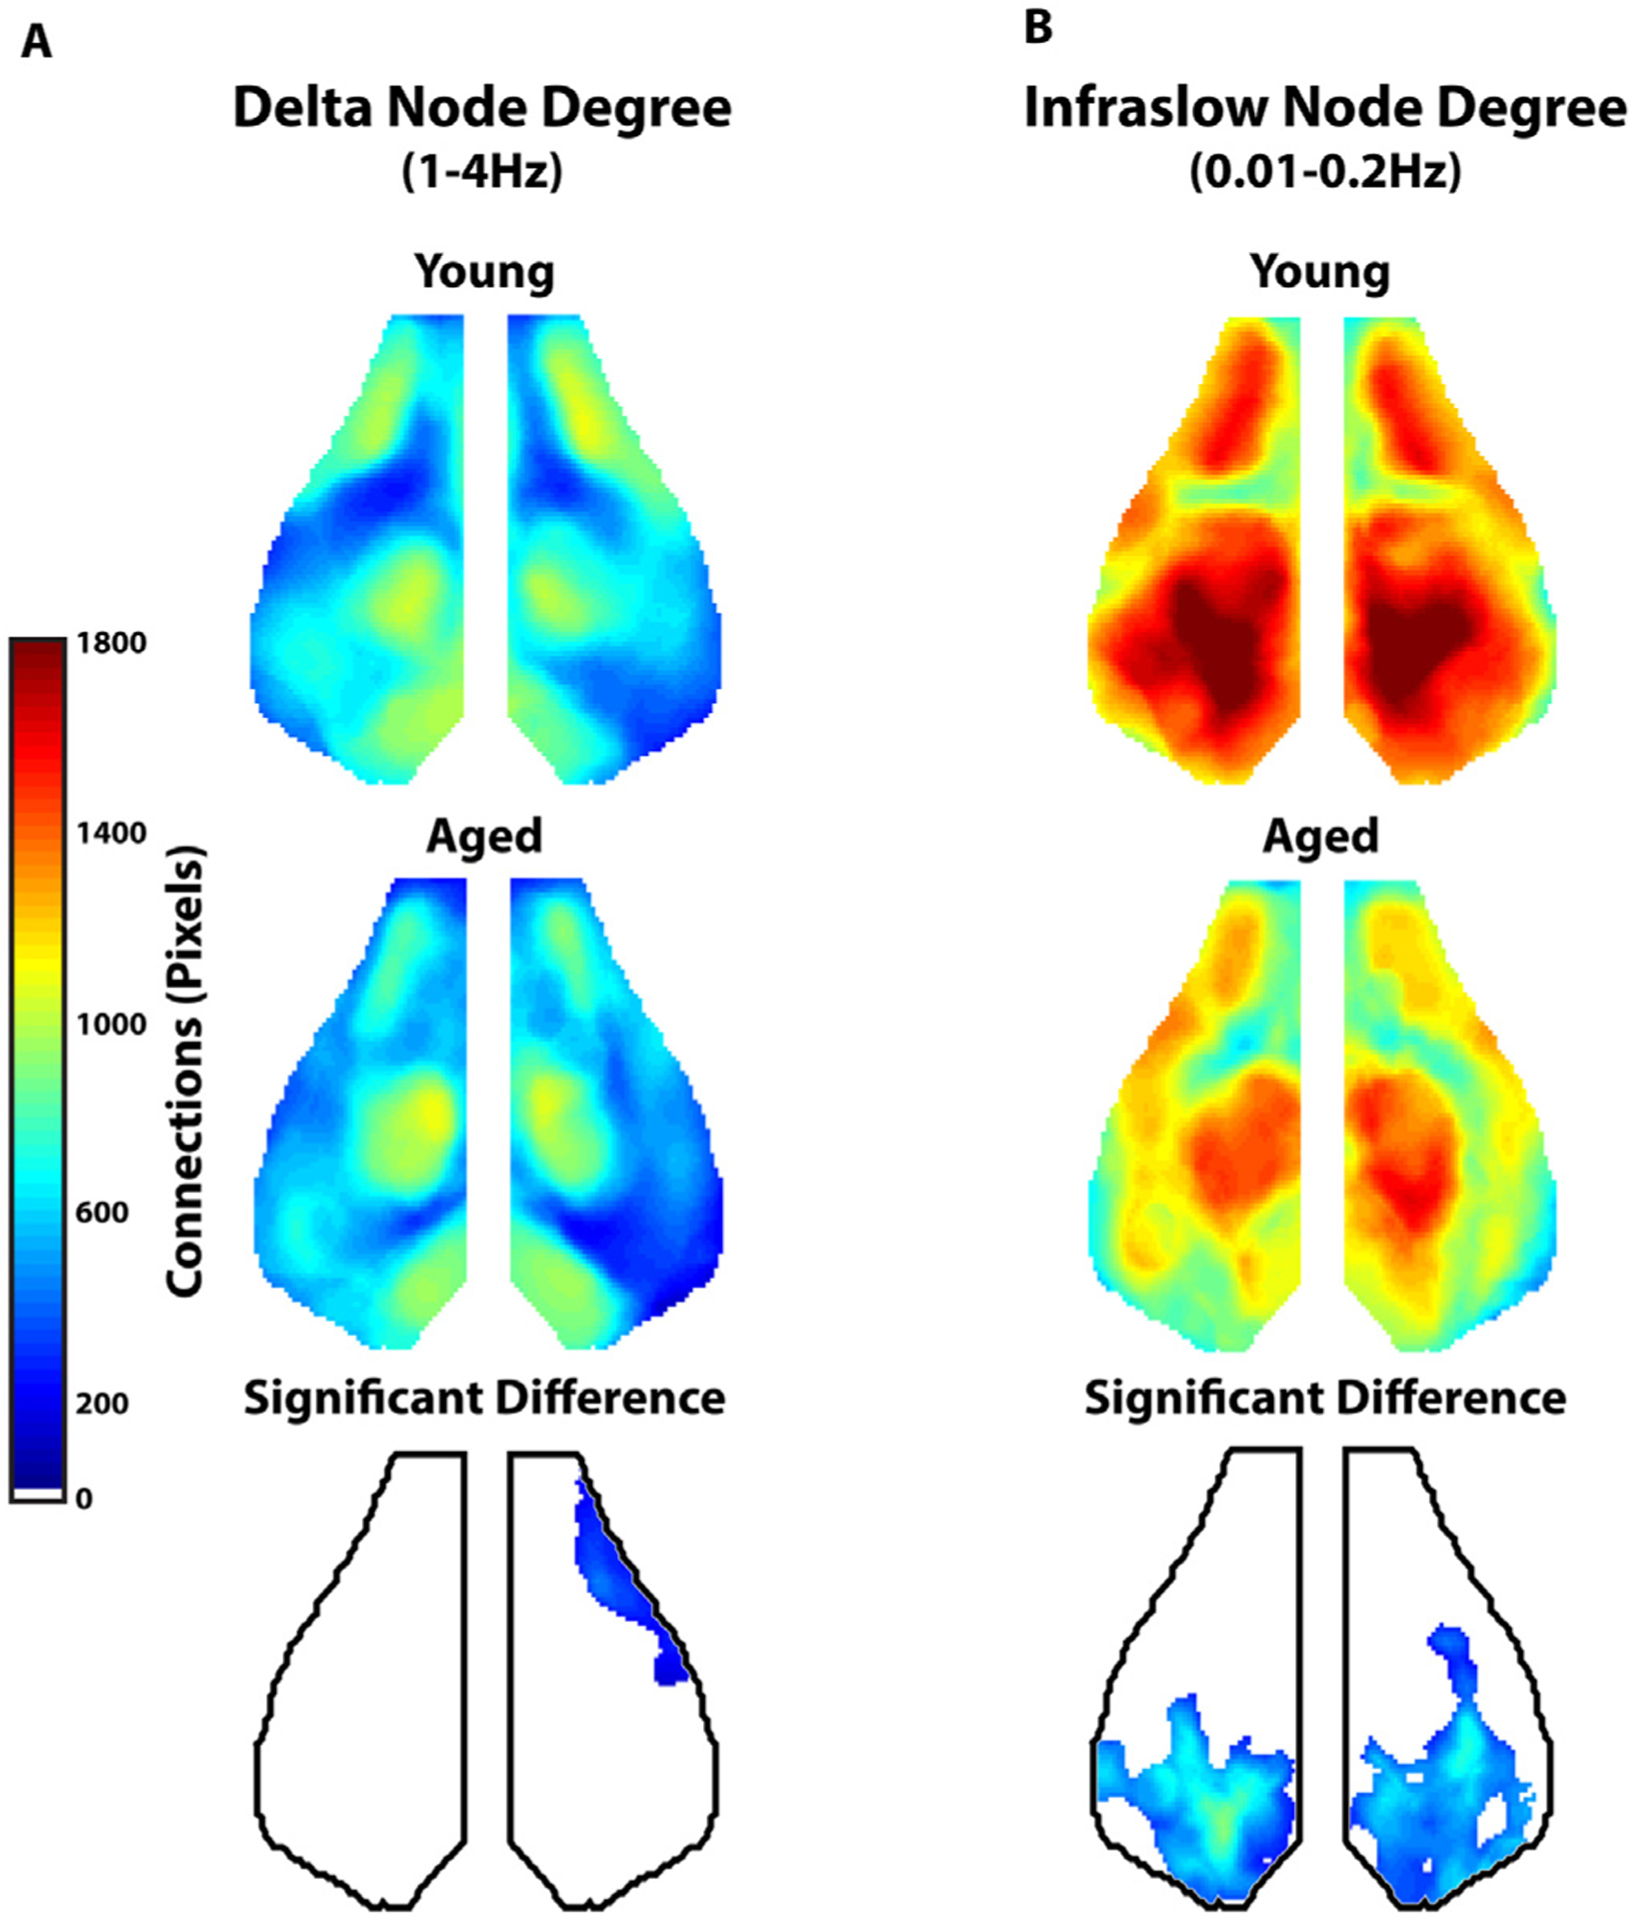
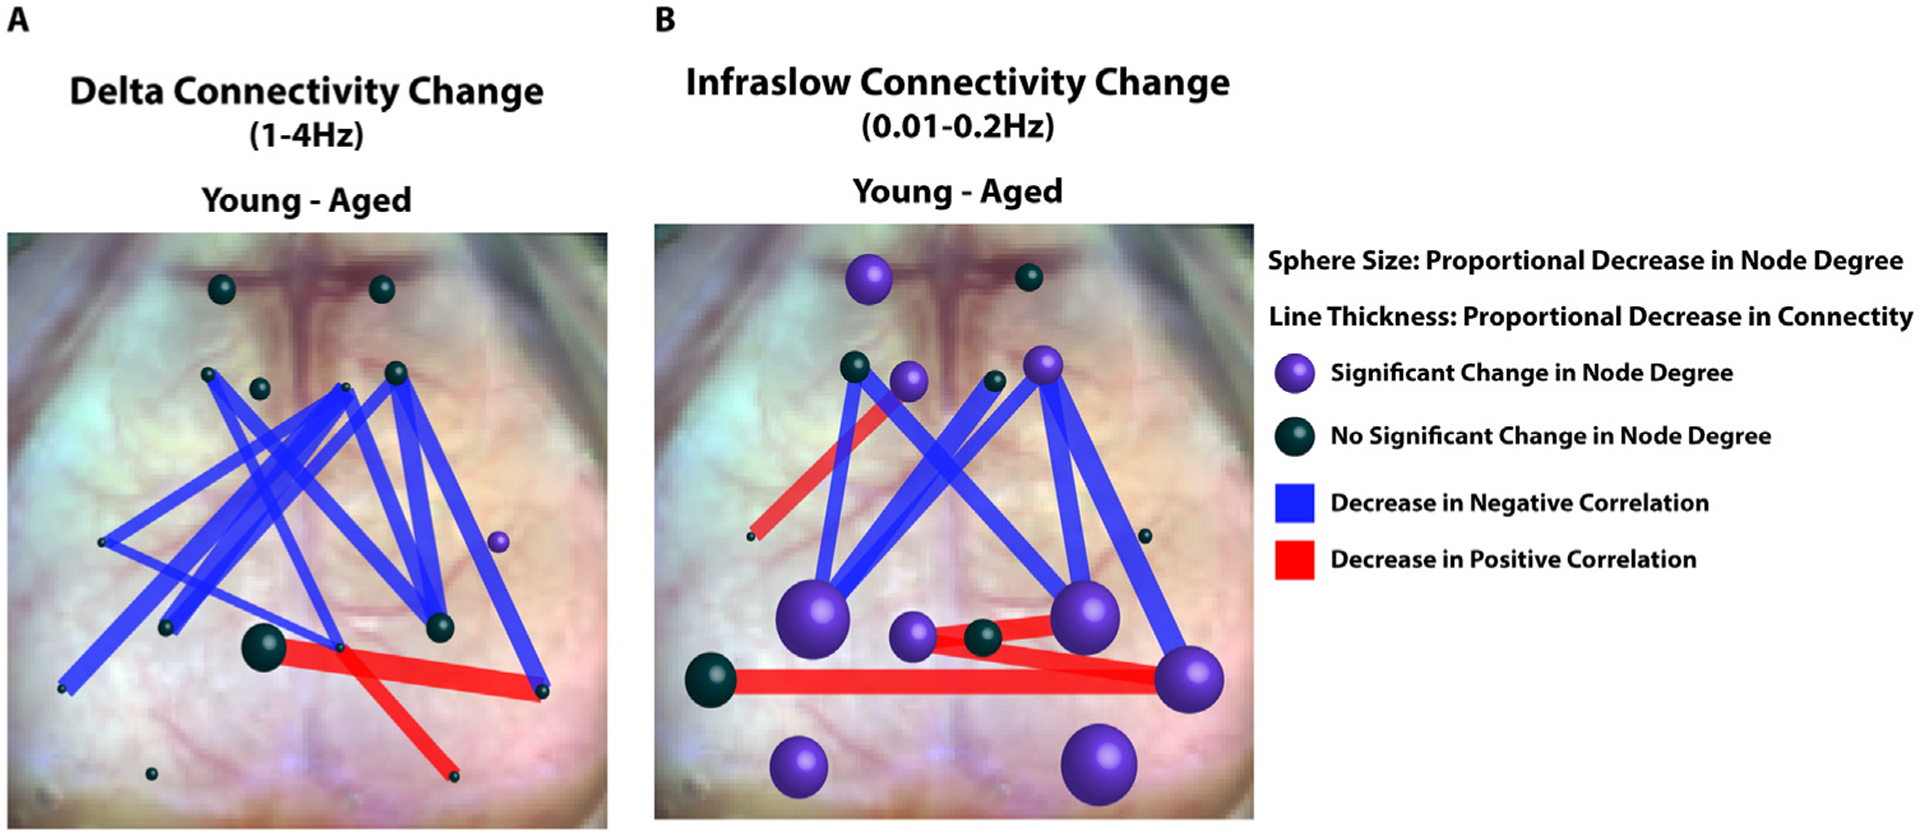
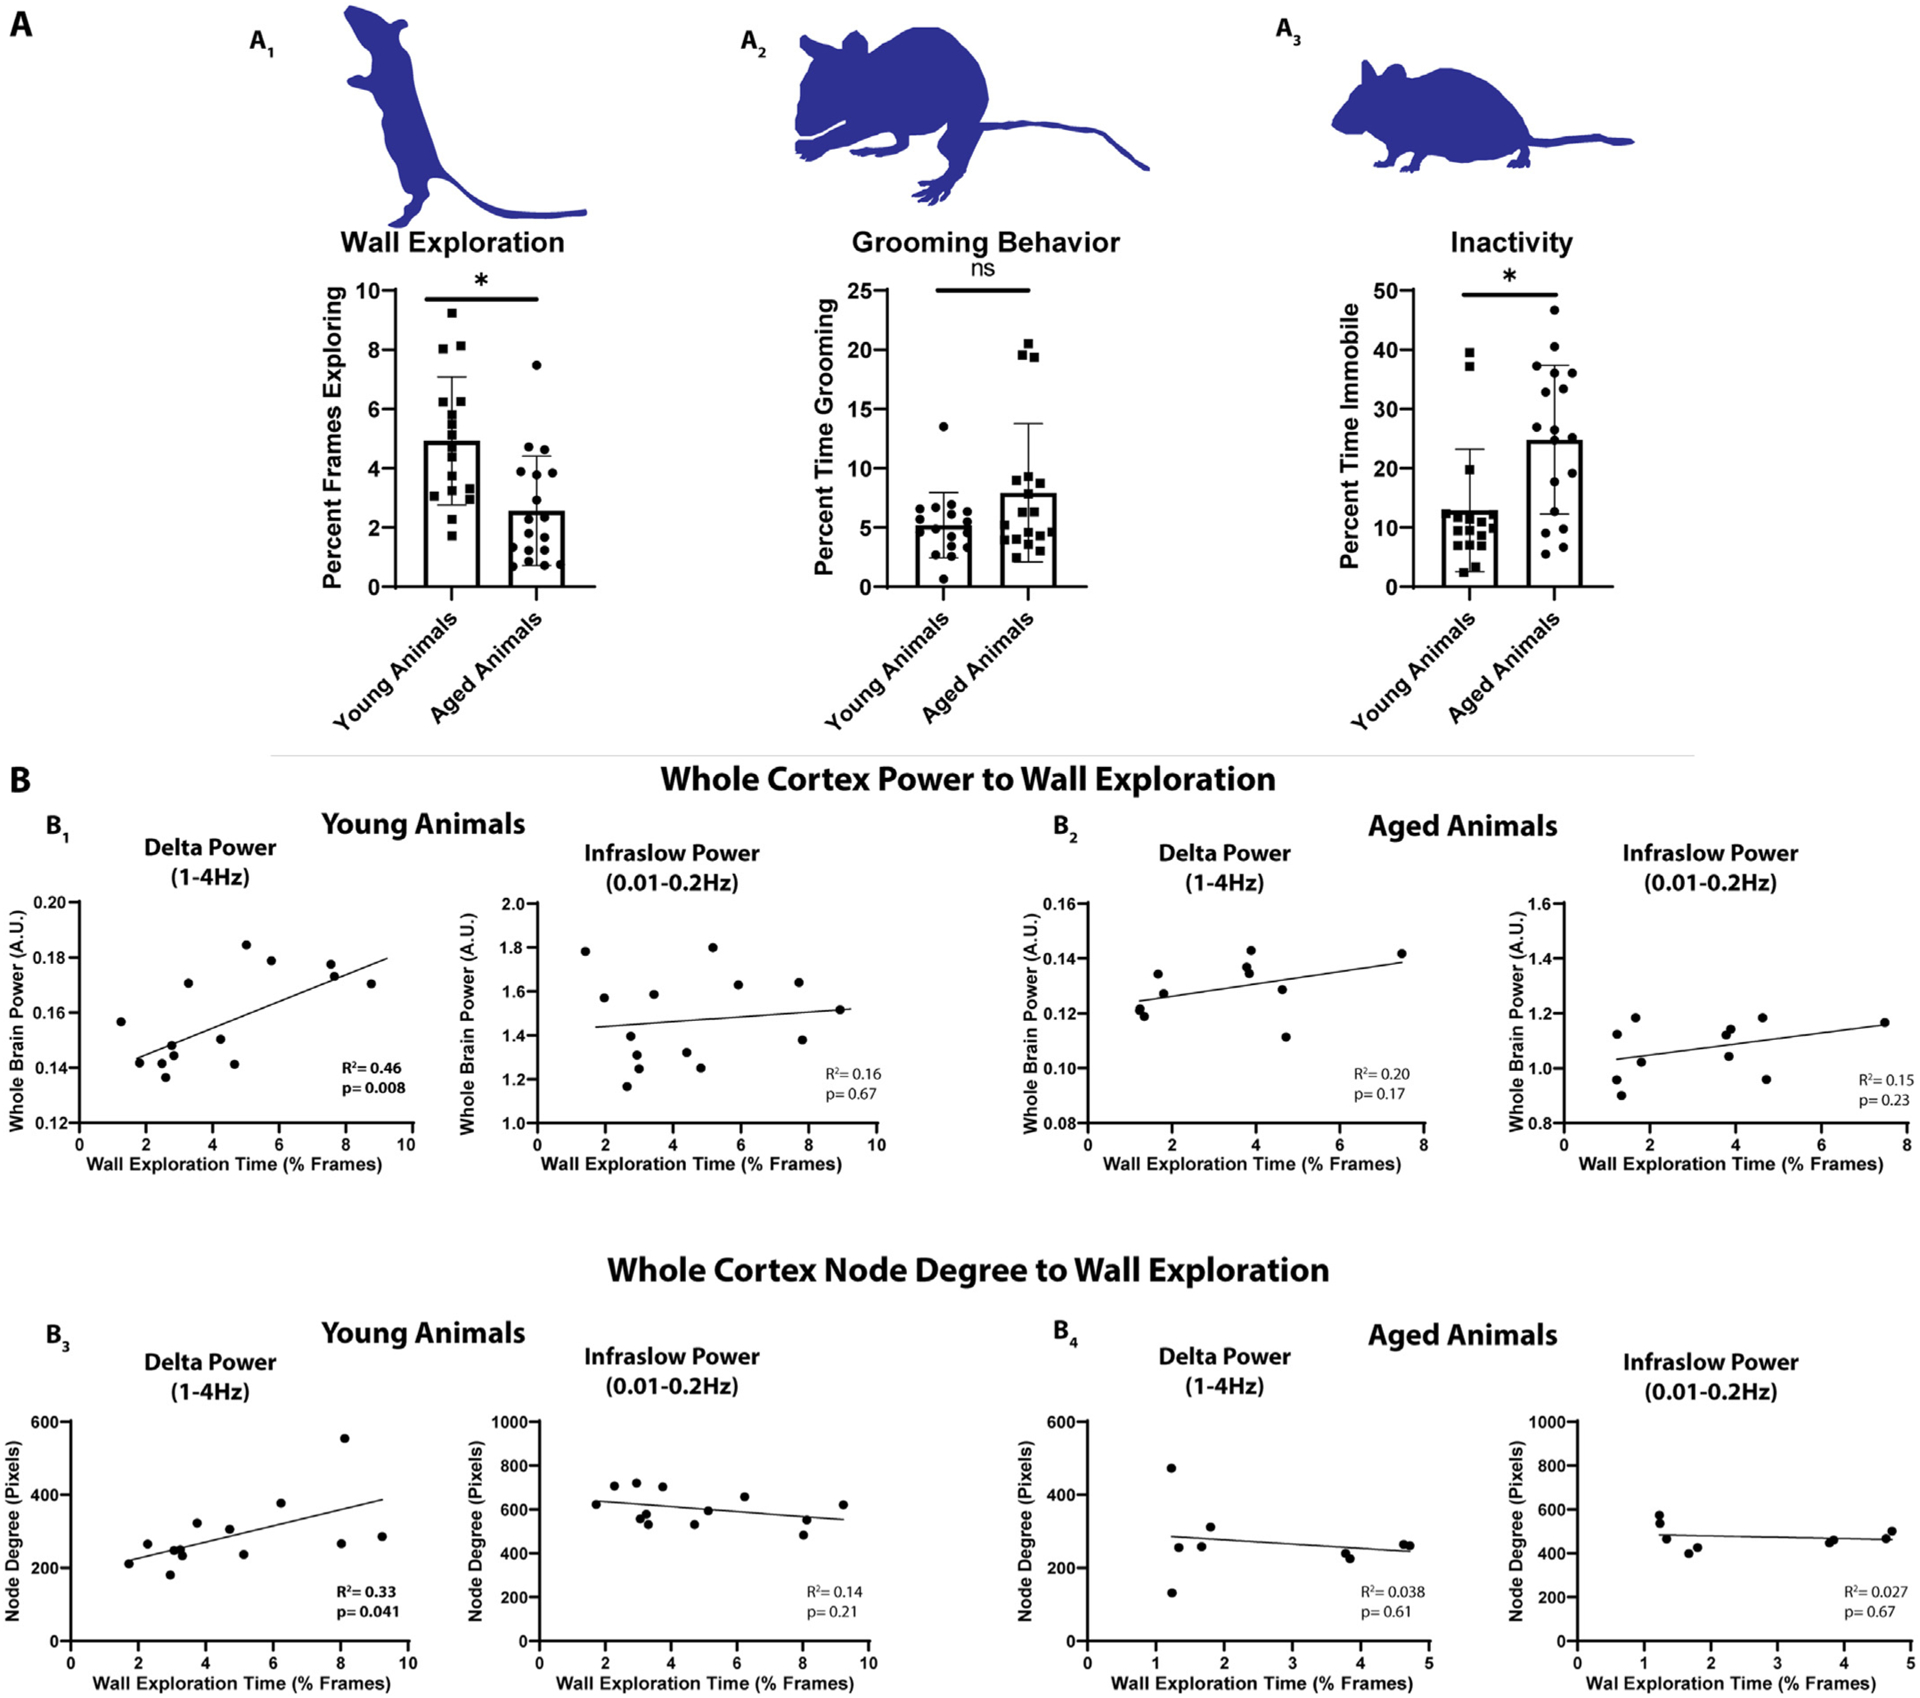
Normal aging is associated with a variety of neurologic changes including declines in cognition, memory, and motor activity. These declines correlate with neuronal changes in synaptic structure and function. Degradation of brain network activity and connectivity represents a likely mediator of age-related functional deterioration resulting from these neuronal changes. Human studies have demonstrated both general decreases in spontaneous cortical activity and disruption of cortical networks with aging. Current techniques used to study cerebral network activity are hampered either by limited spatial resolution (e.g. electroencephalography, EEG) or limited temporal resolution (e.g., functional magnetic resonance imaging, fMRI). Here we utilize mesoscale imaging of neuronal activity in Thy1-GCaMP6f mice to characterize neuronal network changes in aging with high spatial resolution across a wide frequency range. We show that while evoked activity is unchanged with aging, spontaneous neuronal activity decreases across a wide frequency range (0.01-4 Hz) involving all regions of the cortex. In contrast to this global reduction in cortical power, we found that aging is associated with functional connectivity (FC) deterioration of select networks including somatomotor, cingulate, and retrosplenial nodes. These changes are corroborated by reductions in homotopic FC and node degree within somatomotor and visual cortices. Finally, we found that whole-cortex delta power and delta band node degree correlate with exploratory activity in young but not aged animals. Together these data suggest that aging is associated with global declines in spontaneous cortical activity and focal deterioration of network connectivity, and that these reductions may be associated with age-related behavioral declines.

Keywords: Aging; Cortex; Functional connectivity; GCaMP.


Conflict of interest statement

Declaration of Competing Interest None to disclose

Figures

Fig. 1.
Fig. 1.. Young and Aged Mice have Similar Cortical GCaMP Expression.
A. Low magnification view of the cortex. Numbers represent cortical layers. Boxes represent regions of interest in which counts were undertaken. B. Representative expression patterns from layer 5 motor and barrel cortex in aged and young animals. C. Quantification of GCaMP positive cell count in Layer 2/3 and Layer 5 barrel and motor cortices in aged (red) vs young (blue) animals.
Fig. 2.
Fig. 2.. Young and Aged Mice have Similar Patterns of Evoked Somatosensory Cortex Activity.
A. Diagram of experimental paradigm. The right forepaw was stimulated with mild electrical pulsations and contralateral somatosensory cortex activity was imaged (red oval). B. Average somatosensory activation in young (left) and aged (right) animals. C. Quantification of evoked somatosensory activity. The left graph represents average intensity within a somatosensory ROI. The right graph represents total area of activation as measured by pixels greater than threshold. D. Averaged fluorescence amplitude curves over time within a somatosensory ROI in young (left) vs. aged (right) animals.
Fig. 3.
Fig. 3.. Aged Animals have Significantly Reduced Resting State Power.
A. Power spectral density is shown in arbitrary units (A.U.). Graph of Power as a function of frequency in aged (red) vs young (blue) animals. B. Whole-cortex power divided into octaves in young (blue) vs. aged (red) animals. Young animals had significantly greater whole-cortex power at all measured frequencies. C. Group averaged maps of whole-cortex delta (left) power in young animals (top row) and aged animals (middle row). The bottom row represents the difference between young and aged groups (young-aged) thresholded for significance. D. Same as C but in the infraslow band.
Fig. 4.
Fig. 4.. Aged Animals have Significantly Reduced Internetwork Connectivity using Seed Based Analysis
A1. Seed based analysis of functionally connected networks in the mouse cortex in the delta frequency band. Each map represents group average connectivity values for seeds placed in distinct regions (as labeled). The left column is young animals. The right column is older animals. A2. Connectivity correlation matrices for all seeds in young animals (top), aged animals (middle), and the difference between the two (young minus aged) (bottom). Asterisks are placed over cells in the matrix that represent a significant difference (p<0.05 with FDR correction). B1. Seed based analysis of functionally connected networks in the mouse cortex in the infraslow frequency band. Group average maps are shown similar to A. B2. Correlation matrices in the infraslow band similar to A.
Fig. 5.
Fig. 5.. Aged Animals have Significantly Reduced Homotopic Functional Connectivity
A. Group averaged maps of whole-cortex homotopic FC (correlation between each pixel and its mirror pixel) in the delta (1–4 Hz) frequency band. Top map is the average homotopic FC in young animals. The middle map is average homotopic FC in aged animals. The bottom map is difference between the average young and aged maps (young-aged) thresholded for significance. Since the maps were symmetric, the left side of the cortex is shown and the right side shows a map of approximate cortical networks based on the Paxinos atlas. B. Similar group average maps as A but in the infraslow band.
Fig. 6.
Fig. 6.. Aged Animals Have Significant Reduction in Global Node Degree
A. Group average map of global (whole cortex) node degree in the delta frequency range (1–4 Hz) for young (top) and aged (middle) animals. The bottom map represents the difference between young and aged animals in global node degree thresholded for significance. B. Group average map of global (whole cortex) node degree in the infraslow frequency range (0.01–0.2 Hz) for young (top) and aged (middle) animals. The bottom map represents the difference between young and aged animals in global node degree thresholded for significance.
Fig. 7.
Fig. 7.. Summary of Connectivity Changes in Aged vs. Young Animals
A. Representative diagram of connectivity difference between young and aged animals (young minus aged) within the delta band. Spheres are at locations of seeds used in seed-based FC analysis. Sphere size correlates to the average change in node degree within the seed between young and aged mice (Young - Aged). Average node degree within the seeds was compared between young and aged animals using a student’s T test. Purple spheres represent significant differences in average node degree at that location (p<0.05). Lines between seeds represent significant differences in connectivity (z(R)) between young and aged groups. The thickness of the lines is proportional to magnitude of the correlation difference. Red lines represent age associated decreases in positive correlations and blue lines represent age-associated decreases in negative correlations. B Same as A, but in the infraslow band.
Fig. 8.
Fig. 8.. Exploratory Behavior in Young Animals Correlates with Cortical Delta Power and Delta Node Degree
A1. Young animals (n = 17) explored a clear glass container significantly more than aged animals (n = 18). A2. Grooming behavior was similar in aged and young animals. A3. Aged animals spent significantly more time immobile than young animals. B1. Whole-cortex power significantly correlated with the degree of wall exploration observed in young animals (n = 14) within the delta but not infraslow frequency band. B2. Whole-cortex power in aged animals (n = 11) did not correlate with exploration time in either the delta or infraslow frequency band. B3. Whole-cortex node degree correlated significantly (R2=0.43) with the degree of wall exploration within the delta but not infraslow frequency band in young animals (n = 13). Infraslow node degree did not correlate. B4. There was no correlation between delta or infraslow node degree and exploration in aged animals (n = 9).

References

    1. Salthouse TA, 1998. Independence of age-related influences on cognitive abilities across the life span. Dev. Psychol 34, 851–864. - PubMed
    1. Blazer DG, Yaffe K, Karlawish J, 2015. Cognitive aging: a report from the institute of medicine. JAMAJAMA 313, 2121–2122. - PubMed
    1. Shafto MA, Burke DM, Stamatakis EA, Tam PP, Tyler LK, 2007. On the tip-of-the–tongue: neural correlates of increased word-finding failures in normal aging. J. Cogn. Neurosci 19, 2060–2070. - PMC - PubMed
    1. de Bruin N, Bryant DC, MacLean JN, Gonzalez CL, 2016. Assessing visuospatial abilities in healthy aging: a novel visuomotor task. Front Aging Neurosci. 8, 7. - PMC - PubMed
    1. Bohannon RW, 1997. Comfortable and maximum walking speed of adults aged 20–79 years: reference values and determinants. Age Age. 26, 15–19. - PubMed

Publication types