. 2022 Jul 7;82(13):2519-2531.e6.
doi: 10.1016/j.molcel.2022.04.009. Epub 2022 Apr 29.

Systematic analysis of intrinsic enhancer-promoter compatibility in the mouse genome

Affiliations

Systematic analysis of intrinsic enhancer-promoter compatibility in the mouse genome

Miguel Martinez-Ara et al. Mol Cell. .

Abstract

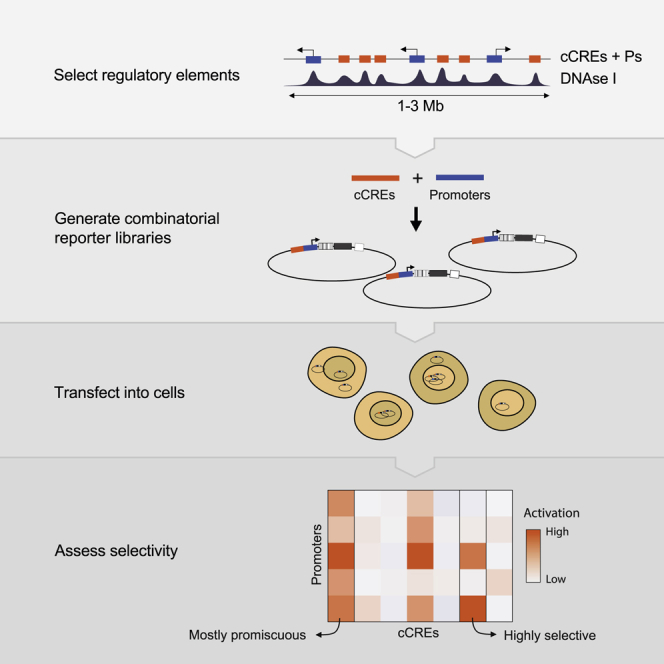
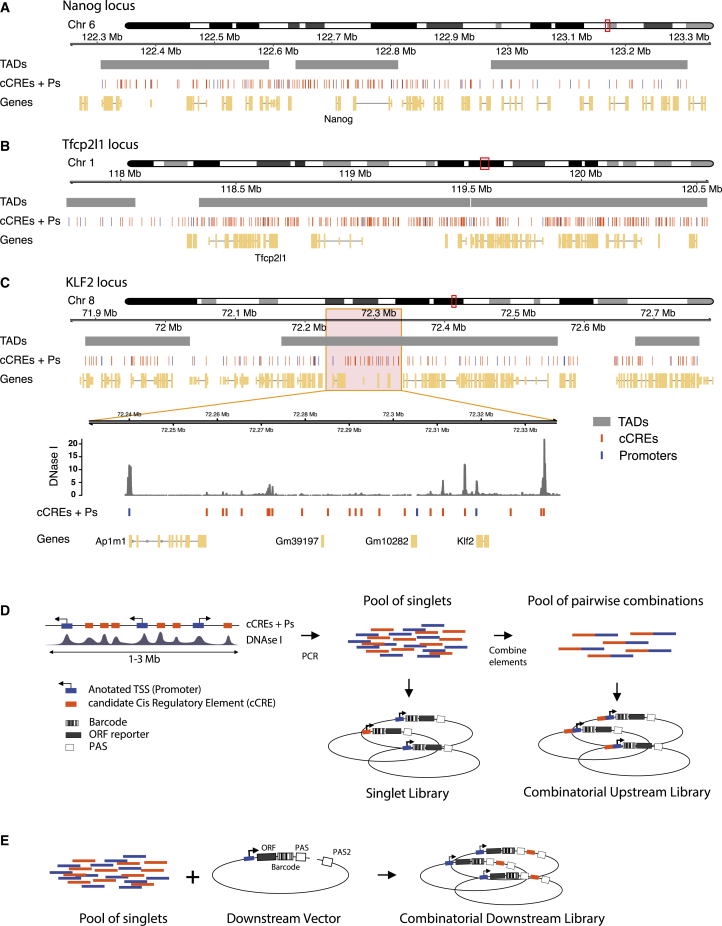
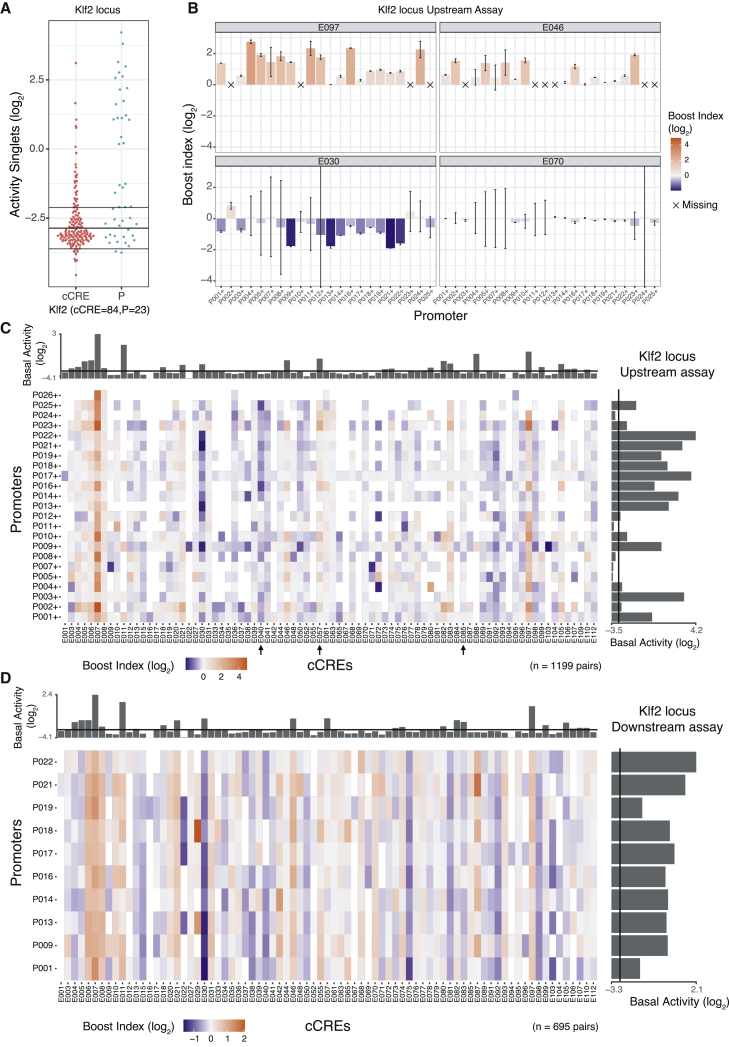
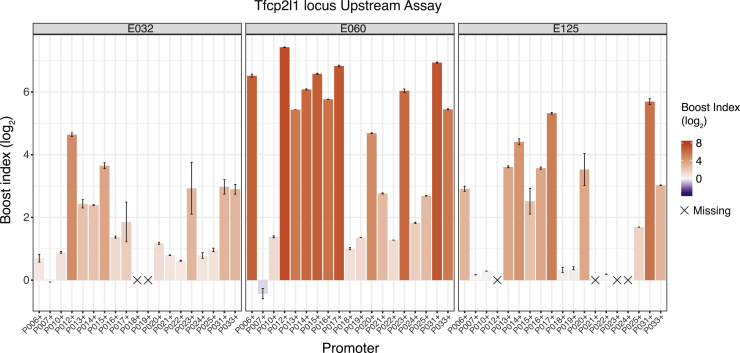
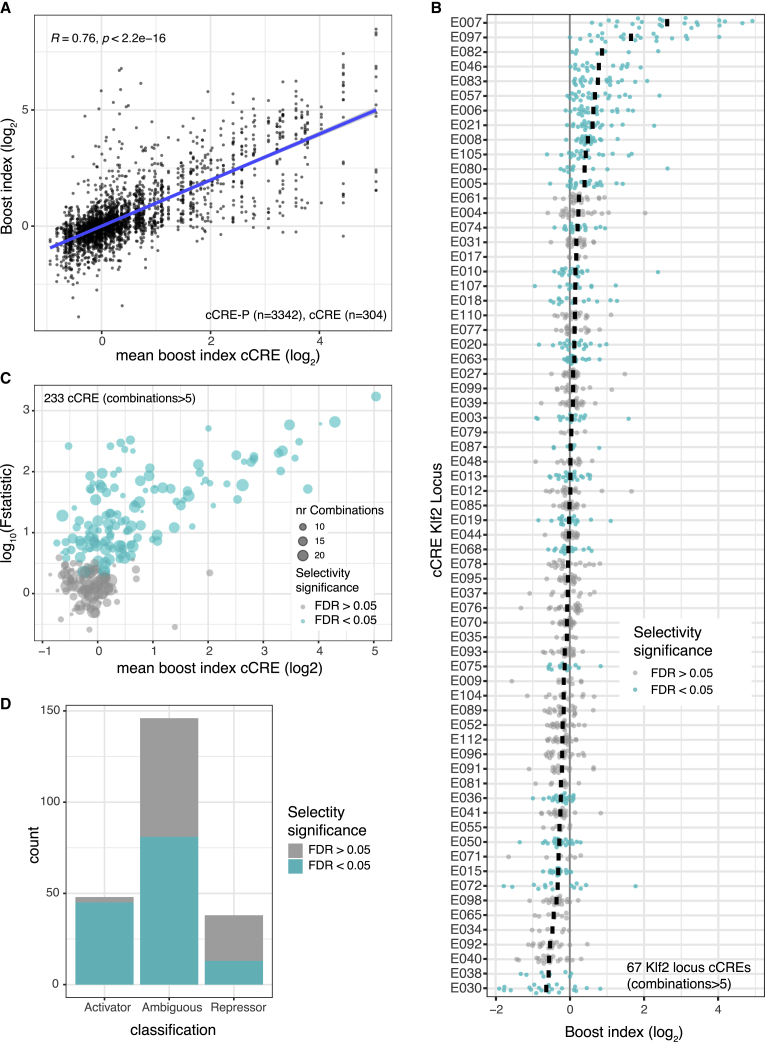
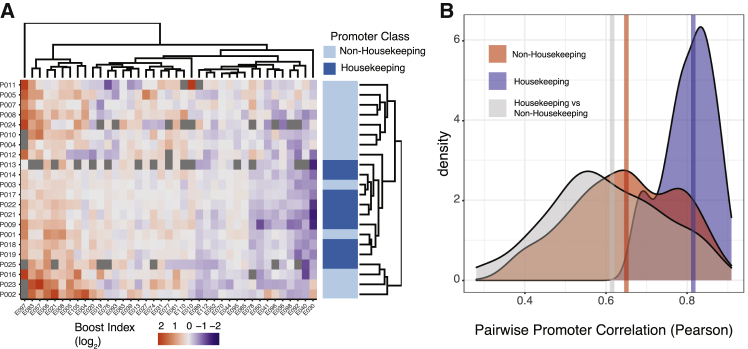
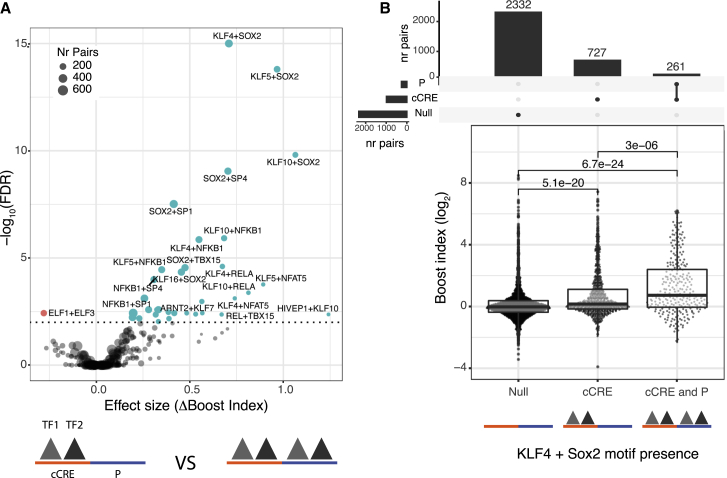
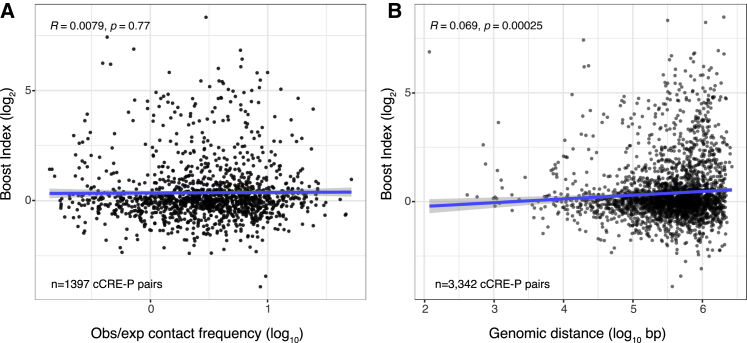
Gene expression is in part controlled by cis-regulatory elements (CREs) such as enhancers and repressive elements. Anecdotal evidence has indicated that a CRE and a promoter need to be biochemically compatible for promoter regulation to occur, but this compatibility has remained poorly characterized in mammalian cells. We used high-throughput combinatorial reporter assays to test thousands of CRE-promoter pairs from three Mb-sized genomic regions in mouse cells. This revealed that CREs vary substantially in their promoter compatibility, ranging from striking specificity to broad promiscuity. More than half of the tested CREs exhibit significant promoter selectivity. Housekeeping promoters tend to have similar CRE preferences, but other promoters exhibit a wide diversity of compatibilities. Higher-order transcription factors (TF) motif combinations may account for compatibility. CRE-promoter selectivity does not correlate with looping interactions in the native genomic context, suggesting that chromatin folding and compatibility are two orthogonal mechanisms that confer specificity to gene regulation.

Keywords: MPRA; cis-regulatory element; combinatorial; compatibility; enhancer; promoter; specificity; systematic; transcription.


Conflict of interest statement

Declaration of interests J.v.A. is founder of Gen-X B.V. and Annogen B.V. F.C. is a co-founder of enGene Statistics GmbH. B.v.S. is member of the advisory board of Molecular Cell.

Figures

None
Graphical abstract
Figure 1
Figure 1
Regulatory element selection and library construction (A–C) Representations of Nanog, Tfcp2l1, and Klf2 loci, respectively. In (C), the zoom-in displays a DNase I sensitivity track (Joshi et al., 2015) where peaks overlap with cCREs. (D) Cloning strategy for the Upstream assay. cCREs and promoters were amplified by PCR from genomic DNA and pooled. Fragments in this pool were then randomly ligated to generate duplets. Singlets and duplets were cloned into the same barcoded vector to generate two libraries per locus, a singlet library and a combinatorial library. (E) Cloning strategy for the Downstream assay. The singlet pool from the Klf2 locus was cloned into ten vectors, each of them carrying a different promoter. The resulting ten sub-libraries were combined into one Downstream assay library.
Figure 2
Figure 2
Singlet and combinatorial activities of cCREs and promoters from the Klf2 locus (A) Transcription activities of singlet cCREs and promoters. Each dot represents the mean activity of one singlet. Horizontal lines represent the average background activity of empty vectors (black line) plus or minus two standard deviations (gray lines). Elements with activities more than two standard deviations above the average background signal are defined as active. (B) Examples of Upstream assay cCRE-P combinations for cCREs E097, E046, E030, and E070 of the Klf2 locus. Bar plots represent the mean boost index of each combination, vertical lines represent the standard deviations. Crosses mark missing data. (C and D) Boost index matrices of cCRE-P combinations from the Klf2 locus according to Upstream (C) and Downstream (D) assays. White tiles indicate missing data. Bar plots on the right and top of each panel show basal activities of each tested P or cCRE, respectively, with the black line indicating the background activity of the empty vector. All data are averages of 3 independent biological replicates.
Figure 3
Figure 3
Examples of selective cCREs from the Tfcp2l1 locus Boost indices obtained in the Upstream assay are shown for cCRE-P combinations of cCREs E032, E060, E125, of the Tfcp2l1 locus. Bar plots indicate the mean boost index of each combination, vertical lines indicate standard deviations. All data are averages of 3 independent biological replicates.
Figure 4
Figure 4
Promoter selectivity of cCREs (A) Plot showing the broad diversity of boost indices of many cCREs. Data are from Upstream assays of Klf2, Nanog, and Tfcp2l1 loci combined. Vertical axis indicates boost indices of all tested cCRE-P pairs, which are horizontally ordered by the mean boost index of each cCRE. R is pearson correlation and p its corresponding p-value. (B) Boost index distributions for each cCRE from the Klf2 locus (Upstream assay). Each dot represents one cCRE-P combination; black bar represents the mean. Turquoise coloring marks cCREs that have a larger variance of their boost indices than may be expected based on experimental noise, according to the Welch F test after multiple hypothesis correction (5% FDR cutoff). (C) Summary of Welch F test selectivity analysis results for all cCREs from the three loci with more than 5 cCRE-P combinations. Each dot represents one cCRE; the size of the dots indicates the number of cCRE-P pairs. Significantly selective cCREs (5% FDR cutoff) are highlighted in turquoise. (D) Proportion of significantly selective (turquoise) cCRE in the three categories as shown in Figure S3A. All data are averages of 3 independent biological replicates.
Figure 5
Figure 5
Housekeeping promoters show a distinct pattern of cCRE compatibility (A) Hierarchical clustering of the Upstream assay boosting matrix of the Klf2 locus. In order to facilitate hierarchical clustering, the matrix has been restricted to almost complete cases (cCREs > 15 combinations). (B) Density plot of pairwise Pearson correlation coefficients of the boost indices of Klf2 locus promoters classified as either housekeeping or non-housekeeping (Hounkpe et al., 2021). Blue: correlations between all pairs of housekeeping promoters; red: all correlations between pairs of non-housekeeping promoters; gray: all correlations between one housekeeping and one non-housekeeping promoter. Vertical lines represent the median of each group. Unlike in (A), all promoters in the Upstream assay were included in this analysis. All data are averages of 3 independent biological replicates.
Figure 6
Figure 6
Association of TF motif duos with higher boost indices (A) Results of TF survey for self-compatible TF motif duos. TF motif duos associated with higher or lower boost indices at a 1% FDR cutoff are highlighted. (B) Association of Sox2 + Klf4 motifs at both cCRE and P with higher boost indices. cCRE-P combinations are split into 3 groups according to presence or absence of Sox2 + Klf4 motifs both at the cCRE and the promoter, or only the cCRE. Numbers at the top of horizontal brackets are the p values obtained from comparing the different groups boost index distributions using a Wilcoxon rank-sum test. Boxplots represent median and interquartile ranges. Bar plots at the top represent the number of combinations in each group.
Figure 7
Figure 7
Relationship between 3D organization and boost indices Absent or very weak correlation between boost indices and (A) contact frequencies according to micro-C (Hsieh et al., 2020) or (B) linear genomic distance, for all cCRE-P pairs from the three loci combined. All boost index data are averages of 3 independent biological replicates. R is pearson correlation and p its corresponding p-value.

Comment in

References

    1. Agrawal P., Blinka S., Pulakanti K., Reimer M.H., Jr., Stelloh C., Meyer A.E., Rao S. Genome editing demonstrates that the -5 kb Nanog enhancer regulates Nanog expression by modulating RNAPII initiation and/or recruitment. J. Biol. Chem. 2021;296:100189. - PMC - PubMed
    1. Akagi T., Kuure S., Uranishi K., Koide H., Costantini F., Yokota T. ETS-related transcription factors ETV4 and ETV5 are involved in proliferation and induction of differentiation-associated genes in embryonic stem (ES) cells. J. Biol. Chem. 2015;290:22460–22473. - PMC - PubMed
    1. Andersson R., Gebhard C., Miguel-Escalada I., Hoof I., Bornholdt J., Boyd M., Chen Y., Zhao X., Schmidl C., Suzuki T., et al. An atlas of active enhancers across human cell types and tissues. Nature. 2014;507:455–461. - PMC - PubMed
    1. Arnold C.D., Gerlach D., Stelzer C., Boryń Ł.M., Rath M., Stark A. Genome-wide quantitative enhancer activity maps identified by STARR-seq. Science. 2013;339:1074–1077. - PubMed
    1. Arnold C.D., Zabidi M.A., Pagani M., Rath M., Schernhuber K., Kazmar T., Stark A. Genome-wide assessment of sequence-intrinsic enhancer responsiveness at single-base-pair resolution. Nat. Biotechnol. 2017;35:136–144. - PMC - PubMed

Publication types

Substances