. 2022 Jul;607(7917):176-184.
doi: 10.1038/s41586-022-04877-w. Epub 2022 May 20.

Compatibility rules of human enhancer and promoter sequences

Affiliations

Compatibility rules of human enhancer and promoter sequences

Drew T Bergman et al. Nature. 2022 Jul.

Abstract

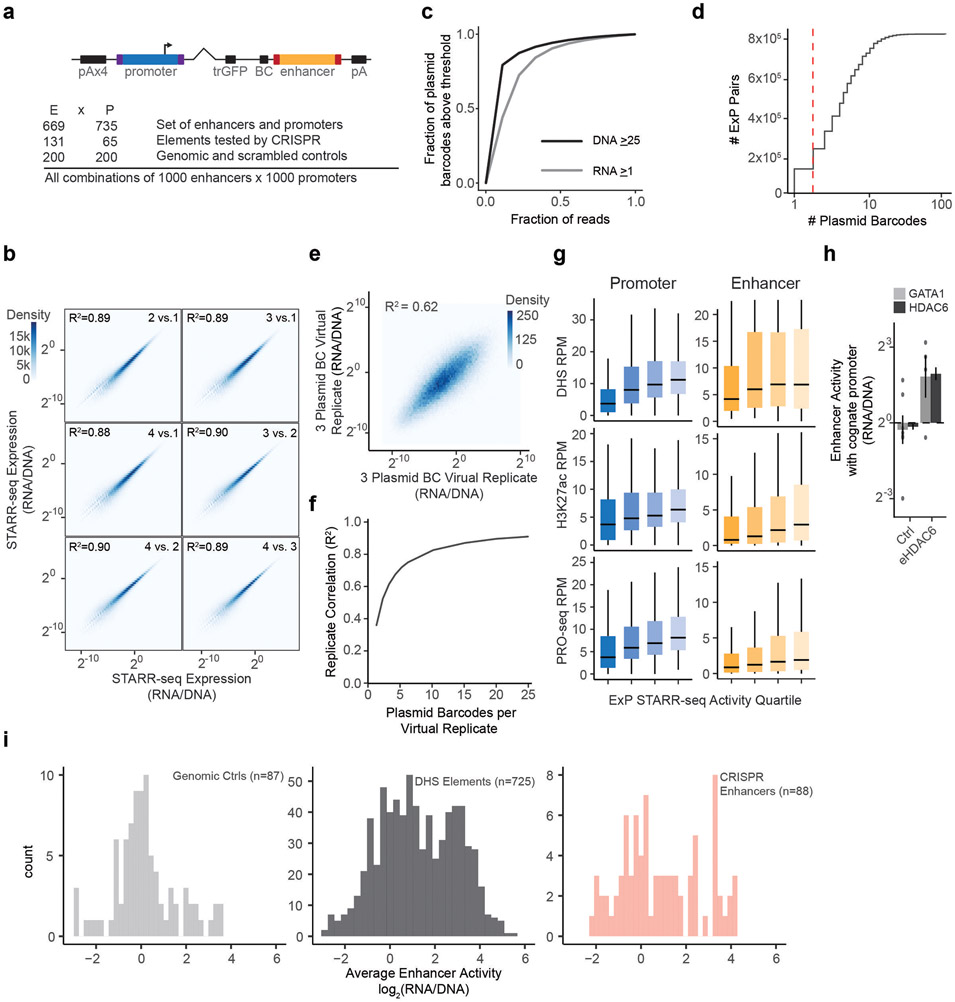
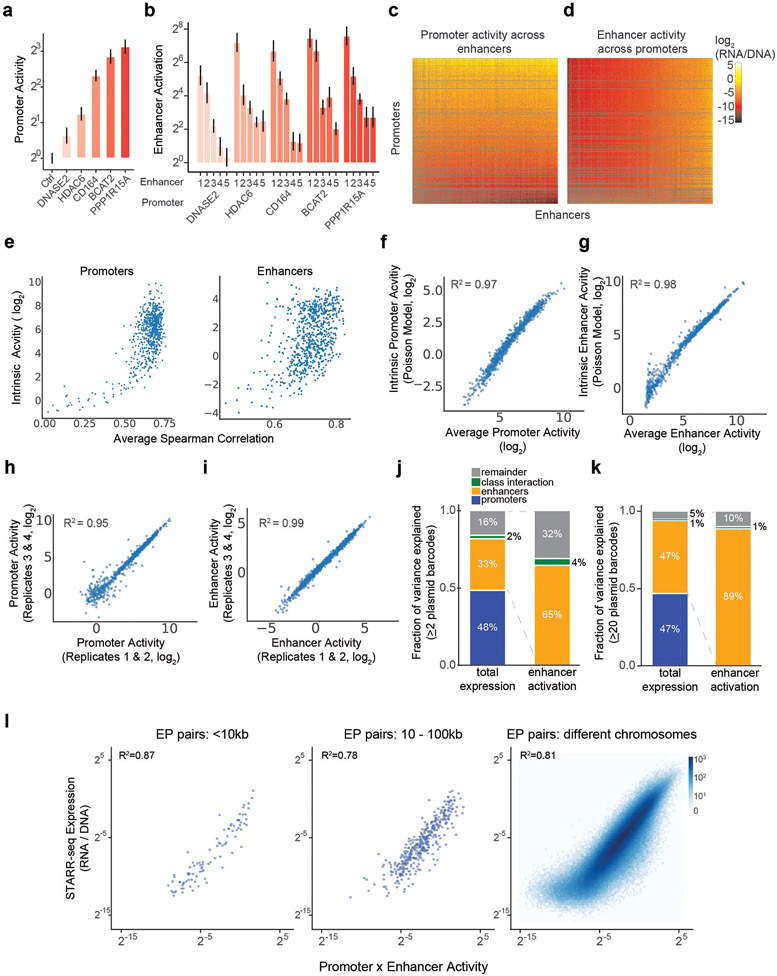
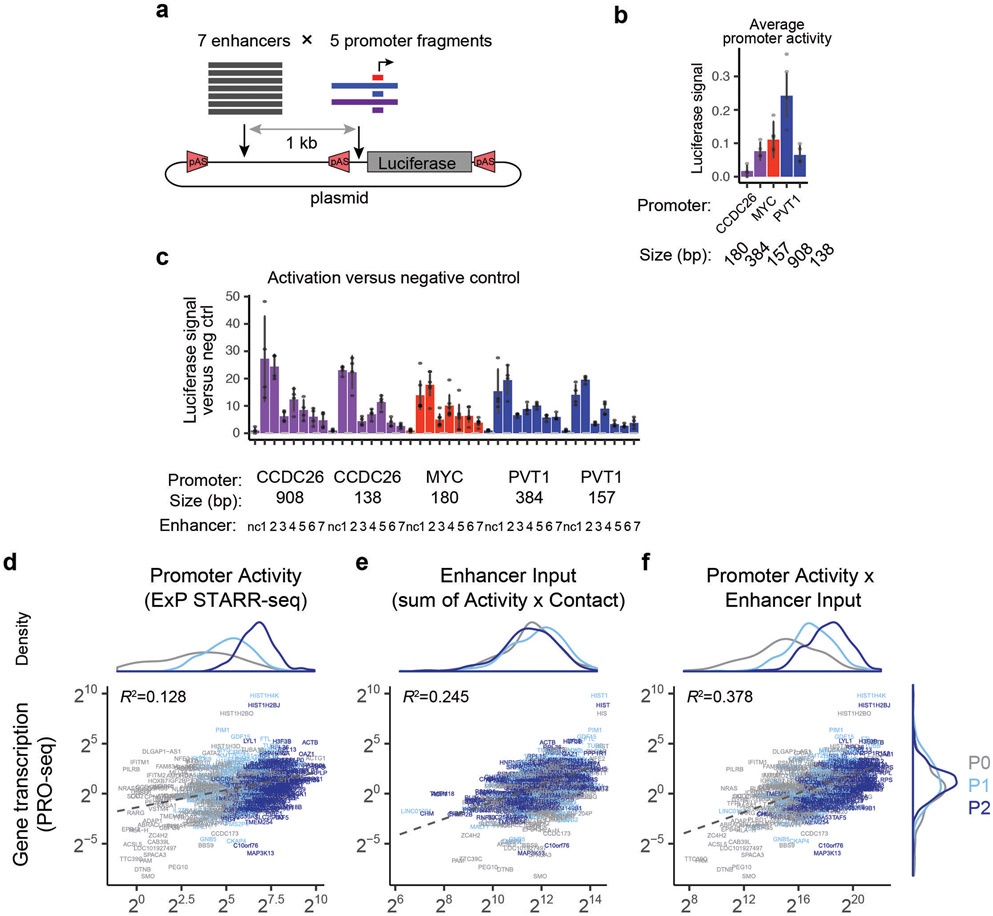
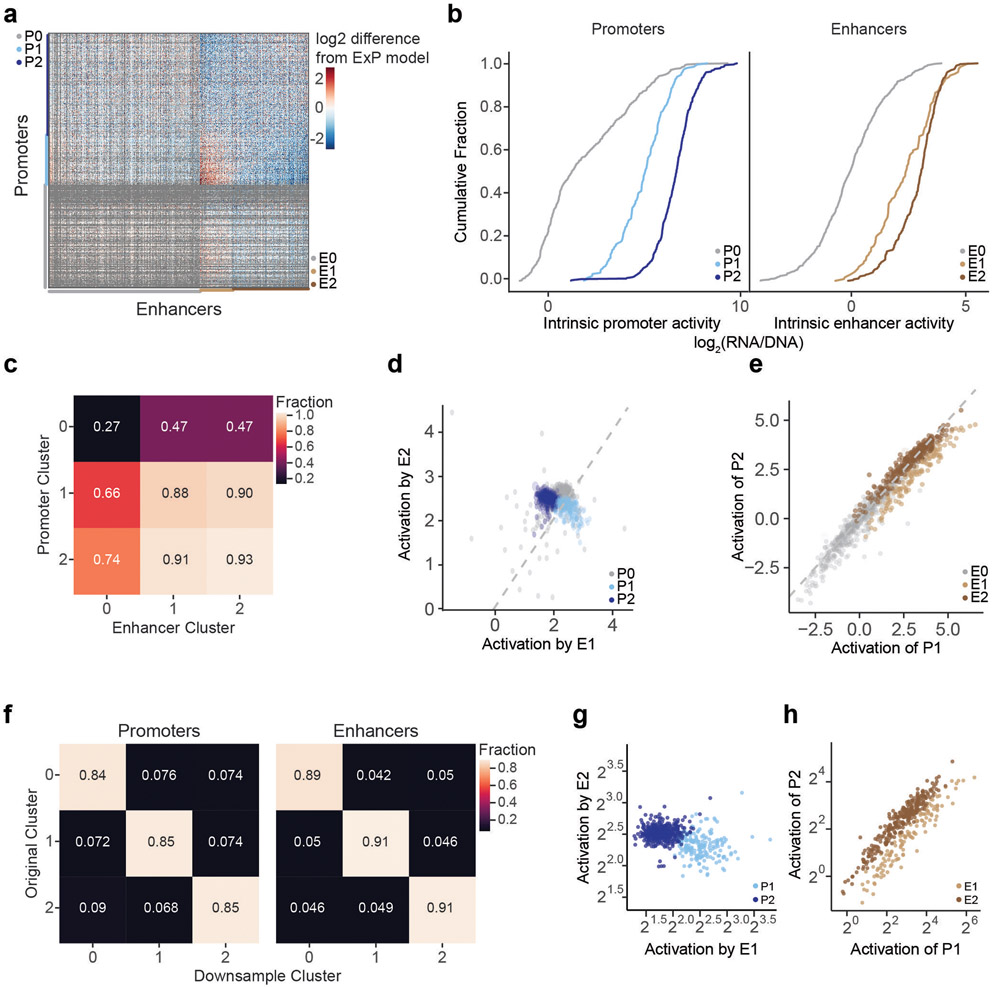
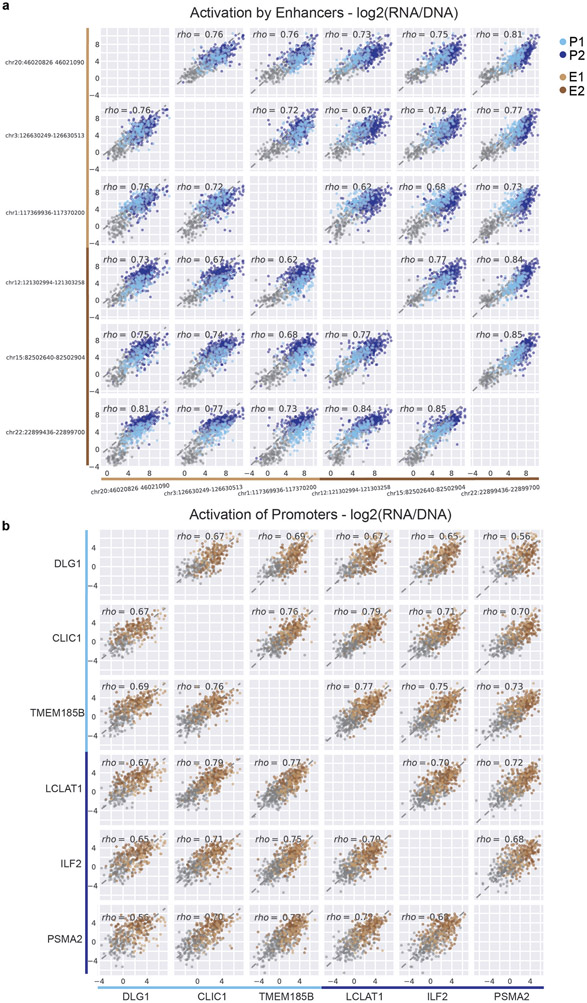
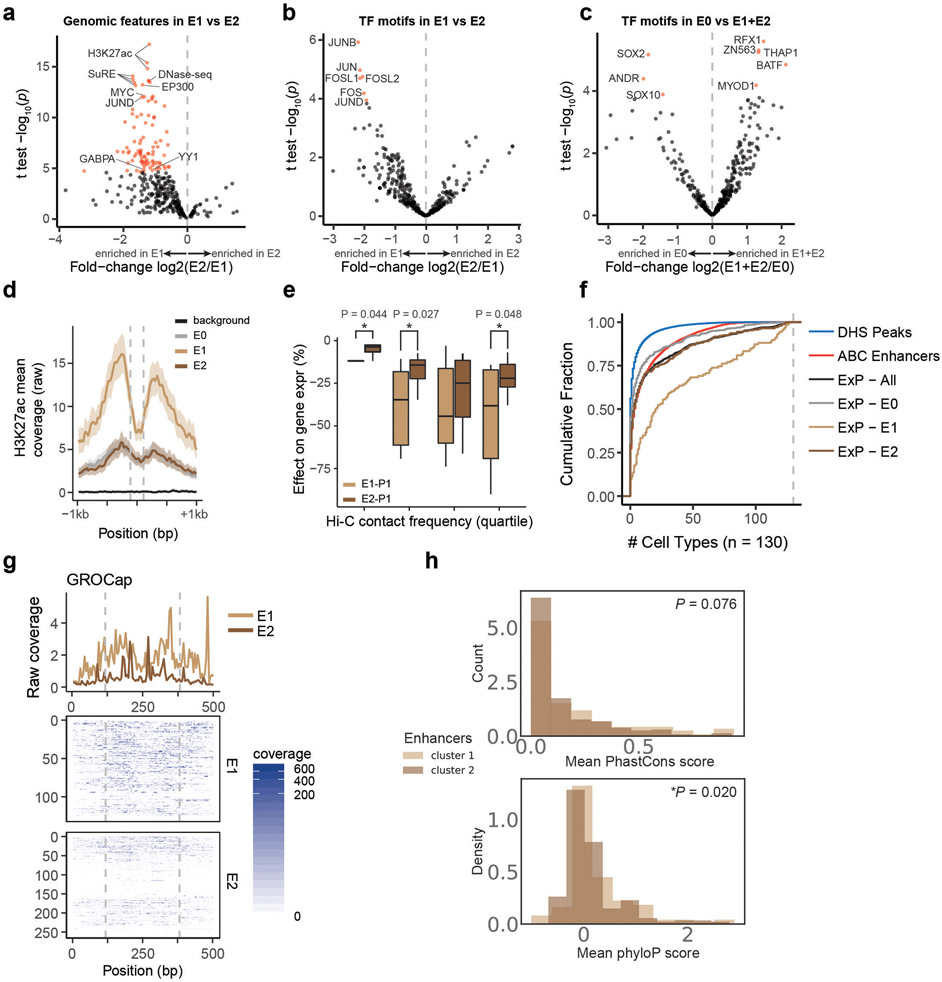
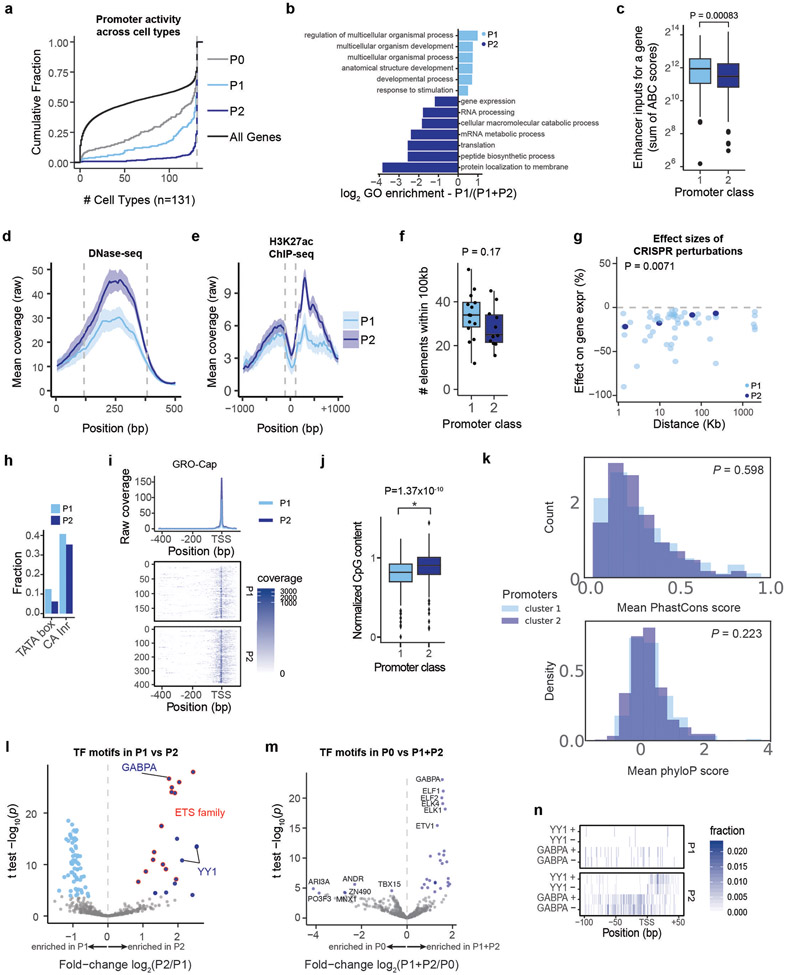
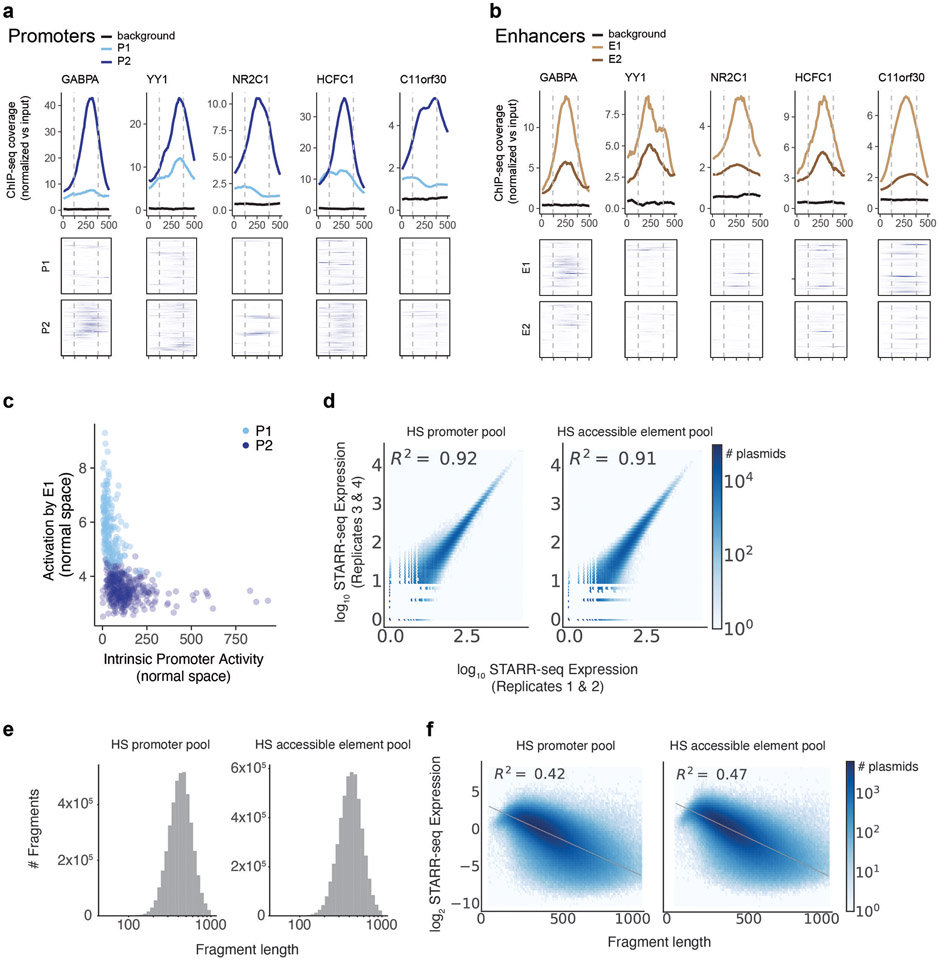
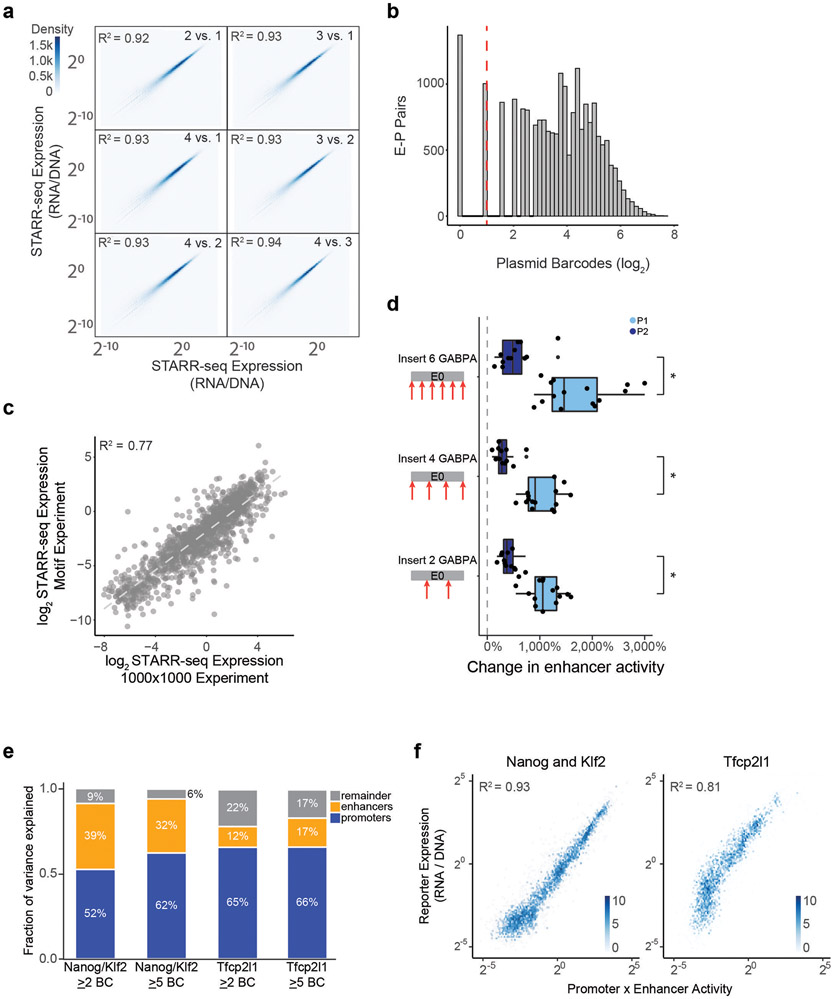
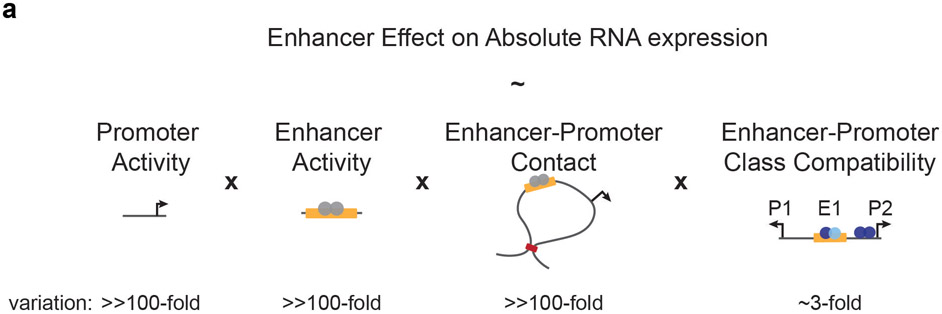
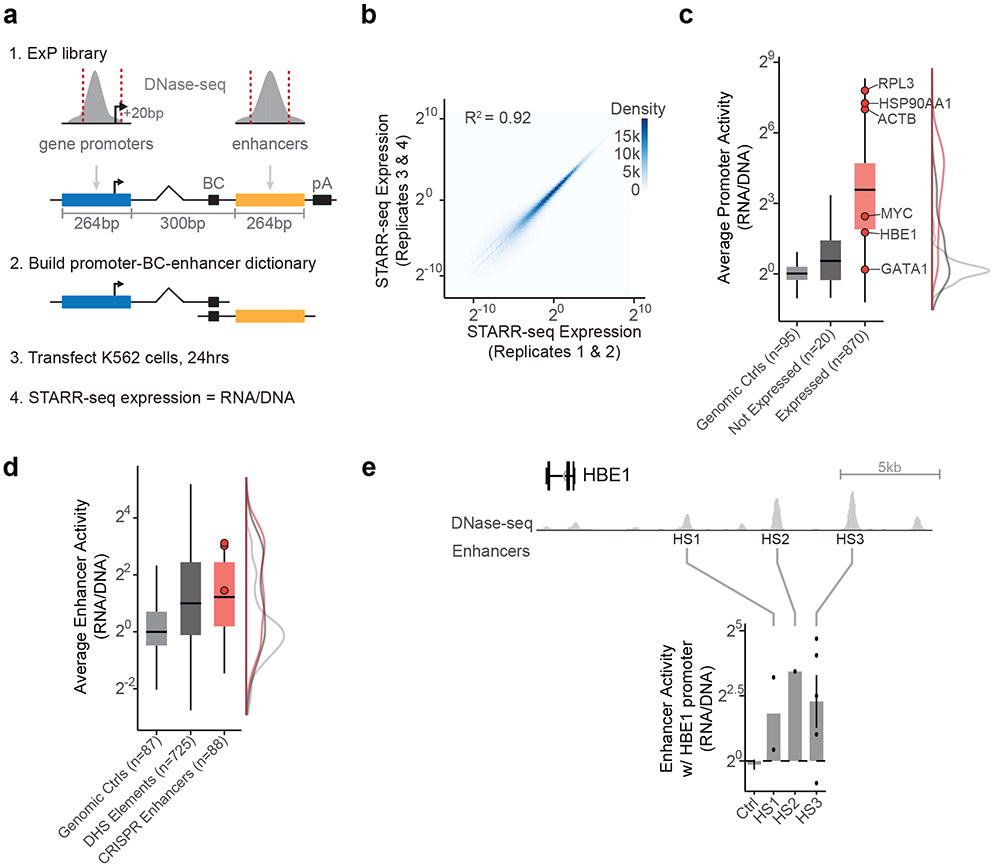
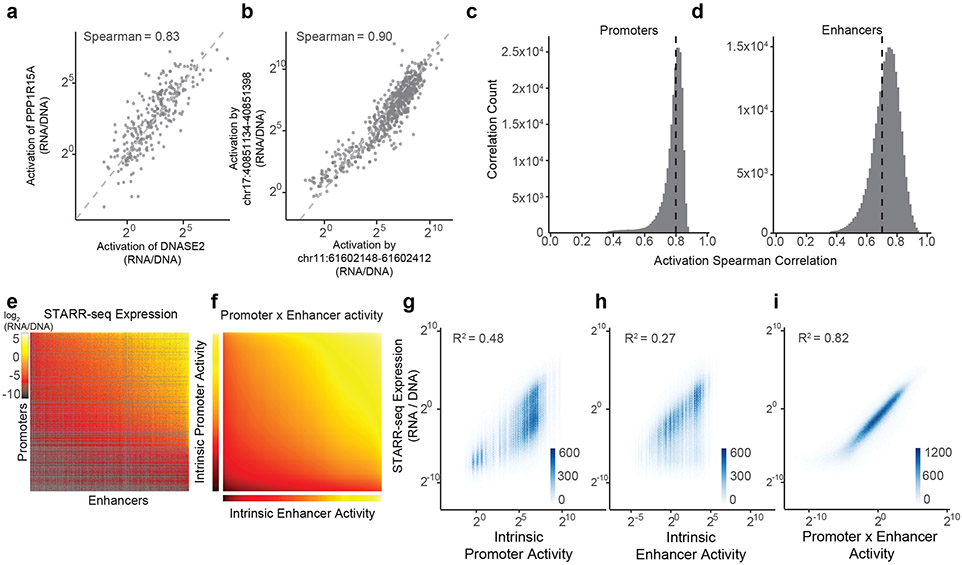
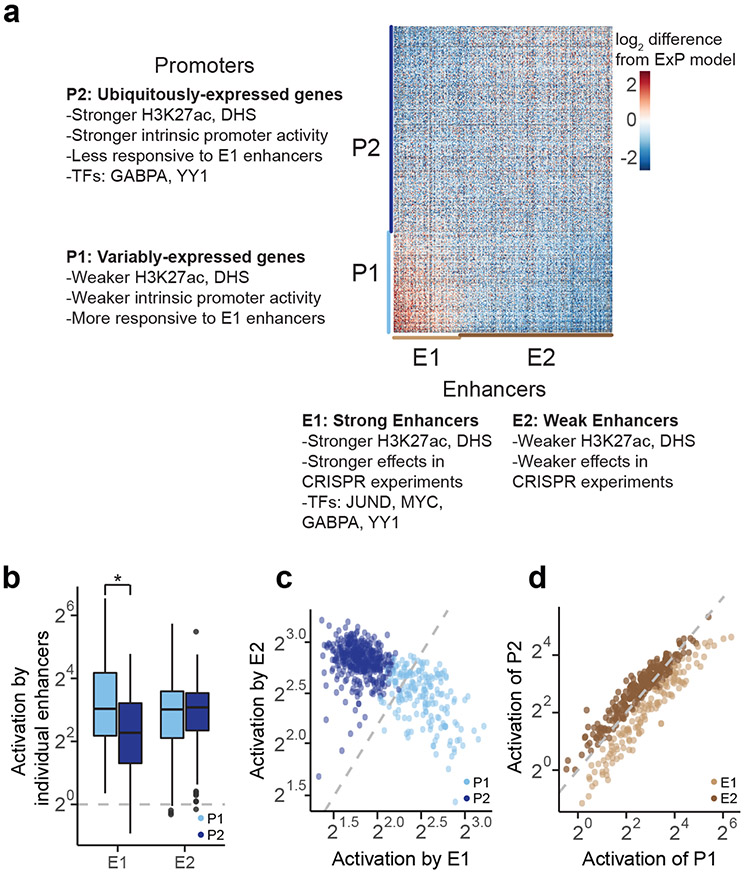
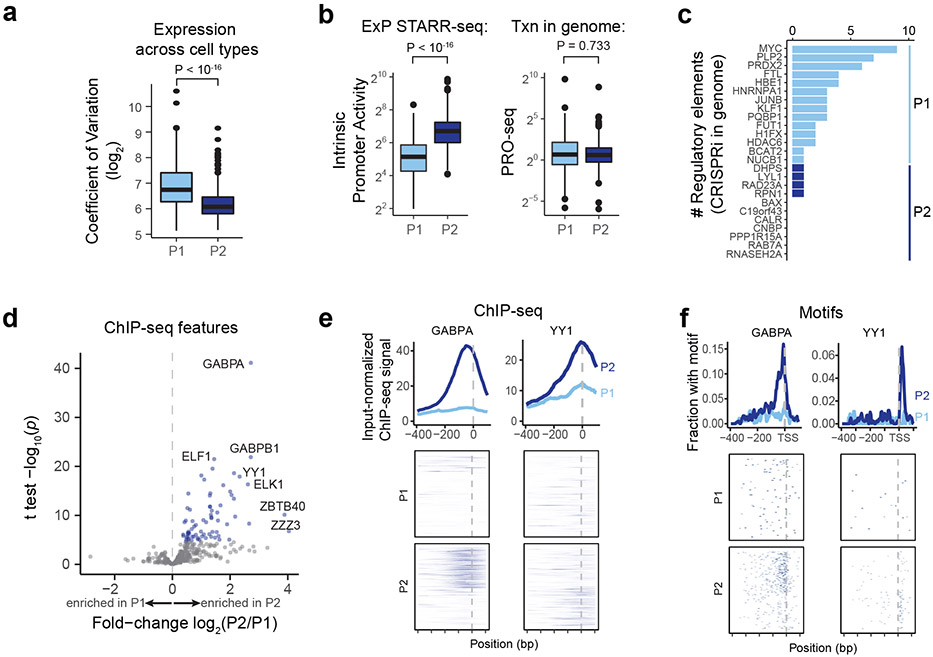
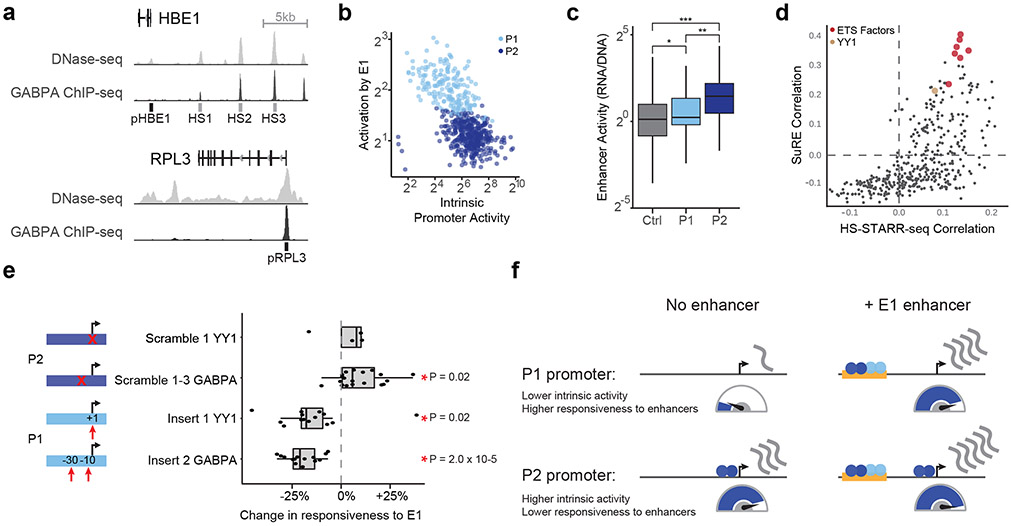
Gene regulation in the human genome is controlled by distal enhancers that activate specific nearby promoters1. A proposed model for this specificity is that promoters have sequence-encoded preferences for certain enhancers, for example, mediated by interacting sets of transcription factors or cofactors2. This 'biochemical compatibility' model has been supported by observations at individual human promoters and by genome-wide measurements in Drosophila3-9. However, the degree to which human enhancers and promoters are intrinsically compatible has not yet been systematically measured, and how their activities combine to control RNA expression remains unclear. Here we design a high-throughput reporter assay called enhancer × promoter self-transcribing active regulatory region sequencing (ExP STARR-seq) and applied it to examine the combinatorial compatibilities of 1,000 enhancer and 1,000 promoter sequences in human K562 cells. We identify simple rules for enhancer-promoter compatibility, whereby most enhancers activate all promoters by similar amounts, and intrinsic enhancer and promoter activities multiplicatively combine to determine RNA output (R2 = 0.82). In addition, two classes of enhancers and promoters show subtle preferential effects. Promoters of housekeeping genes contain built-in activating motifs for factors such as GABPA and YY1, which decrease the responsiveness of promoters to distal enhancers. Promoters of variably expressed genes lack these motifs and show stronger responsiveness to enhancers. Together, this systematic assessment of enhancer-promoter compatibility suggests a multiplicative model tuned by enhancer and promoter class to control gene transcription in the human genome.


Figures

Extended Data Fig. 1.
Extended Data Fig. 1.. Design and reproducibility of ExP STARR-seq
a. ExP STARR-seq reporter construct (pA = polyadenylation signal; purple = promoter sequencing adaptors; angled = spliced sequence; trGFP = truncated GFP open reading frame with start and stop codon; BC = 16bp N-mer plasmid barcode; red = enhancer sequencing adaptors) and 1000x1000 K562 library contents. b. Correlation of ExP STARR-seq expression between biological replicate experiments, calculated for individual enhancer-promoter pairs with unique plasmid barcodes. Axes represent the average STARR-seq expression (RNA/DNA) of individual biological replicates. Density: number of enhancer-promoter plasmids. c. Fraction of remaining enhancer-promoter plasmids passing DNA (≥25) and RNA (≥1) threshold (y-axis) with downsampling of sequencing reads (x-axis). d. Distribution of plasmid barcodes per enhancer-promoter pair, red dotted-line is threshold of two plasmid barcodes. e. Correlation between virtual replicates, formed by sampling two nonoverlapping groups of three plasmid barcodes from pairs with at least 6 barcodes, and averaging log2(RNA/DNA) within groups. f. Correlation between virtual replicates as in (c) for increasing numbers of plasmid barcodes per pair in virtual replicates. g. DNase-seq, H3K27ac ChIP-seq, and PRO-seq (RPM) by increasing quartile of autonomous promoter activity and average enhancer activity in ExP STARR-seq (n = 800). Box: median and interquartile range (IQR). Whiskers: +/− 1.5 x IQR. h. Activation in ExP STARR-seq (expression versus genomic controls in distal position) of GATA1 and HDAC6 promoters by eHDAC6 (chrX:48641342-48641606). Ctrl = activity of promoters with random genomic controls in enhancer position. Error bars: 95% CI across plasmid barcodes. n = 7 (GATA1-ctrl), 381 (HDAC6-ctrl), 4 (eHDAC6-GATA1), 37 (eHDAC6-HDAC6). i. Average enhancer activity (STARR-seq expression of plasmids containing a given enhancer averaged across all promoters) of enhancer sequences derived from random genomic controls (n=87), accessible elements (n=725), and genomic enhancers validated in CRISPR experiments (n=89).
Extended Data Fig. 2.
Extended Data Fig. 2.. Comparison of methods of estimating enhancer and promoter activities and the multiplicative model
a. Intrinsic promoter activity (expression versus random genomic controls in enhancer position) of five selected promoters. Error bars: 95% CI across plasmid barcodes (n=54-79). Promoter classes (see Methods): DNASE2 (P1), HDAC6 (P1), CD164 (P1), BCAT2 (P1), PPP1R15A (P2). b. Activation (expression versus random genomic controls in enhancer position) of 5 selected promoters by 5 selected enhancers: 1 = chr11:61602148-61602412 (E1), 2 = chr19:49467061-49467325 (E1), 3 = chrX:48641342-48641606 (E1), 4 = chr19:12893216-12893480 (E2), 5 = chr17:40851134-40851398 (E1). Error bars: 95% CI across plasmid barcodes (n=12-56). c-d. Heatmap of promoter activity (a, expression divided by intrinsic enhancer activity) or enhancer activity (b, expression divided by intrinsic promoter activity) across all pairs of promoter (vertical) and enhancer sequences (horizontal). Axes are sorted by intrinsic promoter and enhancer activities, as in Fig. 2j. Grey: missing data. e. Intrinsic promoter and enhancer activity (y-axis, estimated by a Poisson count model) versus average pairwise Spearman correlation (as in Fig. 2c-d). f-g. Correlation between two estimates of promoter (c) and enhancer (d) activities. One method (“average activity”, x-axis) estimates activity calculated by averaging across elements, and the other method (“intrinsic activity”, y-axis) estimates activity by using coefficients estimated by a Poisson count model (see Methods). h-i. Correlation of intrinsic promoter (e) and enhancer (f) activity estimates from Poisson model using data from separate replicate experiments. j-k. Fraction of variance explained by promoter activity, enhancer activity, class interaction from the perspective of expression (STARR-seq score) and enhancer activation (fold-activation of an enhancer on a promoter, normalizing out promoter strength) limited to pairs with 2 or more (c) or 20 or more (d) plasmid barcodes. Plot includes pairs with P0 promoters and E0 enhancers. Bar plots show sequential sum of squares (Type-I ANOVA). l. Correlation of the multiplicative enhancer x promoter model with STARR-seq expression comparing enhancer-promoter pairs located within 10kb, 100kb, and pairs located on different chromosomes.
Extended Data Fig. 3.
Extended Data Fig. 3.. Validation of enhancer-promoter multiplication via luciferase assays and modeling gene transcription as a function of intrinsic promoter activity and enhancer inputs
a. ExP luciferase reporter construct. Seven enhancer fragments, with flanking polyadenylation signals, were cloned upstream of five promoter fragments and measured via the dual luciferase assay. b. Autonomous promoter activity of ExP luciferase (average luciferase signal of promoter with negative control) for 5 promoter sequences derived from 3 genes (MYC, PVT1, CCDC26). Error bars are 95% CI from 6 (MYC) or 4 (all other promoters) biological replicates. c. Enhancer activation (luciferase signal versus negative control sequence in the enhancer position) of seven enhancers across five promoter fragments. Error bars are 95% CI from 6 (MYC) or 4 (all other promoters) biological replicates. d-f. Gene transcription (y-axis): PRO-seq read counts in the gene body. a. Promoter Activity (x-axis, left): Intrinsic promoter activity, as measured by ExP STARR-seq. b. Enhancer Input (x-axis, center): enhancer activity (based on measurements of H3K27ac and DHS in the genome) multiplied by enhancer-promoter contact (based on Hi-C measurements), summed across all putative enhancers (DHS peaks) within 5 Mb of the gene promoter (excluding the promoter’s own peak), weighted by HiC contact as in the ABC Model. c. Promoter Activity x Enhancer Input (x-axis, right). Labels: gene symbols for 741 promoters with sequence activity estimates from ExP STARR-seq and enhancer input estimates from ABC. Dotted lines: Line of best fit from linear regression in log2 space.
Extended Data Fig. 4.
Extended Data Fig. 4.. Enhancer and promoter cluster identification and reproducibility
a. Heatmap of deviations in enhancer-promoter STARR-seq expression from a multiplicative enhancer-promoter model (color scale: fold-difference between observed expression versus expression predicted by multiplicative model; gray: missing data). Same as Fig 3a, except including clusters with weak sequences and missing data (E0 and P0). Vertical axis: promoter sequences grouped by class and sorted by responsiveness to E1 vs. E2; horizontal axis: enhancer sequences grouped by class and sorted by activation of P1 vs. P2. b. Distribution of intrinsic enhancer and promoter activity (expression versus genomic controls) by cluster. c. Fraction of enhancer-promoter pairs observed in ExP STARR-seq dataset (>= 2 plasmid barcodes) by cluster. d. Correlation of average promoter activation (expression versus genomic controls in enhancer position) by E2 versus E1 enhancer sequences. Each point is one promoter sequence. Same as Fig. 3c, except including P0 promoter sequences. e. Correlation of average activation of P2 versus P1 promoters. Each point is one enhancer sequence. Same as Fig. 3d, except including E0 enhancer sequences. f. Robustness of enhancer and promoter cluster assignments to downsampling of enhancer and promoter sequences. Clustering was repeated in 100 random downsamplings to 25% of promoter sequences and 25% of enhancer sequences (6.25% of original matrix). Heatmap: Average fraction overlap between cluster assignments from the full and downsampled matrices. g. Correlation of average promoter activation (expression versus genomic controls in enhancer position) by E2 versus E1 enhancer sequences using ‘average activity’ instead of model estimates. Each point is one promoter sequence. h. Correlation of average activation of P2 versus P1 promoters using ‘average activity’ instead of model estimates. Each point is one enhancer sequence.
Extended Data Fig. 5.
Extended Data Fig. 5.. Classes of enhancer and promoter sequences show distinct patterns of activation and responsiveness
a. For 6 representative enhancer sequences (3 E1 and 3 E2 sequences), the pairwise correlation of promoter activation (expression versus genomic controls in promoter position, averaged across plasmid barcodes). Each point is one promoter sequence. b. For 6 representative promoter sequences (3 P2 and 3 P1 sequences), the pairwise correlation of activation by enhancers (expression versus genomic controls in enhancer position, averaged across plasmid barcodes). Each point is one enhancer sequence.
Extended Data Fig. 6.
Extended Data Fig. 6.. Classes of enhancer sequences correspond to strong and weak genomic enhancers
a. Volcano plot comparing ChIP-seq and other genomic features for E2 versus E1 enhancer sequences (see Supplementary Table 4). X-axis: ratio of average signal at P2 versus P1 promoters. Red dots: features with significantly higher signal at E1; no features have significantly higher signal at E2 enhancer sequences. b. Volcano plot comparing transcription factor motifs for E1 versus E2 enhancer sequences (see Supplementary Table 5). X-axis: ratio of average motif counts in E1 and E2 enhancer sequences. Red dots: Motifs significantly more frequent in E1 vs. E2 sequences. c. Volcano plot comparing transcription factor motifs for E1 and E2 versus E0 enhancer sequences (see Supplementary Table 5). X-axis: ratio of average motif counts in E1 and E2 versus E0 sequences. Red dots: Motifs significantly more frequent in E1 and E2 versus E0 sequences (>0) or more frequent in E0 versus E1 and E2 (<0). d. Mean H3K27ac ChIP-seq coverage of genomic elements corresponding to E0, E1, E2, or genomic control enhancer sequences (+/− 95% CI), aligned by DHS peak summit. Dotted lines mark bounds of the enhancer sequences used in ExP STARR-seq. E0 and E2 distributions are overlapping. e. % effect of genomic elements corresponding to E1 vs. E2 enhancer sequences on expression of genes corresponding to P1 promoters in CRISPRi screens, separated by quartiles of 3D contact frequency measured by Hi-C (0.39-11.9 (n=9), 11.9-23.9 (n=31), 23.9-58.3 (36), 58.3-100(n=34)). *P < 0.05, two-sample, two-sided t-test. Boxes are median and interquartile range, whiskers are +/− 1.5*IQR. f. Cumulative density plot showing the cell-type specificity of enhancer sequences selected for ExP STARR-seq, and DNase peaks or ABC enhancers in K562 cells. X-axis: # of cell types other than K562 in which the element is predicted to be an ABC enhancer. g. GRO-Cap coverage of genomic enhancers used in ExP STARR-seq. Top: Mean coverage of enhancers corresponding to E1 vs. E2 classes. Bottom: Coverage across all individual enhancers. h. Evolutionary conservation of enhancers separated by enhancer class, as measured by mean phastcon score (probability of each nucleotide belonging to a conserved element) and mean phyloP score (-log(p-value) under a null hypothesis of neutral evolution) across each element. P-value from KS test.
Extended Data Fig. 7.
Extended Data Fig. 7.. Properties of promoter classes
a. Cumulative density plot showing the cell-type specificity of promoter chromatin activity (of promoters selected for ExP STARR-seq). X-axis: # of biosamples (cell types or tissues) other than K562 in which the promoter is active. Active = Top 50% of promoters by activity (geometric mean of H3K27ac and DHS signals, as used in the ABC model). All genes = all genes in the genome. b. Gene ontology log2-enrichment for P1 promoters using P1 and P2 promoters as a background set. c. Predicted enhancer inputs for each gene (sum of ABC scores for all candidate enhancers within 5 Mb of the TSS, excluding the promoter of the gene itself) for genes in the genome corresponding to P1 versus P2 promoters. P = 0.00083, Mann-Whitney U test. Boxes are median and interquartile range, whiskers are +/− 1.5*IQR. d. DNase-seq signal in K562 cells at P1 and P2 promoters in the genome, aligned by boundaries of the 264-bp ExP STARR-seq promoter sequence (dotted gray lines, see Methods). e. H3K27ac ChIP-seq signal in K562 cells at P1 and P2 promoters in the genome, aligned by boundaries of the 264-bp ExP STARR-seq promoter sequence (dotted grey lines, see Methods). f. Number of nearby accessible elements (within 100 Kb of the gene promoter, considering top 150,000 DNase peaks in K562 cells as used in the ABC model) for the 14 genes corresponding to P1 promoters and 11 genes corresponding to P2 promoters with comprehensive CRISPR tiling data. P = 0.17, Mann-Whitney U test. Boxes are median and interquartile range, whiskers are +/− 1.5*IQR. g. % Effect of CRISPRi perturbations to genomic regulatory elements on genes corresponding to P1 vs. P2 promoters. P = 0.0071, t-test. h. Fraction of promoter sequences containing TATA or CA initiator core promoter motifs. i. GRO-Cap coverage of genomic promoters aligned by TSS. Top: Mean coverage of genomic promoters corresponding to P1 vs. P2 classes. Bottom: Coverage across all individual promoters. j. Normalized CpG-content of P1 and P2 promoter sequences (n = 800), calculated as the ratio of observed to expected CpG = (CpG fraction) / ((GC content)2 / 2). Boxes are median and interquartile range, whiskers are +/− 1.5*IQR, P = 1.37*10−10, t-test. k. Evolutionary conservation of promoters separated by promoter class, as measured by mean phastcon score (probability of each nucleotide belonging to a conserved element) and mean phyloP score (−log(p-value) under a null hypothesis of neutral evolution) across each element. P-value from KS test. l. Volcano plot comparing frequency of transcription factor motifs in P2 versus P1 promoter sequences (see Supplementary Table 7). X-axis: ratio of average motif counts in P2 versus P1 promoter sequences. Light blue and dark blue dots: Motifs significantly more frequent in P1 or P2 promoter sequences, respectively. Red outline: significant motifs for ETS family TFs. m. Volcano plot comparing frequency of transcription factor motifs in P2 and P1 versus P0 promoter sequences (see Supplementary Table 7). X-axis: ratio of average motif counts in P2 and P1 versus P0 promoter sequences. Dark blue dots: Motifs significantly more frequent in P2 and P1 vs. P0 promoter sequences. n. Fraction of P2 promoter sequences with YY1 and GABPA binding motifs by nucleotide position, aligned by TSS and separated by strand (see Methods).
Extended Data Fig. 8.
Extended Data Fig. 8.. Transcription factors enriched at promoters and enhancers and hybrid-selection STARR-seq in K562 cells
a. ChIP-seq signal for 5 transcription factors in K562 cells at P1 and P2 promoters in the genome, aligned by boundaries of the 264-bp ExP STARR-seq promoter sequence (see Methods). Top: average ChIP-seq signal normalized to input. Bottom: signal at individual genomic promoters. Black line: average for random genomic control sequences. b. ChIP-seq signal at E1 and E2 enhancers in the genome. Black line: average for random genomic control sequences. c. Correlation between intrinsic promoter activity and responsiveness of promoters to E1 enhancers (average activation by E1 sequences, expressions vs. random genomic controls). Each point is one promoter. Same as Fig. 5b, but in normal scale instead of log2 scale. d. Correlation of HS-STARR-seq expression between biological replicate experiments for promoter and accessible element pools, calculated for individual elements with unique plasmid barcodes. Axes represent the average STARR-seq expression (RNA/DNA, log10 scale) of two biological replicates. Density: number of plasmids. e. Fragment length distribution in HS-STARR-seq in promoter and accessible element pools, of fragments with at least 25 DNA counts. f. STARR-seq expression (y-axis) and fragment length (x-axis) relationship in HS-STARR-seq. Density: number of plasmids.
Extended Data Fig. 9.
Extended Data Fig. 9.. Motif insertion and scramble ExP STARR-seq in K562 cells and generalizability of compatibility rules
a. Correlation of ExP STARR-seq expression between biological replicate experiments, calculated for individual enhancer-promoter pairs with unique plasmid barcodes. Axes represent the average STARR-seq expression (RNA/DNA) of individual biological replicates. Density: number of enhancer-promoter plasmids. b. Distribution of plasmid barcodes per enhancer-promoter pair. Red dotted-line: threshold of two plasmid barcodes. c. STARR-seq expression in smaller-scale validation experiment (y-axis) vs. expression in the original ExP STARR-seq dataset (x-axis) for each enhancer-promoter pair included in both experiments. Dotted gray line: line of best fit from linear regression in log2 space. d. Change in enhancer activity with P1 or P2 promoters (edited enhancer activity compared with unedited enhancer activity with a promoter) after inserting 2, 4, or 6 GABPA motifs into 1 E0 enhancer sequence. Each point represents one enhancer-promoter pair measured over 4 biological replicates. *P < 0.0001, two-tailed t-test. Boxes are median and interquartile range, whiskers are +/− 1.5*IQR. e. Fraction of variance explained by intrinsic promoter activity and enhancer activity with respect to log2 reporter expression (reporter assay score) from Martinez-Ara et al. 2021. Left bars: experiment including promoters and enhancers from the Nanog and Klf2 loci. Right bars: experiment including promoters and enhancers from the Tfcp2l1 locus. For each experiment, values are shown for pairs with 2 or more, or 5 or more plasmid barcodes. Enhancer and promoter activities explain more of the variance when considering enhancer-promoter pairs with at least 5 vs. at least 2 barcodes. Bar plots show sequential sum of squares (Type-I ANOVA) for promoters, then enhancers. f. Correlation of reporter assay expression with the product of intrinsic promoter and enhancer activities from two experiments from Martinez-Ara et al., 2021. Density color scale: number enhancer-promoter pairs.
Extended Data Fig. 10.
Extended Data Fig. 10.. Model of the effect of an enhancer on RNA expression
a. Simple rules of enhancer and promoter compatibility. The effects of enhancers on nearby genes in the human genome are controlled by the quantitative tuning of intrinsic promoter activity, intrinsic enhancer activity, enhancer-promoter 3D contact, and enhancer-promoter class compatibility.
Fig. 1.
Fig. 1.. Enhancer x Promoter STARR-seq
a. ExP STARR-seq method for measuring the activities of enhancer and promoter sequences and testing their compatibilities. 264-bp sequences are selected and cloned in all pairwise combinations into the promoter and enhancer positions of a plasmid vector, together with a plasmid barcode (BC). We build a dictionary linking promoter-BC-enhancer triplets via sequencing (see Extended Data Fig. 1a). We then transfect the ExP STARR-seq plasmid pool into cells, where the promoter sequence on a given plasmid initiates transcription of a polyadenylated RNA containing the plasmid barcode and enhancer. We sequence these RNAs and calculate STARR-seq expression as the frequency of RNAs observed for each plasmid normalized by the frequency of that plasmid in the input DNA plasmid pool. b. Correlation of ExP STARR-seq expression between biological replicate experiments, calculated for individual enhancer-promoter pairs with unique plasmid barcodes. Axes represent the average STARR-seq expression (RNA/DNA) of two biological replicates. Density: number of enhancer-promoter plasmids. c. Average promoter activity (STARR-seq expression when paired with random genomic controls in the enhancer position) of promoter sequences derived from random genomic controls (set at 0), genes not expressed in K562s, and all other gene promoters. Box is median and interquartile range, whiskers are +/− 1.5 x IQR. d. Average enhancer activity (STARR-seq expression of plasmids containing a given enhancer averaged across all promoters) of enhancer sequences derived from random genomic controls, accessible elements, and genomic enhancers validated in CRISPR experiments. Box and whiskers as in (c). Red dots represent three enhancers near HBE1 (see panel e). e. Sequences derived from three genomic enhancers that regulate HBE1 in the genome (HS1-HS3) activate the HBE1 promoter in ExP STARR-seq. Ctrl: Average of 44 random genomic control sequences in the enhancer position that passed thresholds (see Methods). Error bars: 95% CI across plasmid barcodes, n=110 (ctrl), 2 (HS1), 1 (HS2), 5 (HS3).
Fig. 2.
Fig. 2.. Enhancer and promoter activities combine multiplicatively
a. Correlation of enhancer activation for PPP1R15A and DNASE2 promoters. Each point is a shared enhancer sequence. b. Correlation of enhancer activation by chr17:40851134-40851398 and chr11:61602148-61602412 enhancers. Each point is a shared promoter sequence. c. Distribution of pairwise correlations of enhancer activation between promoter sequences, as in (a). Black dotted line = mean Spearman correlation. d. Distribution of pairwise correlations of promoter activation between enhancer sequences, as in (b). Black dotted line = mean Spearman correlation. e. Heatmap of ExP STARR-seq expression across all pairs of promoter (vertical) and enhancer sequences (horizontal). Axes are sorted by intrinsic promoter and enhancer activities. Grey: missing data. f. Heatmap representing the multiplication of intrinsic promoter activity (vertical) with intrinsic enhancer activity (horizontal) from the Poisson model. g-i. Correlation of ExP STARR-seq expression with intrinsic promoter activity (g), intrinsic enhancer activity (h), and the product of intrinsic promoter and enhancer activities (i). Density color scale: number enhancer-promoter pairs.
Fig. 3.
Fig. 3.. Compatibility classes of enhancers and promoters.
a. Heatmap of deviations in enhancer-promoter STARR-seq expression from a multiplicative enhancer-promoter model (color scale: fold-difference between observed expression versus expression predicted by multiplicative model; gray: missing data). Vertical axis: promoter sequences grouped by class and sorted by responsiveness to E1 vs. E2 (see b); horizontal axis: enhancer sequences grouped by class and sorted by activation of P1 vs. P2 (see c). b. Activation of P1 vs P2 promoters by E1 and E2 enhancer sequences (equivalently: Responsiveness to E1 vs E2 enhancer sequences). n=126 (E1) and 290 (E2). Boxes are median and interquartile range, whiskers are +/− 1.5*IQR. *P-value = 4.2 x 10⁻⁸, two-sample t-test. c. For each promoter, the average activation by (responsiveness to) E1 enhancer sequences (x-axis) versus the average activation by E2 enhancer sequences (y-axis). P1 promoters (light blue) are activated more strongly by E1 versus E2 enhancers. d. For each enhancer, the average fold-activation when paired with P1 promoters (x-axis) versus P2 promoters (y-axis). E1 enhancers (light brown) more strongly activate P1 promoters.
Fig. 4.
Fig. 4.. Promoter classes correspond to enhancer-responsive versus ubiquitously expressed genes
a. Variability of expression of genes corresponding to P1 and P2 promoters. Coefficient of variation is calculated across 1829 CAGE experiments from the FANTOM5 Consortium. n=192 (P1) and 391 (P2). Boxes are median and interquartile range, whiskers are +/− 1.5*IQR. P-value is from two-sample t-test. b. Intrinsic promoter activity for P1 vs P2 promoters (ExP STARR-seq) and genomic transcription level of genes corresponding to P1 vs P2 promoters (PRO-seq reads per kilobase per million in gene bodies). n=192 (P1) and 391 (P2). Boxes are median and interquartile range, whiskers are +/− 1.5*IQR. c. Number of activating genomic regulatory elements identified in comprehensive CRISPRi screens for genes corresponding to P1 promoters (n=14) and P2 promoters (n=11). d. Volcano plot comparing ChIP-seq and other biochemical features for P2 versus P1 promoters (see Supplementary Table 6). X-axis: ratio of average signal at P2 versus P1 promoters. Blue points: features with significantly higher signal at P2 promoters; no features have significantly higher signal at P1 promoters. e. ChIP-seq signal for GABPA and YY1 in K562 cells at P1 and P2 promoters in the genome, aligned by TSS (see Methods). Top: average ChIP signal (normalized to input) +/− 95% c.i. Bottom: signal at individual genomic promoters. f. Motif occurrences for GABPA and YY1 in P1 and P2 promoters, aligned by TSS.
Fig. 5.
Fig. 5.. P2 promoters contain built-in enhancer sequences
a. DNase-seq and GABPA ChIP-seq binding at the HBE1 promoter (pHBE1, P1), HS1-HS3 enhancers (E1), and RPL3 promoter (pRPL3, P2). b. Correlation between intrinsic promoter activity and responsiveness of promoters to E1 enhancers (average activation by E1 sequences, expressions vs. random genomic controls). Each point is one promoter. c. Average enhancer activity in HS-STARR-seq (RNA/DNA) of random genomic background fragments (Ctrl, N = 3.9 million) and P1 (N = 192) and P2 (N = 391) promoters. *P =5.2*10−4, **P = 1.1*10−15, ***P = 1.4*10−66, two-sided t-test. Boxes are median and interquartile range, whiskers are +/− 1.5*IQR. d. For each of 400 sequence motifs that appeared in at least 5% of HS-STARR-seq fragments, correlation (Pearson R) of motif occurrence with intrinsic promoter activity (SuRE signal, y-axis) and with intrinsic enhancer activity (HS-STARR-seq signal among fragments not overlapping TSS, x-axis). e. Change in promoter responsiveness to E1 enhancers (average fold-activation by E1 enhancers) after scrambling YY1 or GABPA motifs in P2 promoters or inserting YY1 or GABPA motifs into P1 promoters. Each point is a promoter, *P < 0.05, two-sided t-test. Boxes are median and interquartile range, whiskers are +/− 1.5*IQR. f. A model for enhancer-promoter compatibility. Enhancers multiplicatively scale the RNA output of promoters. P2 promoters contain built-in activating sequence motifs that both increase intrinsic promoter activity and reduce responsiveness to distal enhancers.

Comment in

Similar articles

Cited by

References

Main Text References

    1. ENCODE Project Consortium. An integrated encyclopedia of DNA elements in the human genome. Nature 489, 57–74 (2012). - PMC - PubMed
    1. van Arensbergen J, van Steensel B & Bussemaker HJ In search of the determinants of enhancer-promoter interaction specificity. Trends Cell Biol. 24, 695–702 (2014). - PMC - PubMed
    1. Emami KH, Navarre WW & Smale ST Core promoter specificities of the Sp1 and VP16 transcriptional activation domains. Mol. Cell. Biol 15, 5906–5916 (1995). - PMC - PubMed
    1. Ohtsuki S, Levine M & Cai HN Different core promoters possess distinct regulatory activities in the Drosophila embryo. Genes Dev. 12, 547–556 (1998). - PMC - PubMed
    1. Emami KH, Jain A & Smale ST Mechanism of synergy between TATA and initiator: synergistic binding of TFIID following a putative TFIIA-induced isomerization. Genes Dev. 11, 3007–3019 (1997). - PMC - PubMed

Additional References

    1. Anscombe FJ THE TRANSFORMATION OF POISSON, BINOMIAL AND NEGATIVE-BINOMIAL DATA. Biometrika vol. 35 246–254 (1948).
    1. Grant CE, Bailey TL & Noble WS FIMO: scanning for occurrences of a given motif. Bioinformatics 27, 1017–1018 (2011). - PMC - PubMed
    1. Kulakovskiy IV et al. HOCOMOCO: towards a complete collection of transcription factor binding models for human and mouse via large-scale ChIP-Seq analysis. Nucleic Acids Res. 46, D252–D259 (2018). - PMC - PubMed
    1. Core LJ et al. Analysis of nascent RNA identifies a unified architecture of initiation regions at mammalian promoters and enhancers. Nat. Genet 46, 1311–1320 (2014). - PMC - PubMed
    1. Vanhille L et al. High-throughput and quantitative assessment of enhancer activity in mammals by CapStarr-seq. Nat. Commun 6, 6905 (2015). - PubMed