. 2022 Sep 15;434(17):167628.
doi: 10.1016/j.jmb.2022.167628. Epub 2022 May 17.

Validation of an Allosteric Binding Site of Src Kinase Identified by Unbiased Ligand Binding Simulations

Affiliations

Validation of an Allosteric Binding Site of Src Kinase Identified by Unbiased Ligand Binding Simulations

Victoria R Mingione et al. J Mol Biol. .

Abstract

Allostery plays a primary role in regulating protein activity, making it an important mechanism in human disease and drug discovery. Identifying allosteric regulatory sites to explore their biological significance and therapeutic potential is invaluable to drug discovery; however, identification remains a challenge. Allosteric sites are often "cryptic" without clear geometric or chemical features. Since allosteric regulatory sites are often less conserved in protein kinases than the orthosteric ATP binding site, allosteric ligands are commonly more specific than ATP competitive inhibitors. We present a generalizable computational protocol to predict allosteric ligand binding sites based on unbiased ligand binding simulation trajectories. We demonstrate the feasibility of this protocol by revisiting our previously published ligand binding simulations using the first identified viral proto-oncogene, Src kinase, as a model system. The binding paths for kinase inhibitor PP1 uncovered three metastable intermediate states before binding the high-affinity ATP-binding pocket, revealing two previously known allosteric sites and one novel site. Herein, we validate the novel site using a combination of virtual screening and experimental assays to identify a V-type allosteric small-molecule inhibitor that targets this novel site with specificity for Src over closely related kinases. This study provides a proof-of-concept for employing unbiased ligand binding simulations to identify cryptic allosteric binding sites and is widely applicable to other protein-ligand systems.

Keywords: NMR; cancer; docking; drug binding process; inhibitor.


Conflict of interest statement

Declaration of interests The authors declare that they have no known competing financial interests or personal relationships that could have appeared to influence the work reported in this paper.

Figures

Figure 1:
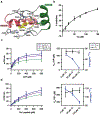
Figure 1:. Targeting a proposed allosteric site.
(a) Density map of kinase inhibitor PP1 on Src kinase during unbiased ligand binding simulations with main intermediate binding sites notated. (b) Chemical structure of ATP-competitive inhibitor PP1 employed in simulations. (c) Simulation snapshot of PP1 occupying the G-loop site (bottom), which is not fully formed in the X-ray structure employed as the starting model for the ligand binding simulations (top) (PDB-entry 1Y57) [24]. (d) Allosteric catalytic spine in Src kinase domain [22] interfaces with the predicted G-loop binding site (purple). Allosteric catalytic and regulatory spine residues are highlighted in yellow and blue, respectively. Key regulatory structural elements are color-coded (P-loop = blue, helix-αC = orange, activation loop = magenta). G-loop binding pocket is stabilized when Src kinase is in the active conformation (Lys295-Glu310 salt bridge is formed, DFG Asp404-in) (small box). PP1 bound to predicted G-loop site with visible binding site residues notated (large box). Panels (a) and (c) are adopted from [18].
Figure 2.
Figure 2.. Docking screen identifies potential binders of the G-loop site that alter kinase activity.
(a) Overview of ligand docking strategy. We docked 230,000 compounds from the ZINC library and ranked them by DOCK Cartesian energy score (DCEsum). We selected the top 100,000 compounds and clustered them according to chemical similarity. Within clusters, we ranked compounds for DCEsum-dependent qualities (DCEsum and Ligeff) or DCEsum-independent footprint scores (FPS). The total score considers both DCEsum and FPSsum. The highest-ranking cluster heads yielded a final selection of compounds that were further narrowed for biochemical characterization. Histograms of (b) DCEsum, (c) FPSsum, (d) Total score, and (e) molecular weight from the top 100,000 (green) and the top 123 compounds (purple) for the allosteric site on Src kinase. (f) Effects of the top 49 ligands from the computational docking screen on Src kinase activity at 100 μM relative to DMSO control. Error bars represent ± SEM of triplicate experiments.
Figure 3:
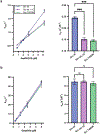
Figure 3:. Experimental validation of computational docking reveals compound 1C is a non-competitive inhibitor of Src.
(a) Simplified structure of 1C docked to the MD-derived Src structure with labeled binding site residues on helices-αF and -αG, and adjacent loops (b) Percent inhibition of kinase activity by 1C revealed inhibition of Src wt KD with an EC50 of 61.4 ± 34.4 μM. (c) Kinase activity assay in the presence of increasing concentrations of ATP (0–800 μM) and 0 μM 1C (blue, circles), 50 μM 1C (purple, squares), and 100 μM 1C (green, triangles) (left). Src wt KD KM for ATP and reaction Vmax plotted against 1C concentration (right). (d) Kinase activity assay in the presence of increasing concentrations of substrate peptide (0–800 μM) and 0 μM 1C (blue, circles), 50 μM 1C (purple, squares), and 100 μM 1C (green, triangles) (left). Src wt KD KM for substrate peptide and reaction Vmax plotted against 1C concentration (right). All error bars represent ± SEM of triplicate experiments.
Figure 4.
Figure 4.. 1C is selective for Src kinase.
(a) Sequence alignment of G-loop binding site residues for Src, Abl, and Hck. (b) Differential scanning fluorimetry thermal denaturation temperatures for Src, Abl, and Hck wt kinase domains in the absence and presence of 1C. Error bars represent ± SEM of triplicate experiments. (c) 1H NMR-STD Amplification factors for 1C binding to Src, Abl, and Hck wt kinase domains. Amplification factors were calculated from the average of five hydrogen peaks originating from 1C. Data represent the average amplification factors ± SD. (d) Percent inhibition of kinase activity by 1C for Src, Abl, and Hck wt kinase domains. (e) Percent inhibition of kinase activity by 1C for Src wt, Src T453W, and Src M481K kinase domains. (d,e) Percent inhibition was calculated for each inhibitor concentration in comparison to kinase activity reactions containing no inhibitor. Error bars represent ± SEM of triplicate experiments. 0.1234 (ns), 0.0002 (***), <0.0001 (****).
Figure 5.
Figure 5.. Binding of 1C to Src KD•dasatinib induces CSPs and dynamic changes in G-loop site and N-lobe regulatory sites.
1H-15N NMR CSPs of Src•dasatinib induced by 1C binding were analyzed by (a) histogram and (c) CSP (Δδ(ppm)) structure mapping to the Src•dasatinib structure (PDB 3QLG). The yellow, orange, and red histogram dashed lines represent CSP magnitudes corresponding to 1, 2, and 3 standard deviations from the mean. Backbone amide resonance intensity ratios for Src•dasatinib bound to 1C relative to Src•dasatinib were analyzed by (b) histogram and (d) structure mapping to the Src•dasatinib structure (PDB 3QLG). The black dashed histogram line indicates the overall mean intensity ratio. Orange and red dashed histogram lines represent 1SD and 2SD greater than the mean intensity ratio >1. Green and blue dashed histogram lines indicate the 1SD and 2SD less than the mean intensity ratio <1.
Figure 6.
Figure 6.. 1C exhibits conformation selectivity for Src in the active conformation.
(a) Differential scanning fluorimetry thermal denaturation analysis to determine the change in melting temperature for Src wt KD in the presence and absence of 1C and ATP competitive inhibitors dasatinib and DasDFGOII. (b) Chemical structure of compound 1C with annotated protons used for amplification factor quantification. (c) Amplification factors for 1C protons in the presence of Src, Src•dasatinib, and Src•DASDFGOII. (d) Normalized percent inhibition for 1C dose-response at 100 μM for Src wt KD and Src wt 3D. 0.1234 (ns), 0.0332 (*), 0.0021 (**).
Figure 7.
Figure 7.. The G-loop site allosterically modulates ATP-competitive binding kinetics.
Kinetics of (a) type-II inhibitor DasDFGOII and (b) type I inhibitor dasatinib binding to Src (blue, circles), Src + 1C (purple, squares), and Src T453W (green, triangles). Experiments were done in triplicate and the average observed rate constants (kobs) ± SEM were plotted against increasing inhibitor concentrations and fit to a straight line in GraphPad Prism (version 9) to derive kon (left). Association rates derived from the slopes of straight lines fitted in (a) and (b) (right). 0.1234 (ns), 0.0002 (***).

Similar articles

Cited by

References

    1. Liu J, Nussinov R. Allostery: An Overview of Its History, Concepts, Methods, and Applications. PLoS Comput Biol. 2016;12:e1004966. - PMC - PubMed
    1. Suel GM, Lockless SW, Wall MA, Ranganathan R. Evolutionarily conserved networks of residues mediate allosteric communication in proteins. Nat Struct Biol. 2003;10:59–69. - PubMed
    1. Cui Q, Karplus M. Allostery and cooperativity revisited. Protein Sci. 2008;17:1295–307. - PMC - PubMed
    1. Wodak SJ, Paci E, Dokholyan NV, Berezovsky IN, Horovitz A, Li J, et al. Allostery in Its Many Disguises: From Theory to Applications. Structure. 2019;27:566–78. - PMC - PubMed
    1. Huse M, Kuriyan J. The conformational plasticity of protein kinases. Cell. 2002;109:275–82. - PubMed

Publication types

LinkOut - more resources