Review
. 2022 Sep:90:101067.
doi: 10.1016/j.preteyeres.2022.101067. Epub 2022 May 17.

Insights into the developing fovea revealed by imaging

Affiliations
Review

Insights into the developing fovea revealed by imaging

Ye He et al. Prog Retin Eye Res. 2022 Sep.

Abstract

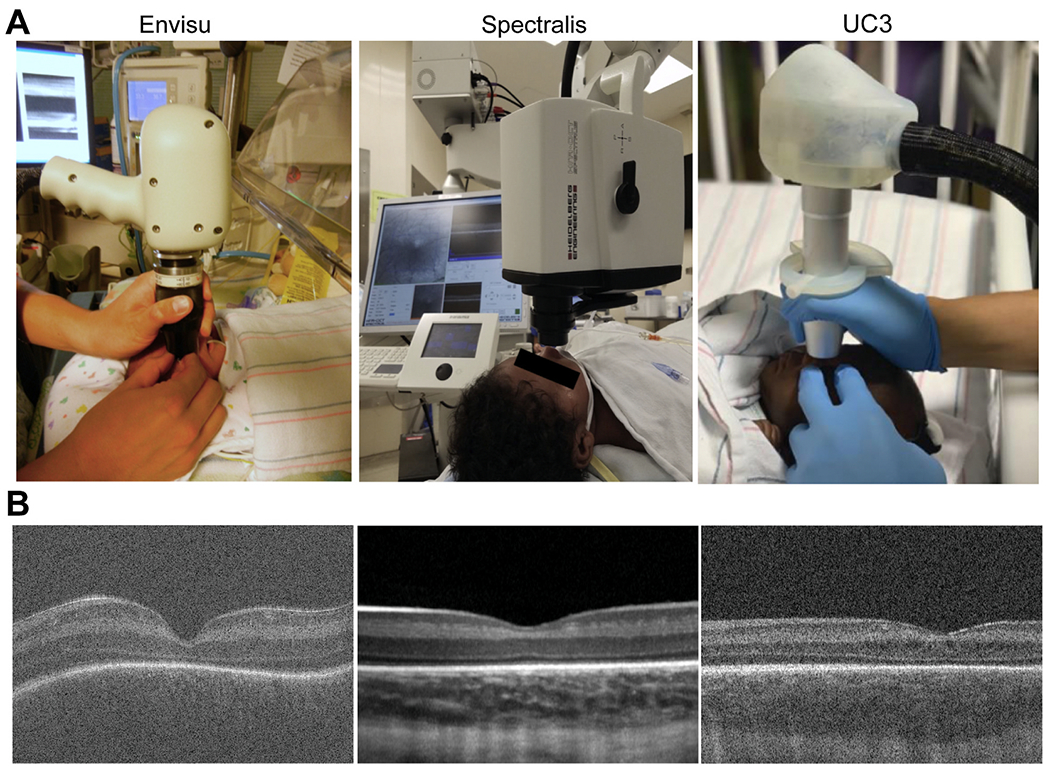
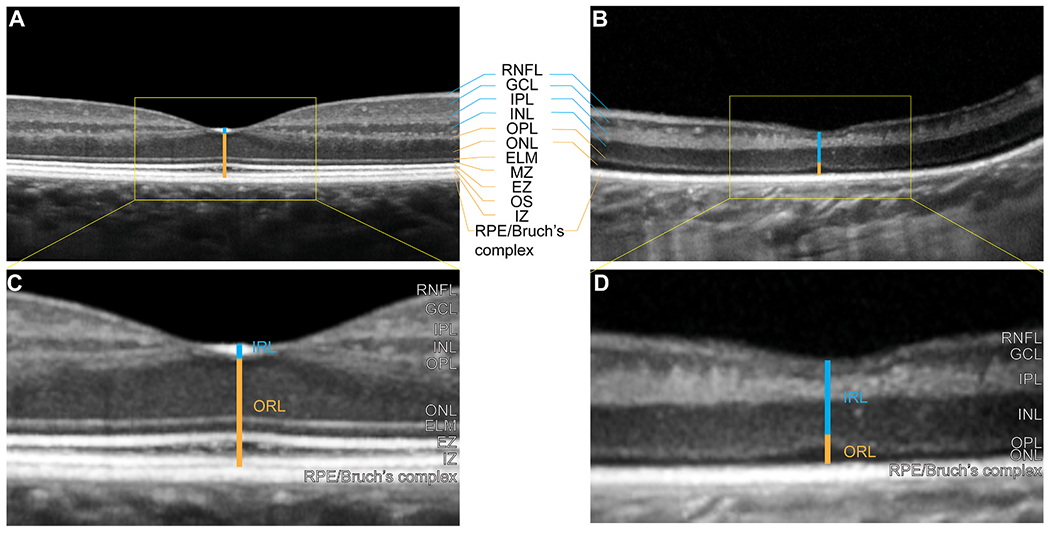
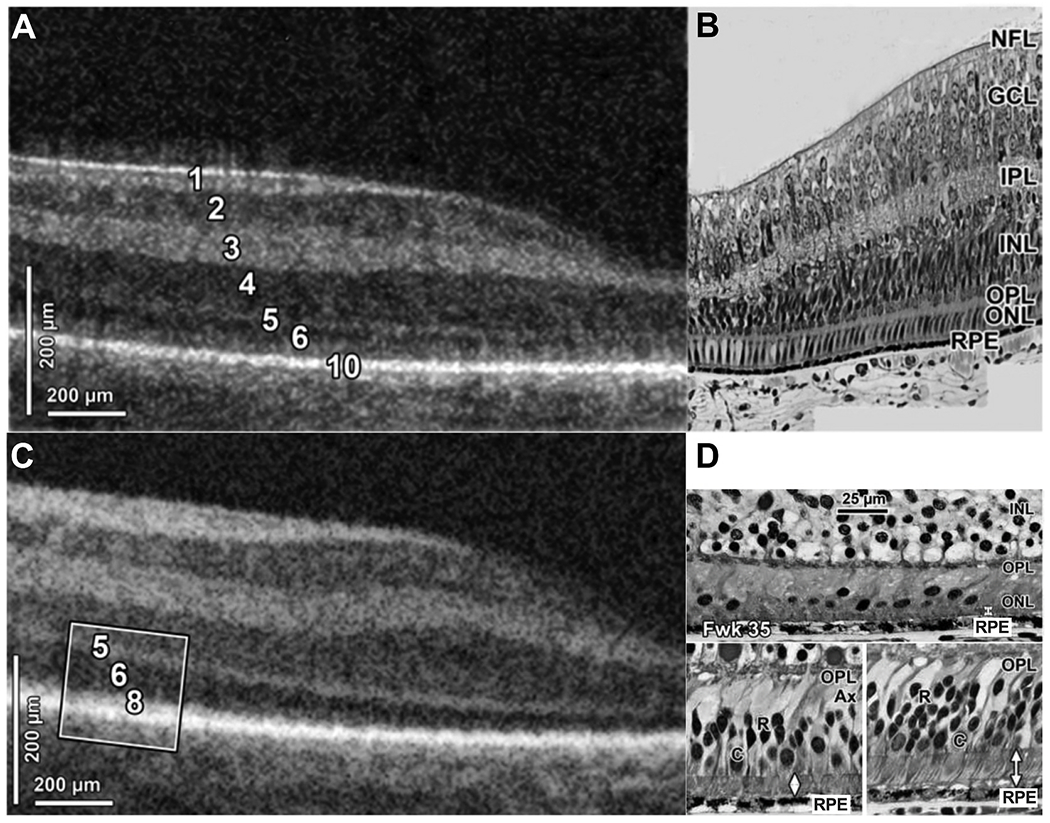
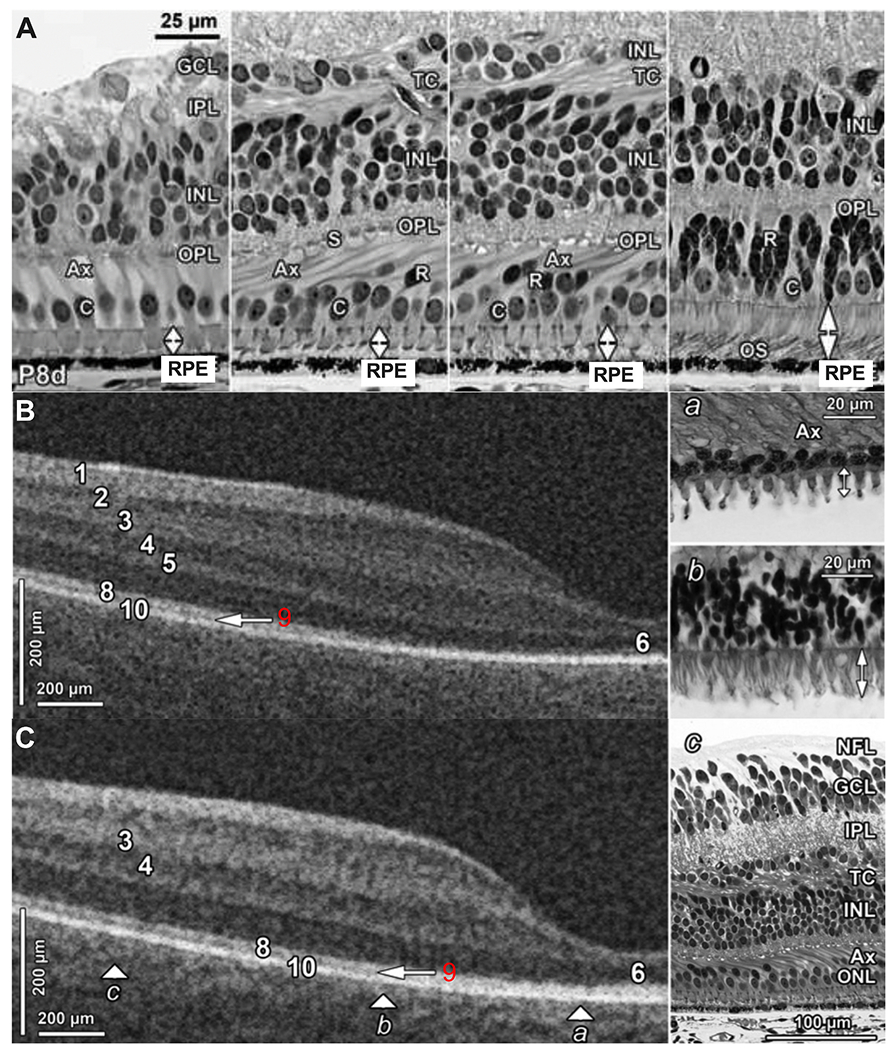
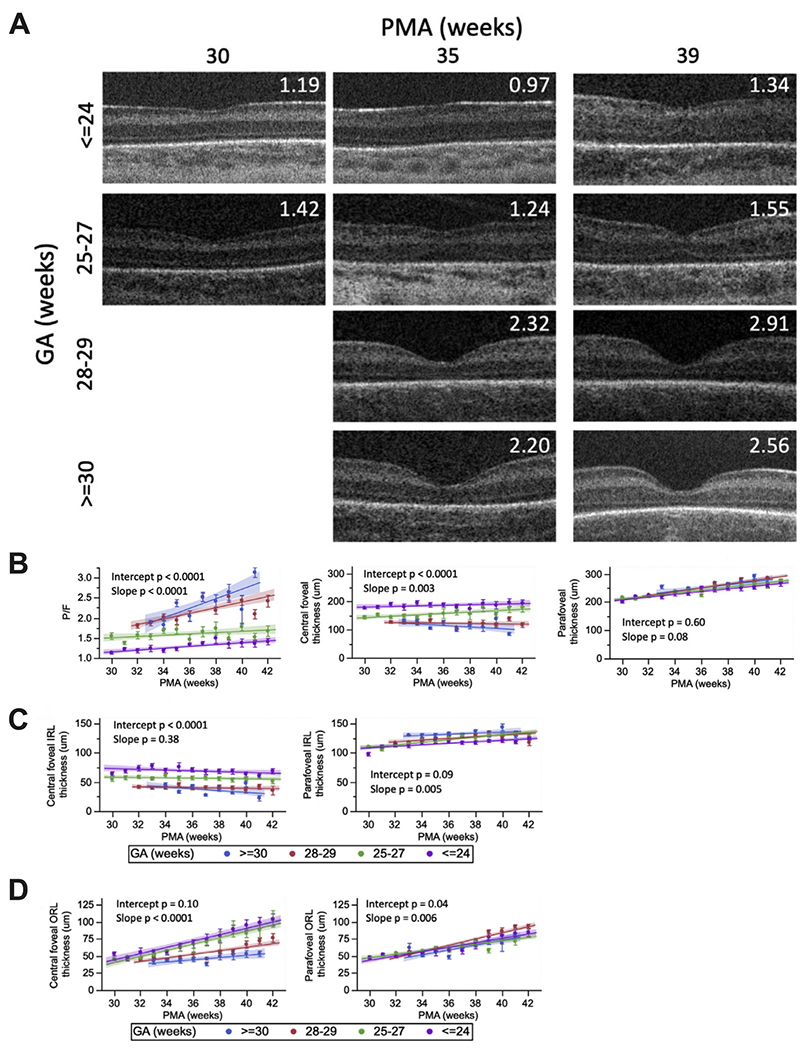
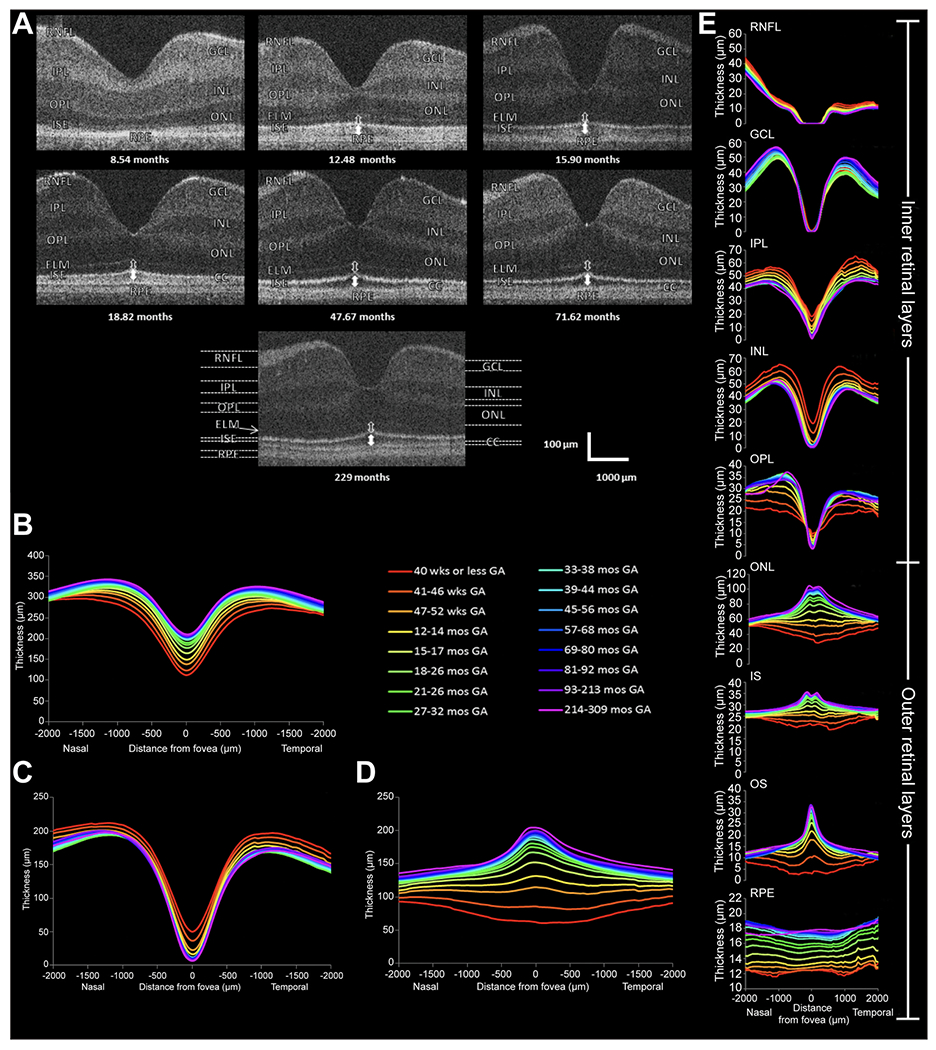
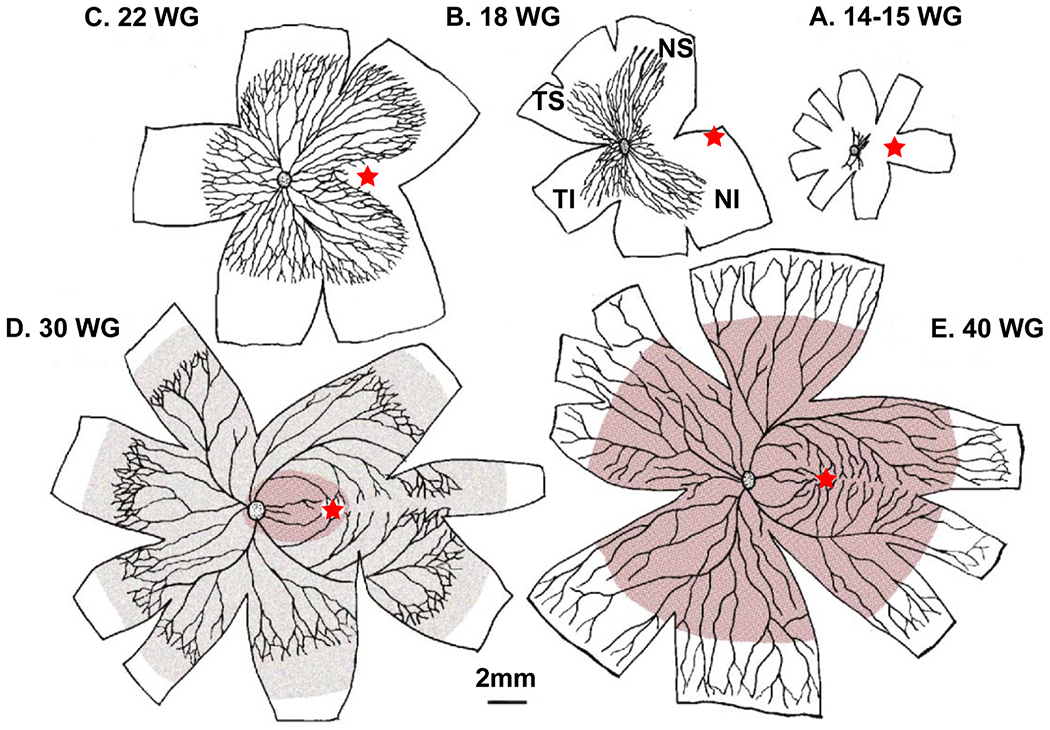
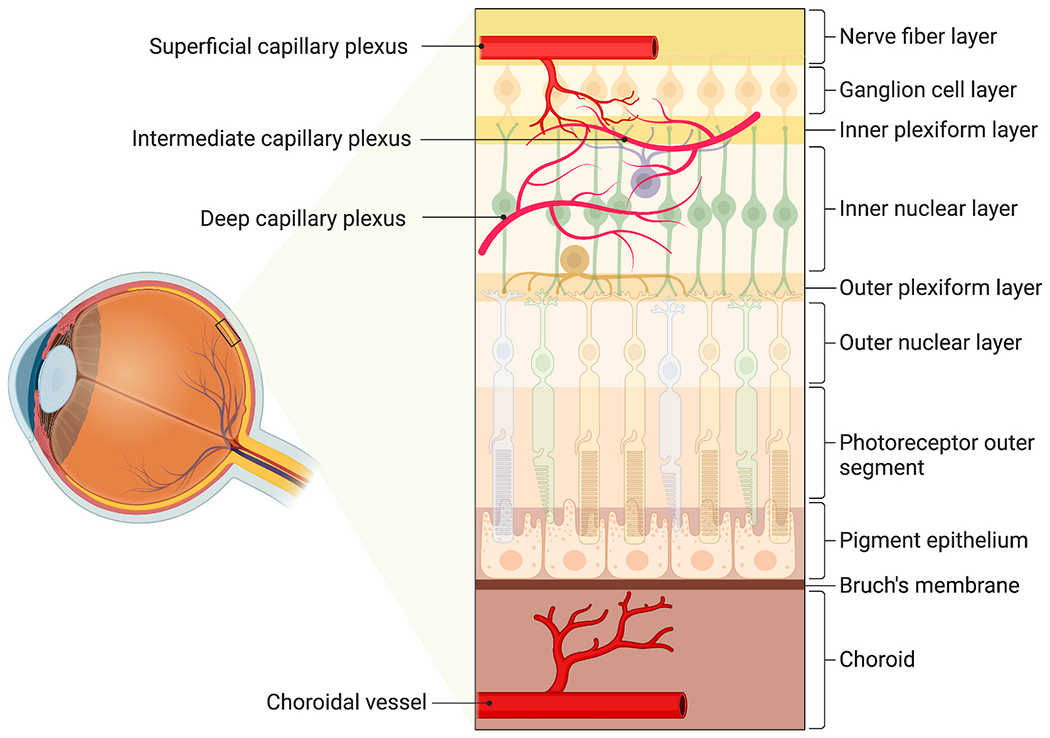
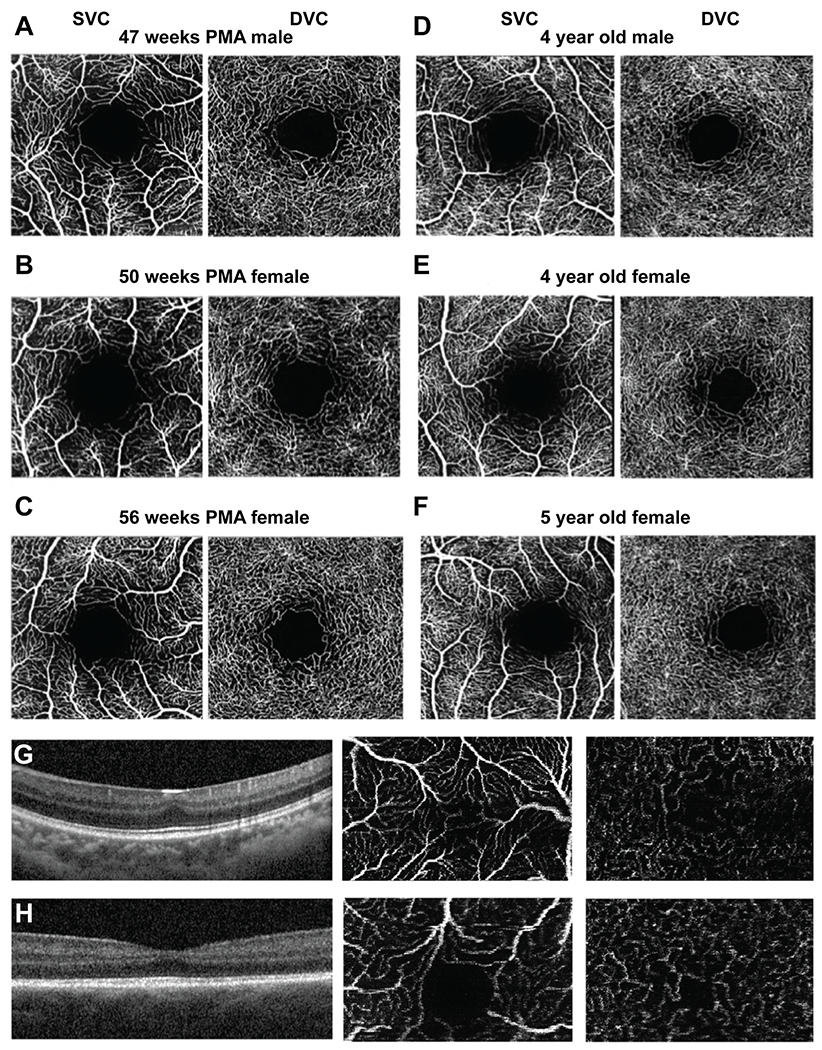
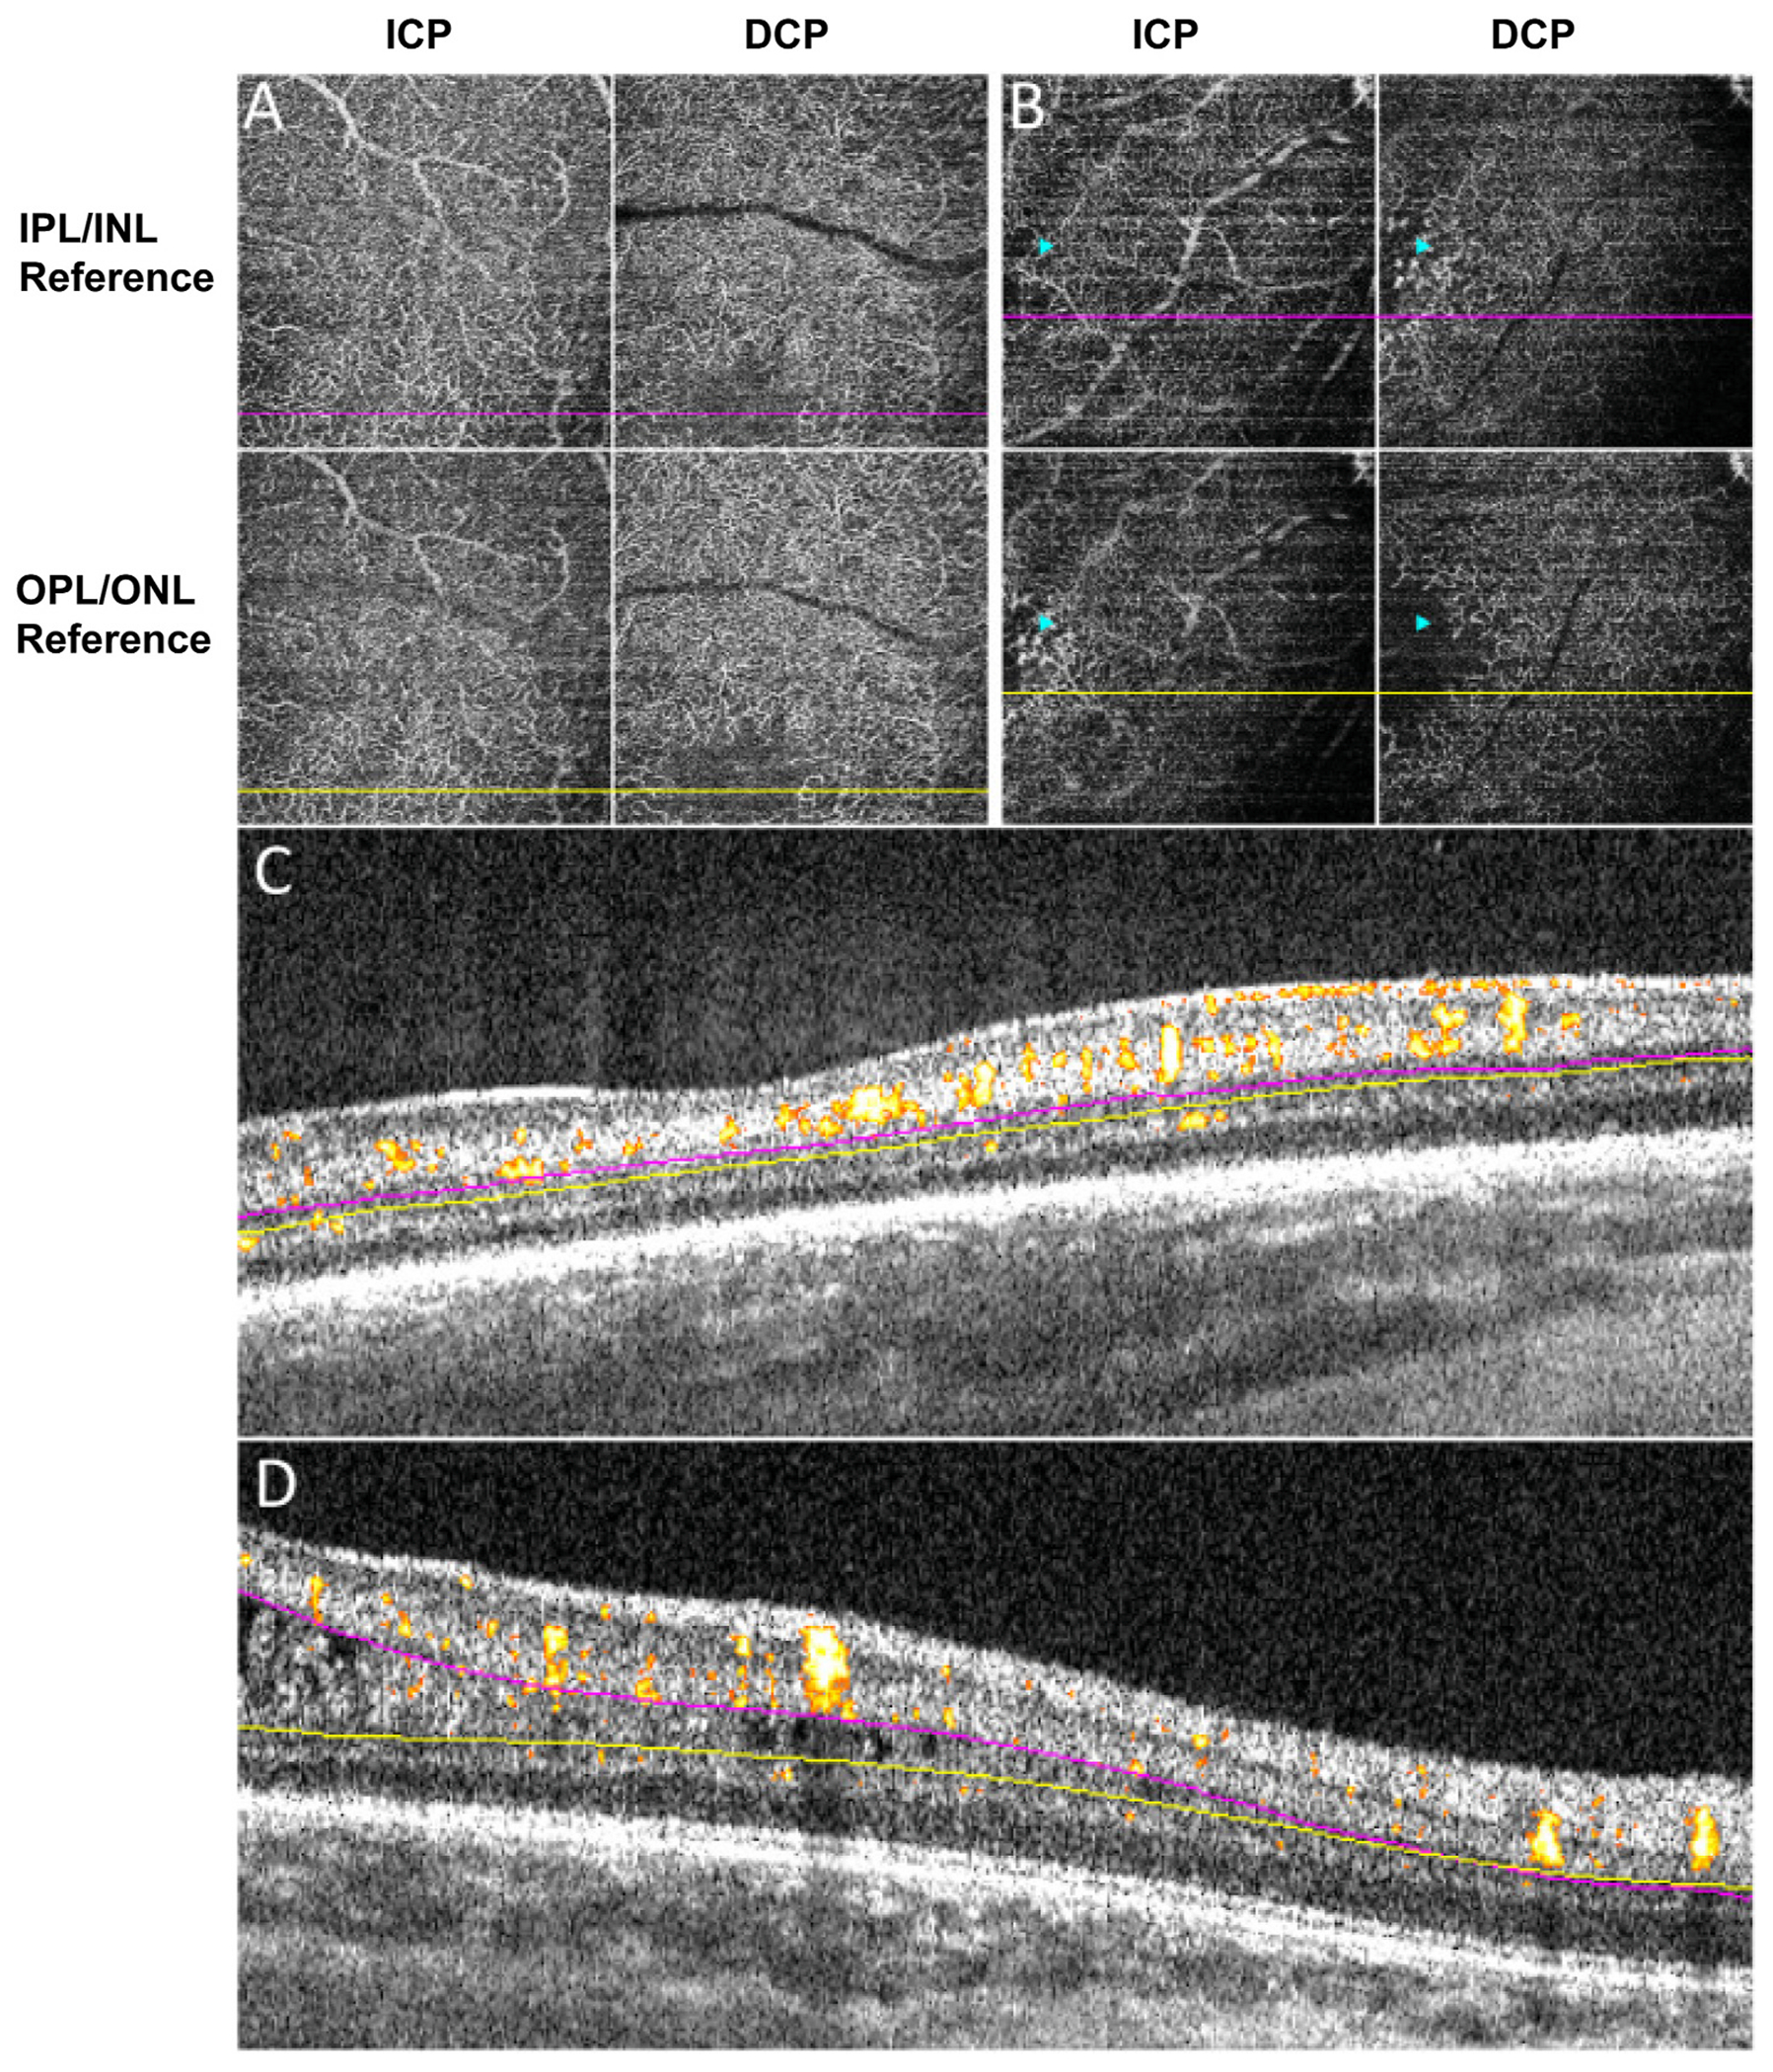
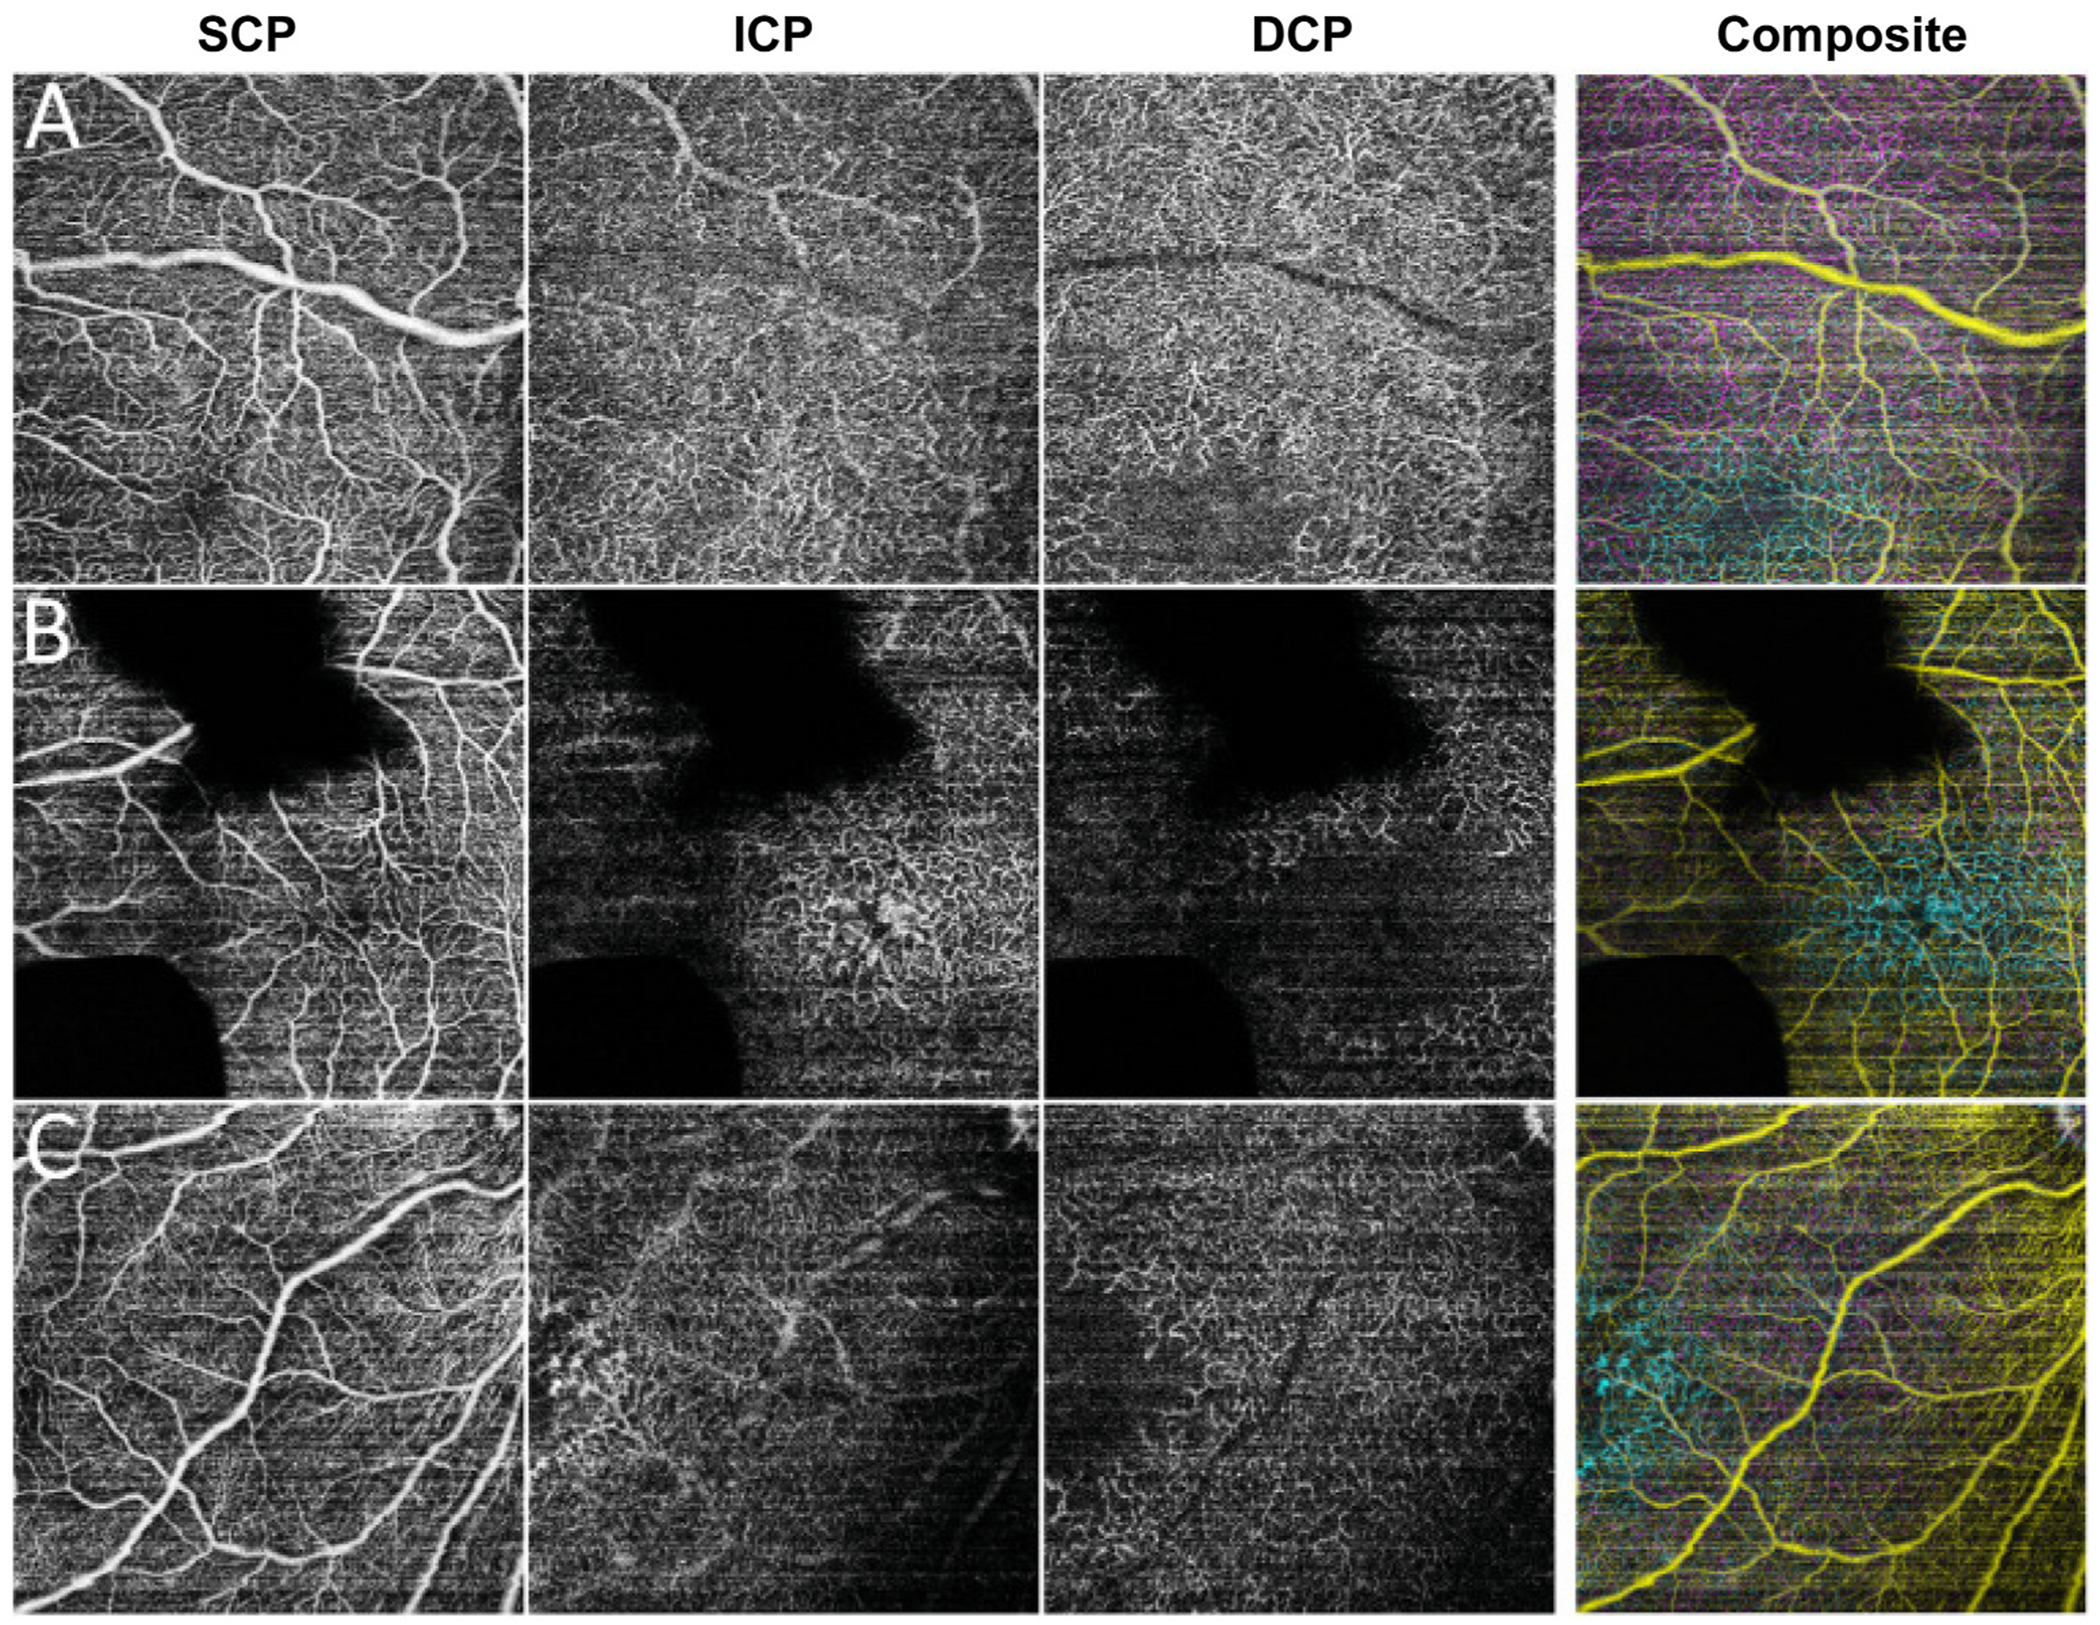
Early development of the fovea has been documented by histological studies over the past few decades. However, structural distortion due to sample processing and the paucity of high-quality post-mortem tissue has limited the effectiveness of this approach. With the continuous progress in high-resolution non-invasive imaging technology, most notably optical coherence tomography (OCT) and OCT angiography (OCT-A), in vivo visualization of the developing retina has become possible. Combining the information from histologic studies with this novel imaging information has provided a more complete and accurate picture of retinal development, and in particular the developing fovea. Advances in neonatal care have increased the survival rate of extremely premature infants. However, with enhanced survival there has been an attendant increase in retinal developmental complications. Several key abnormalities, including a thickening of the inner retina at the foveal center, a shallower foveal pit, a smaller foveal avascular zone, and delayed development of the photoreceptors have been described in preterm infants when compared to full-term infants. Notably these abnormalities, which are consistent with a partial arrest of foveal development, appear to persist into later childhood and adulthood in these eyes of individuals born prematurely. Understanding normal foveal development is vital to interpreting these pathologic findings associated with prematurity. In this review, we first discuss the various advanced imaging technologies that have been adapted for imaging the infant eye. We then review the key events and steps in the development of the normal structure of the fovea and contrast structural features in normal and preterm retina from infancy to childhood. Finally, we discuss the development of the perifoveal retinal microvasculature and highlight future opportunities to expand our understanding of the developing fovea.

Keywords: Developing fovea; Infant imaging; Optical coherence tomography; Optical coherence tomography angiography; Prematurity.


Conflict of interest statement

Declaration of competing interest None.

Figures

Fig. 1.
Fig. 1.. OCT systems for pediatric use.
A. Leica Envisu handheld spectral-domain OCT system (Left); Spectralis FLEX armature fixated OCT system (middle); Investigational handheld swept-source OCT system UC3 (right). Adapted from Viehland et al. (2019), Chen et al. (2020c), and Hsu et al. (2019a). B. Representative foveal OCT cross-sectional B-scan image from each device. Note that non-averaged B-scan image was shown for Envisu, 2x averaged B-scan image was shown for UC3, and 7–11x averaged B-scan was shown for Spectralis.
Fig. 2.
Fig. 2.. Comparison of foveal OCT B-scan in the adult and developing retina.
Central foveal OCT B-scan image from a 24-year-old adult born at term age (A, C) and a 34-week postmenstrual age (PMA) infant (born at 25 weeks GA, birth weight 605 g) (B, D) imaged with the Heidelberg Spectralis system. From top to bottom, the retinal layers are: retinal nerve fiber layer (RNFL), ganglion cell layer (GCL), inner plexiform layer (IPL), inner nuclear layer (INL), outer plexiform layer (OPL), outer nuclear layer (ONL), external limiting membrane (ELM), myoid zone of photoreceptors (MZ), ellipsoid zone of photoreceptors (EZ), outer segments of photoreceptors (OS), interdigitation zone (IZ), and retinal pigment epithelium (RPE)/Bruch’s complex. Inner retinal layers (IRL) are indicated by the blue vertical line. Outer retinal layers (ORL) are indicated by the orange vertical line. Note that the ELM, MZ, EZ, and IZ are not apparent in the immature developing retina (B, D).
Fig. 3.
Fig. 3.. Foveal maturation from 30 to 36 weeks PMA (preterm infants): correlation of optical coherence tomography B-scan with histology.
A. OCT B-scan image from a 31 weeks postmenstrual age (PMA) infant eye. At this stage, the GCL, IPL, and INL are clearly evident at the fovea, whereas the OPL and ONL are very thin. The EZ is not visible. B. Histology from a 27 weeks PMA infant retina through the fovea (projected ~2:1 scale to match OCT B-scan image). C. At 36 weeks PMA, EZ (Band 8) is barely detectable in the perifovea but not in the fovea. D. Histology from a fetal week 35 retina at the fovea (top), at 800 μm from the foveal center (bottom, left), where there are 2–3 layers of rods, and at 2 mm from the foveal center (bottom, right). Henle axons (Ax) can be discerned for cones and rods outside the fovea (bottom, right), which tilt away from the foveal center. Vertical double arrows show the length of the inner and outer segments of the photoreceptors (the distance between the ELM and RPE) which is 5 μm at the fovea, 12.5 μm at 800 μm, and 20 μm (widest) at 2 mm from the fovea. Layers defined as follows: 1 = retinal nerve fiber layer (RNFL/NFL); 2 = ganglion cell layer (GCL); 3 = inner plexiform layer (IPL); 4 = inner nuclear layer (INL); 5 = outer plexiform layer (OPL); 6 = outer nuclear layer (ONL); 8 = ellipsoid zone (EZ); 10 = retinal pigment epithelium (RPE)/Bruch’s complex. R = rods, C = cones. (Note that the numbering of the layers in these images differs from what is described in the text but its consistent with the original publications). Adapted from Hendrickson et al. (2012), and Vajzovic et al. (2012).
Fig. 4.
Fig. 4.. Foveal maturation from 37 to 42 weeks PMA (term infants): correlation of optical coherence tomography B-scan with histology.
A. Foveal histology from a full-term infant at postnatal day 8 (P8d). P8d photoreceptors at the foveal center (far left), on the foveal slope near the first rods (middle left), and 800 μm (middle right) and 2 mm (far right) from the fovea. Vertical double arrows show the length of the inner and outer segments (OS) of the photoreceptors (the distance between the ELM and RPE). Note that the length of the photoreceptors gradually increases from the foveal center to the periphery. OS are longer in the periphery (far right) compared to the fovea (far left). The transient layer of Chievitz (TC) can be observed in the middle left and right but is not visible on the OCT B-scan (B, C). B. 37–39 weeks PMA: OCT B-scan from a full-term infant at 39 weeks PMA. The fovea is very thin as band 6 (ONL) is thin and band 8 (EZ) is nearly absent at the foveal center. C. 40–42 weeks PMA: OCT B-scan from a full-term infant retina at 40 weeks PMA. EZ (Band 8) is present at the foveal center. a, b, and c (right) show histology sections of equivalent locations, which are indicated on the OCT B-scan (C). The length of the inner and outer segments of the photoreceptor are remarkably shorter at the fovea than in the periphery. A hypo-reflective band 9 can be seen in the periphery due to the elongation of the outer segments. The Henle fiber layer (HFL), composed of the axons of photoreceptors, Ax (Ax, in regions a and c), appears in this section and appears to blend with the adjacent ONL outside the foveal center (C). Layers defined as follows: 1 = retinal nerve fiber layer (RNFL/NFL); 2 = ganglion cell layer (GCL); 3 = inner plexiform layer (IPL); 4 = inner nuclear layer (INL); 5 = outer plexiform layer (OPL); 6 = outer nuclear layer + Henle axon (Ax) (ONL + Ax); 8 = ellipsoid zone (EZ); 9 = OS of photoreceptor; 10 = retinal pigment epithelium (RPE)/Bruch’s complex. R = rods, C = cones. (Note that the numbering of the layers in these images differs from what is described in the text but its consistent with the original publications). Adapted from Hendrickson et al. (2012), and Vajzovic et al. (2012).
Fig. 5.
Fig. 5.. Foveal maturation after 43 weeks PMA (term infant): correlation of optical coherence tomography B-scan with histology.
A. OCT B-scan image from a 9-month-old infant eye (left) compared to a histology image at 15 months of age (right, projected at ~2:1 scale to match OCT). Most retinal layers are adult-like. At this period, the foveal pit is wider than in the earlier phase. The thickening of OCT band 6 (left) is attributable to cone packing and elongation of Henle axons (Ax). The ELM (horizontal white arrow) can be observed more frequently. B. Histology from a 15-month-old infant retina at the foveal center (left), and 800 μm (middle) and 2 mm (right) from the foveal center. Vertical double arrows show the length of the inner and outer segments of the photoreceptors (the distance between the ELM and RPE). Long thin rod OS (right, black arrow) are prominent at 2 mm (right) from the foveal center. Note that the length of the photoreceptor inner and outer segments is similar at the foveal and perifovea during this stage. Layers defined as follows: 1 = retinal nerve fiber layer (RNFL/NFL); 2 = ganglion cell layer (GCL); 3 = inner plexiform layer (IPL); 4 = inner nuclear layer (INL); 5 = outer plexiform layer (OPL); 6 = outer nuclear layer + Henle axon (Ax) (ONL + Ax); 7 = external limiting membrane (ELM); 8 = ellipsoid zone (EZ); 10 = retinal pigment epithelium (RPE)/Bruch’s complex. R = rods, S = synapses, M = müller glia. (Note that the numbering of the layers in these images differs from what is described in the text but its consistent with the original publications). Adapted from Hendrickson et al. (2012) and Vajzovic et al. (2012).
Fig. 6.
Fig. 6.. Retinal nerve fiber layer thickness measurements in infants.
A. Three-dimensional retinal surface topography composed from OCT scans of a healthy, full-term infant eye. The organizing axis originates from the center of the optic nerve and travels through the fovea. Various concentric color arcs represent the distances of 1.1, 1.3, 1.5, and 1.7 mm from the center of the optic nerve to the fovea, respectively. B. Summed voxel projection derived from OCT volume scan of the same full-term infant eye. The mean retinal nerve fiber layer (RNFL) thickness can be measured within each sector (the superior temporal, temporal superior, temporal inferior, and inferior temporal retina) of the segmented OCT volume scan. C. Segmentation of the RNFL in an OCT B-scan from the same full-term infant. D. RNFL thickness maps derived from segmented OCT volume scans of three healthy, full-term infants imaged at 40 weeks, 40 weeks, and 38 weeks PMA, respectively. The magenta arc represents the papillomacular bundle, defined as the 30° arc from −15° to +15° on the axis from the optic nerve to fovea and also referred to as 9 o’clock for right eyes and 3 o’clock for left eyes. E-F. RNFL was thinner in very preterm infants when compared to full-term infants in the papillomacular bundle and temporal quadrant, respectively. The box and whisker plots illustrate the median, quartiles, and range. The grey line represents the mean for each group. G. RNFL is positively correlated with birth weight in infants at 36 weeks PMA. The dotted lines represent the 95% confidence interval of the trendline (solid line). Adapted from Rothman et al. (2015a), Rothman et al. (2015b), and Shen et al. (2021).
Fig. 7.
Fig. 7.. Thickness maps of regional changes in foveal development from 31 to 43 weeks postmenstrual age in a preterm infant and following birth in a term infant
A. Changes in retinal layer thickness during foveal development from 31 weeks postmenstrual age (PMA) to 43 weeks PMA from the same preterm infant (GA 27 weeks, birth weight 1205 g; ROP, zone II stage 2). B. Changes in retinal layer thickness after term birth. Total retina (TR) exhibits a steady increase in thickness at the parafoveal area from 31 weeks PMA until childhood. The inner retinal layer (INL) demonstrates a decrease in thickness during early development at the fovea center, mainly driven by centrifugal inner retinal cell migration (away from the fovea center). The photoreceptor layer (PRL) demonstrates minimal development before term equivalent age followed by a dramatic increase in development at older ages. Overall, OCT scans demonstrate a progressive deepening of the foveal pit before or around term equivalent age followed by a widening of the foveal pit after term equivalent age. Adapted from Maldonado et al. (2011b).
Fig. 8.
Fig. 8.. Mean thickness of each retinal layer during foveal development and maturation at different periods.
Note that 37 weeks PMA to 16 years include infants or children born at full term. Standard deviations are plotted as error bars. Modified from Vajzovic et al. (2012).
Fig. 9.
Fig. 9.. Foveal differentiation and inner retinal displacement are arrested in extremely preterm infants
A. Representative foveal OCT images from different infants born at ≤24, 25–27, 28–29, and ≥30 weeks GA (rows) and imaged at 30, 35, and 39 weeks postmenstrual age (PMA) (columns). The value on the top right represents the parafoveal/foveal (P/F) ratio for the corresponding image. B. P/F ratio positively correlates with PMA in the older born infants (left). At all included ages, central foveal thickness is thicker in infants born at younger GA when compared to infants born at older GA. This observed difference in P/F ratio is caused by difference in central foveal thickness, rather than the parafoveal thickness (middle, right, respectively). P-values represent the results of the linear mixed model analysis with GA treated as a continuous variable. C. Inner retinal layers (IRL) at the foveal center are thicker in infants born at younger GA when compared to infants born at older GA. No significant difference was found between the groups for the slope of the inner retinal thickness by PMA. Parafoveal IRL grows thicker with increasing PMA but was not significantly related to GA. D. Outer retinal layers (ORL) become thicker with increasing PMA, especially in younger born infants. Of note, IRL was measured from the internal limiting membrane to the inner border of the INL, and ORL from the outer border of the INL to the inner border of the retinal pigmented epithelium. The INL was considered separately to eliminate the impact of the presence and severity of macular edema. Adapted from O’Sullivan et al. (2021).
Fig. 10.
Fig. 10.. Foveal development in full-term infants and young children
A. Foveal development demonstrated by representative OCT B-scans from between 8.54 months and 229 months of age. The empty block arrow and white block arrow indicate the inner segments and outer segments of the photoreceptors, respectively. B-E. Mean thickness of each retinal layer plotted using a fourth-order polynomial fit for each of the 16 age groups that are color-coded. Note that in this study, inner retinal layers include the RNFL, GCL, IPL, INL, and OPL. The outer retinal layers include the ONL, IS, OS, and RPE. Adapted from Lee et al. (2015).
Fig. 11.
Fig. 11.. Macular edema in preterm infants.
A. Mild macular edema in an eye of a preterm infant born at 25 weeks gestational age (GA) (birth weight 650 g) imaged at 40 weeks postmenstrual age (PMA). Cystoid spaces were only observed in the inner nuclear layer at the parafovea. B. Moderate macular edema in an eye of a preterm infant born at 25 weeks GA (birth weight 680 g) imaged at 32 weeks PMA. Multiple cystoid spaces were observed in the fovea and parafovea. C. Severe macular edema in an eye of a preterm infant born at 28 weeks GA (birth weight 1220 g) imaged at 36 weeks PMA. Multiple cystoid spaces were observed in the foveal center and parafoveal region, and the outer plexiforn layer demonstrated inward bulging.
Fig. 12.
Fig. 12.. Schematic illustration of human retinal vascular development from 14 to 40 weeks gestation.
The vascular progenitor cells are observed at the optic nerve head at around 14–15 weeks gestation (WG). A. The primary retinal vasculature gradually extends to the retinal periphery in a four-leaf lobular configuration (temporal superior, TS; temporal inferior, TI; nasal superior, NS; nasal inferior, NI). The secondary retinal vasculature forms slower than the primary retinal vasculature B–E. The primary and secondary retinal vasculature are represented by the black arborization in the diagram and pink shading, respectively. The red star indicates the location of the impending fovea or fovea. Adapted from Provis (2001).
Fig. 13.
Fig. 13.. Schematic illustration of the three-layered retinal vasculature in the mature retina.
The cross-sectional diagram of the retina on the right illustrates the overall arrangement of retinal cells and layers. The axial locations of the microvasculature including the superficial, intermediate, and deep capillary plexi and the choroidal vasculature are shown. The image was created with the BioRender program.
Fig. 14.
Fig. 14.. OCT-A imaging of the macular microvasculature in infants and young children using the investigational Heidelberg Spectralis FLEX system.
A-H. OCT-A imaging was performed in supine pediatric patients during examination under anesthesia using Spectralis with Flex module. A-F. The microvascular pattern in the superficial and deep vascular complexes of three full-term infants (A, 47 weeks postmenstrual age (PMA) male; B, 50 weeks PMA female; C, 56 weeks PMA female) were comparable to those of young children (D, 4-year-old male; E, 4-year-old female; F, 5- year-old female). G. OCT images were acquired at 80 weeks PMA from a preterm infant born at 26 weeks GA. Preserved inner retinal layers are evident at the foveal center. OCT-A with indistinct FAZ in the superficial capillary plexus (middle) and deep capillary plexus (right). H. OCT images were acquired at 56 weeks PMA from a preterm infant born at 26 weeks GA. Minimal preserved inner retinal layers are still present in the foveal center OCT-A with a distinct FAZ evident in the superficial capillary plexus (middle) and deep capillary plexus (right). SVC = superficial vascular complex; DVC = deep vascular complex. Adapted from Hsu et al. (2019a) and Kothari et al. (2020).
Fig. 15.
Fig. 15.. OCT segmentation strategies for en face visualization of the infant macular microvasculature using optical coherence tomography angiography.
Segmentation of the ICP and DCP by using two different methods. 1. By using the IPL/ INL junction as the reference boundary (ICP: from 8.7 μm above to 17.5 μm below the IPL/INL junction; DCP: 17.5 μm below the IPL/INL junction to the OPL/ONL junction). 2. By using the OPL/ONL junction as the reference boundary (ICP: from 8.7 μm above the IPL/INL junction to 35 μm above the OPL/ONL junction; DCP: from 35 μm above to at the OPL/ONL junction). A. The ICP and DCP vascular patterns are similar from an infant retina without macular edema when using both methods. B. The ICP and DCP vascular patterns demonstrate differences in the area of macular edema (arrow head). In the OCT B-scan with flow overlay, the optimal segmentation lines using the IPL/ INL junction as reference (C, magenta) and the OPL/ONL junction as reference (C, yellow) appeared close and nearly parallel to each other, while the reference lines were further apart in areas of macular edema (left side of D, magenta and yellow). By using the OPL/ONL junction as the reference boundary, most of the anomalous INL flow signals were assigned to the ICP. SCP = superficial capillary plexuses; ICP = intermediate capillary plexuses; DCP = deep capillary plexuses. Adapted from Patel et al. (2021).
Fig. 16.
Fig. 16.. Visualization of the three-layered perifoveal retinal microvasculature in preterm infants at around 40 weeks postmenstrual age using handheld optical coherence tomography angiography.
A-C. Three eyes were imaged with handheld investigational OCT-A device at 40 weeks PMA. Rows demonstrate the three-layered retinal microvasculature (SCP, ICP, DCP) and a merged image of all three levels (SCP: yellow; ICP: cyan; and DCP: magenta). The larger arterioles and venules were mainly observed in the SCP. The parafoveal ICP exhibited a closed, loop-like vascular pattern. The parafoveal DCP exhibited dendritic-like processes that extended toward the fovea. Note that vitreous hemorrhage caused the signal loss in B. SCP = superficial capillary plexuses; ICP = intermediate capillary plexuses; DCP = deep capillary plexuses. Adapted from Patel et al. (2021).
Fig. 17.
Fig. 17.. Optical coherence tomography angiography of the retinal microvasculature in children with a history of preterm or term birth.
A–E. OCT-A of eyes with a history of retinopathy of prematurity and laser treatment. F–J. OCT-A of eyes with a history of prematurity without laser therapy. K–O. OCT-A of healthy, full-term eyes. A smaller FAZ area was observed in children with history of prematurity with or without ROP. The corresponding B-scan of each image shows segmentation at the level of the superficial capillary plexus. The ages are 9, 9, 8, 6, and 6 years old for the top row; 8, 8, 7, 7, and 6 years old for the middle row; and 9, 9, 8, 7, and 5 years old for the bottom row (consecutively starting from the left). Abnormal spider-web-like retinal vasculature is evident in the foveal center in eyes with a history of prematurity. Adapted from Falavarjani et al. (2017).
Fig. 18.
Fig. 18.. Optical coherence tomography angiography metrics: computation of retinal vessel perfusion density and retinal vessel length density.
En face slabs of the superficial vascular complex, SVC (A), and deep vascular complex, DVC (B), were exported. Binarized images (C, D) were used to compute superficial (C) and deep (D) vascular complex vessel perfusion density. Skeletonized images (E, F) were used to compute the vessel length density of the superficial (E) and deep vascular complex (F).

Similar articles

Cited by

References

    1. Akerblom H, Larsson E, Eriksson U, Holmstrom G, 2011. Central macular thickness is correlated with gestational age at birth in prematurely born children. Br. J. Ophthalmol 95, 799–803. - PubMed
    1. Akula JD, Arellano IA, Swanson EA, Favazza TL, Bowe TS, Munro RJ, Ferguson RD, Hansen RM, Moskowitz A, Fulton AB, 2020. The fovea in retinopathy of prematurity. Invest. Ophthalmol. Vis. Sci 61, 28. - PMC - PubMed
    1. Akula JD, Hansen RM, Martinez-Perez ME, Fulton AB, 2007. Rod photoreceptor function predicts blood vessel abnormality in retinopathy of prematurity. Invest. Ophthalmol. Vis. Sci 48, 4351–4359. - PubMed
    1. Alabduljalil T, Westall CA, Reginald A, Farsiu S, Chiu SJ, Arshavsky A, Toth CA, Lam WC, 2019. Demonstration of anatomical development of the human macula within the first 5 years of life using handheld OCT. Int. Ophthalmol 39, 1533–1542. - PubMed
    1. Allingham MJ, Cabrera MT, O’Connell RV, Maldonado RS, Tran-Viet D, Toth CA, Freedman SF, El-Dairi MA, 2013. Racial variation in optic nerve head parameters quantified in healthy newborns by handheld spectral domain optical coherence tomography. J. Am. Assoc. Pediatr. Ophthalmol. Strabismus 17, 501–506. - PubMed

Publication types