

CHERRY: a Computational metHod for accuratE pRediction of virus-pRokarYotic interactions using a graph encoder-decoder model
- PMID: 35595715
- PMCID: PMC9487644
- DOI: 10.1093/bib/bbac182
CHERRY: a Computational metHod for accuratE pRediction of virus-pRokarYotic interactions using a graph encoder-decoder model
Abstract
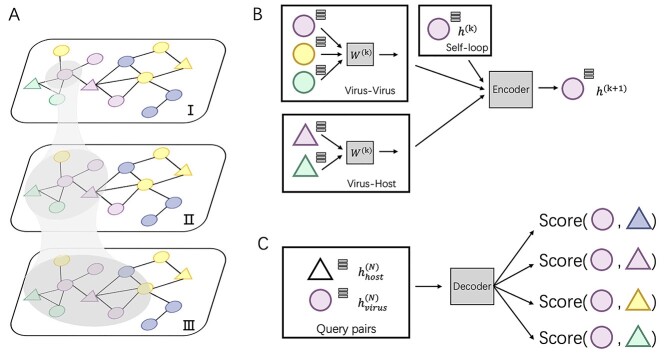
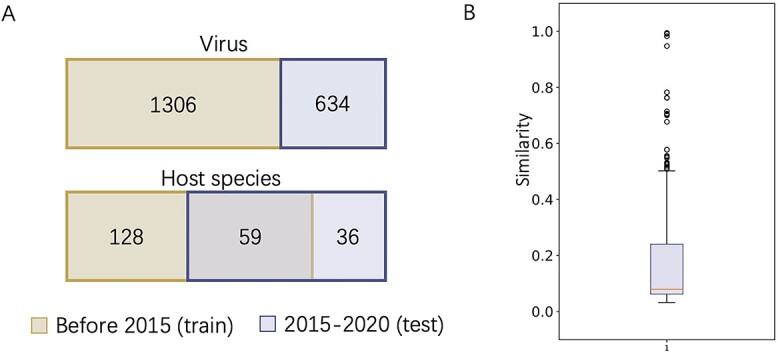
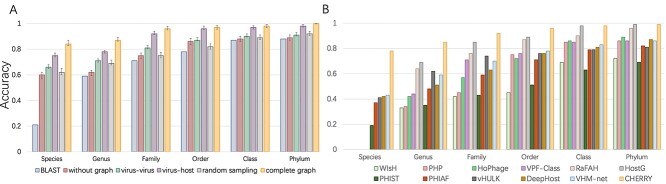
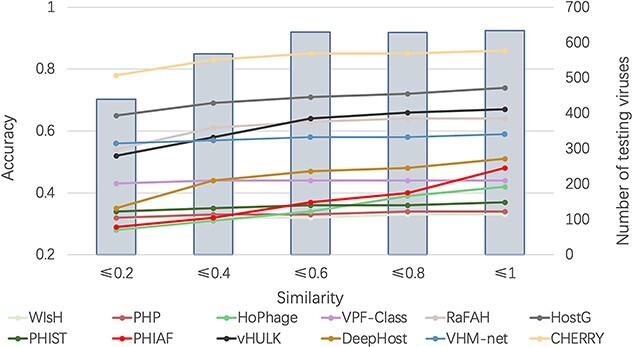
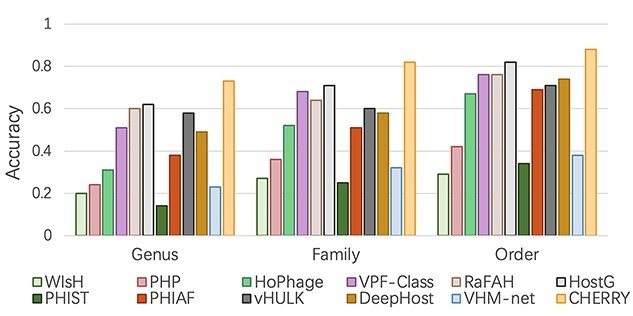
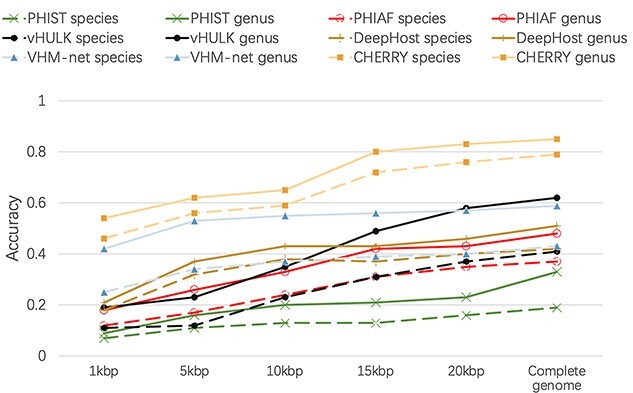
Prokaryotic viruses, which infect bacteria and archaea, are key players in microbial communities. Predicting the hosts of prokaryotic viruses helps decipher the dynamic relationship between microbes. Experimental methods for host prediction cannot keep pace with the fast accumulation of sequenced phages. Thus, there is a need for computational host prediction. Despite some promising results, computational host prediction remains a challenge because of the limited known interactions and the sheer amount of sequenced phages by high-throughput sequencing technologies. The state-of-the-art methods can only achieve 43% accuracy at the species level. In this work, we formulate host prediction as link prediction in a knowledge graph that integrates multiple protein and DNA-based sequence features. Our implementation named CHERRY can be applied to predict hosts for newly discovered viruses and to identify viruses infecting targeted bacteria. We demonstrated the utility of CHERRY for both applications and compared its performance with 11 popular host prediction methods. To our best knowledge, CHERRY has the highest accuracy in identifying virus-prokaryote interactions. It outperforms all the existing methods at the species level with an accuracy increase of 37%. In addition, CHERRY's performance on short contigs is more stable than other tools.
Keywords: deep learning; graph convolutional network; link prediction; phage host prediction.
© The Author(s) 2022. Published by Oxford University Press.
Figures
Similar articles
-
Predicting the hosts of prokaryotic viruses using GCN-based semi-supervised learning.BMC Biol. 2021 Nov 24;19(1):250. doi: 10.1186/s12915-021-01180-4. BMC Biol. 2021. PMID: 34819064 Free PMC article.
-
PhaTYP: predicting the lifestyle for bacteriophages using BERT.Brief Bioinform. 2023 Jan 19;24(1):bbac487. doi: 10.1093/bib/bbac487. Brief Bioinform. 2023. PMID: 36659812 Free PMC article.
-
Prokaryotic virus host prediction with graph contrastive augmentaion.PLoS Comput Biol. 2023 Dec 1;19(12):e1011671. doi: 10.1371/journal.pcbi.1011671. eCollection 2023 Dec. PLoS Comput Biol. 2023. PMID: 38039280 Free PMC article.
-
Computational approaches to predict bacteriophage-host relationships.FEMS Microbiol Rev. 2016 Mar;40(2):258-72. doi: 10.1093/femsre/fuv048. Epub 2015 Dec 9. FEMS Microbiol Rev. 2016. PMID: 26657537 Free PMC article. Review.
-
Ecology of prokaryotic viruses.FEMS Microbiol Rev. 2004 May;28(2):127-81. doi: 10.1016/j.femsre.2003.08.001. FEMS Microbiol Rev. 2004. PMID: 15109783 Review.
Cited by
-
Correlation between the gut microbiome and neurodegenerative diseases: a review of metagenomics evidence.Neural Regen Res. 2024 Apr;19(4):833-845. doi: 10.4103/1673-5374.382223. Neural Regen Res. 2024. PMID: 37843219 Free PMC article. Review.
-
IPEV: identification of prokaryotic and eukaryotic virus-derived sequences in virome using deep learning.Gigascience. 2024 Jan 2;13:giae018. doi: 10.1093/gigascience/giae018. Gigascience. 2024. PMID: 38649300 Free PMC article.
-
Comparative Genomics of Closely-Related Gordonia Cluster DR Bacteriophages.Viruses. 2022 Jul 27;14(8):1647. doi: 10.3390/v14081647. Viruses. 2022. PMID: 36016269 Free PMC article.
-
Identification and classification of the genomes of novel microviruses in poultry slaughterhouse.Front Microbiol. 2024 May 2;15:1393153. doi: 10.3389/fmicb.2024.1393153. eCollection 2024. Front Microbiol. 2024. PMID: 38756731 Free PMC article.
-
Protein Set Transformer: A protein-based genome language model to power high diversity viromics.bioRxiv [Preprint]. 2025 Jun 4:2024.07.26.605391. doi: 10.1101/2024.07.26.605391. bioRxiv. 2025. PMID: 39131363 Free PMC article. Preprint.
