Epithelial to mesenchymal transition influences fibroblast phenotype in colorectal cancer by altering miR-200 levels in extracellular vesicles
- PMID: 35595718
- PMCID: PMC9122835
- DOI: 10.1002/jev2.12226
Epithelial to mesenchymal transition influences fibroblast phenotype in colorectal cancer by altering miR-200 levels in extracellular vesicles
Abstract
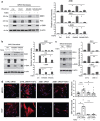
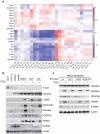
Colorectal cancer (CRC) with a mesenchymal gene expression signature has the greatest propensity for distant metastasis and is characterised by the accumulation of cancer-associated fibroblasts in the stroma. We investigated whether the epithelial to mesenchymal transition status of CRC cells influences fibroblast phenotype, with a focus on the transfer of extracellular vesicles (EVs), as a controlled means of cell-cell communication. Epithelial CRC EVs suppressed TGF-β-driven myofibroblast differentiation, whereas mesenchymal CRC EVs did not. This was driven by miR-200 (miR-200a/b/c, -141), which was enriched in epithelial CRC EVs and transferred to recipient fibroblasts. Ectopic miR-200 expression or ZEB1 knockdown, in fibroblasts, similarly suppressed myofibroblast differentiation. Supporting these findings, there was a strong negative correlation between miR-200 and myofibroblastic markers in a cohort of CRC patients in the TCGA dataset. This was replicated in mice, by co-injecting epithelial or mesenchymal CRC cells with fibroblasts and analysing stromal markers of myofibroblastic phenotype. Fibroblasts from epithelial tumours contained more miR-200 and expressed less ACTA2 and FN1 than those from mesenchymal tumours. As such, these data provide a new mechanism for the development of fibroblast heterogeneity in CRC, through EV-mediated transfer of miRNAs, and provide an explanation as to why CRC tumours with greater metastatic potential are CAF rich.
Keywords: MiR-200; Zeb1; cancer-associated fibroblast; colorectal cancer; epithelial to mesenchymal transition; extracellular vesicle; stroma.
© 2022 The Authors. Journal of Extracellular Vesicles published by Wiley Periodicals, LLC on behalf of the International Society for Extracellular Vesicles.
Conflict of interest statement
The authors declare no competing interests.
Figures


Similar articles
-
miR-143-3p shuttled by M2 macrophage-derived extracellular vesicles induces progression of colorectal cancer through a ZC3H12A/C/EBPβ axis-dependent mechanism.Int Immunopharmacol. 2023 Jun;119:110137. doi: 10.1016/j.intimp.2023.110137. Epub 2023 Apr 29. Int Immunopharmacol. 2023. PMID: 37126984
-
Myofibroblast transdifferentiation is associated with changes in cellular and extracellular vesicle miRNA abundance.PLoS One. 2021 Nov 11;16(11):e0256812. doi: 10.1371/journal.pone.0256812. eCollection 2021. PLoS One. 2021. PMID: 34762649 Free PMC article.
-
MiR-200a regulates epithelial to mesenchymal transition-related gene expression and determines prognosis in colorectal cancer patients.Br J Cancer. 2014 Mar 18;110(6):1614-21. doi: 10.1038/bjc.2014.51. Epub 2014 Feb 6. Br J Cancer. 2014. PMID: 24504363 Free PMC article.
-
The role of the miR-200 family in epithelial-mesenchymal transition in colorectal cancer: a systematic review.Int J Cancer. 2018 Jun 15;142(12):2501-2511. doi: 10.1002/ijc.31282. Epub 2018 Feb 21. Int J Cancer. 2018. PMID: 29388209
-
Small extracellular vesicles promote the formation of the pre-metastatic niche through multiple mechanisms in colorectal cancer.Cell Cycle. 2024 Jan;23(2):131-149. doi: 10.1080/15384101.2024.2311501. Epub 2024 Feb 11. Cell Cycle. 2024. PMID: 38341861 Free PMC article. Review.
Cited by
-
Long non-coding RNA LINC00930 targeting miR-6792-3p/ZBTB16 regulates the proliferation and EMT of pancreatic cancer.BMC Cancer. 2024 May 24;24(1):638. doi: 10.1186/s12885-024-12365-9. BMC Cancer. 2024. PMID: 38789960 Free PMC article.
-
Emerging roles of non-coding RNAs in fibroblast to myofibroblast transition and fibrotic diseases.Front Pharmacol. 2024 Jul 24;15:1423045. doi: 10.3389/fphar.2024.1423045. eCollection 2024. Front Pharmacol. 2024. PMID: 39114349 Free PMC article. Review.
-
A primer on cancer-associated fibroblast mechanics and immunosuppressive ability.Explor Target Antitumor Ther. 2023;4(1):17-27. doi: 10.37349/etat.2023.00120. Epub 2023 Feb 20. Explor Target Antitumor Ther. 2023. PMID: 36937319 Free PMC article.
-
Fibroblast diversity and plasticity in the tumor microenvironment: roles in immunity and relevant therapies.Cell Commun Signal. 2023 Sep 18;21(1):234. doi: 10.1186/s12964-023-01204-2. Cell Commun Signal. 2023. PMID: 37723510 Free PMC article. Review.
-
Unraveling the role of cancer-associated fibroblasts in colorectal cancer.World J Gastrointest Oncol. 2024 Dec 15;16(12):4565-4578. doi: 10.4251/wjgo.v16.i12.4565. World J Gastrointest Oncol. 2024. PMID: 39678792 Free PMC article. Review.
References
-
- Arnold, M. , Sierra, M. S. , Laversanne, M. , Soerjomataram, I. , Jemal, A. , & Bray, F. (2017). Global patterns and trends in colorectal cancer incidence and mortality. Gut, 66(4), 683–691. - PubMed
-
- Ayala, G. , Tuxhorn, J. A. , Wheeler, T. M. , Frolov, A. , Scardino, P. T. , Ohori, M. , Wheeler, M. , Spitler, J. , & Rowley, D. R. (2003). Reactive stroma as a predictor of biochemical‐free recurrence in prostate cancer. Clinical Cancer Research, 9(13), 4792–4801. - PubMed
-
- Becht, E. , De Reyniès, A. , Giraldo, N. A. , Pilati, C. , Buttard, B. , Lacroix, L. , Selves, J. , Sautès‐Fridman, C. , Laurent‐Puig, P. , & Fridman, W. H. (2016). Immune and stromal classification of colorectal cancer is associated with molecular subtypes and relevant for precision immunotherapy. Clinical Cancer Research, 22(16), 4057–4066. - PubMed
Publication types
MeSH terms
Substances
Grants and funding
LinkOut - more resources
Full Text Sources
Medical
Research Materials
Miscellaneous

