. 2022 May 20;12(5):80.
doi: 10.1038/s41408-022-00675-9.

Pirtobrutinib inhibits wild-type and mutant Bruton's tyrosine kinase-mediated signaling in chronic lymphocytic leukemia

Affiliations

Pirtobrutinib inhibits wild-type and mutant Bruton's tyrosine kinase-mediated signaling in chronic lymphocytic leukemia

Burcu Aslan et al. Blood Cancer J. .

Abstract

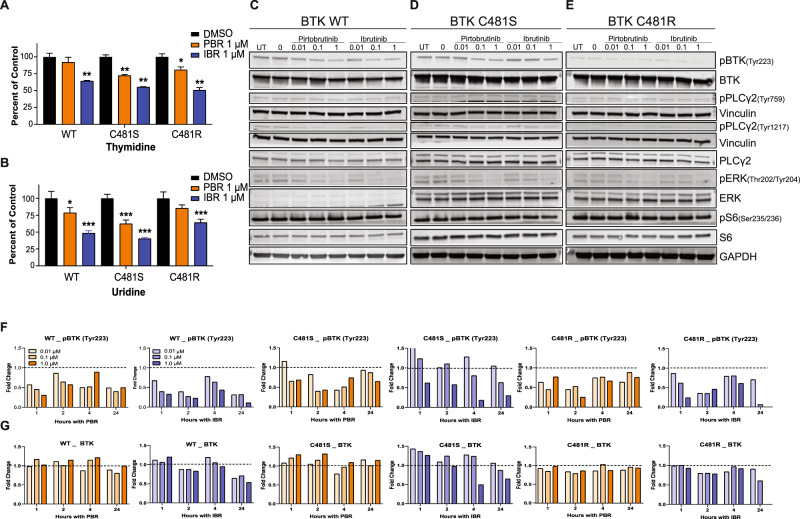
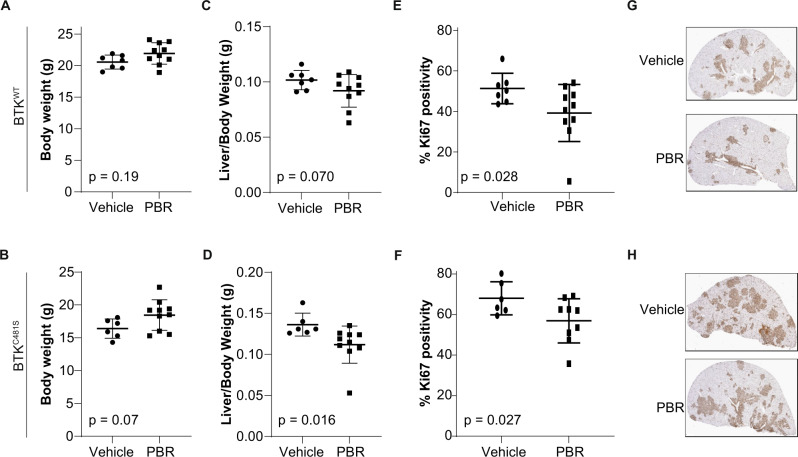
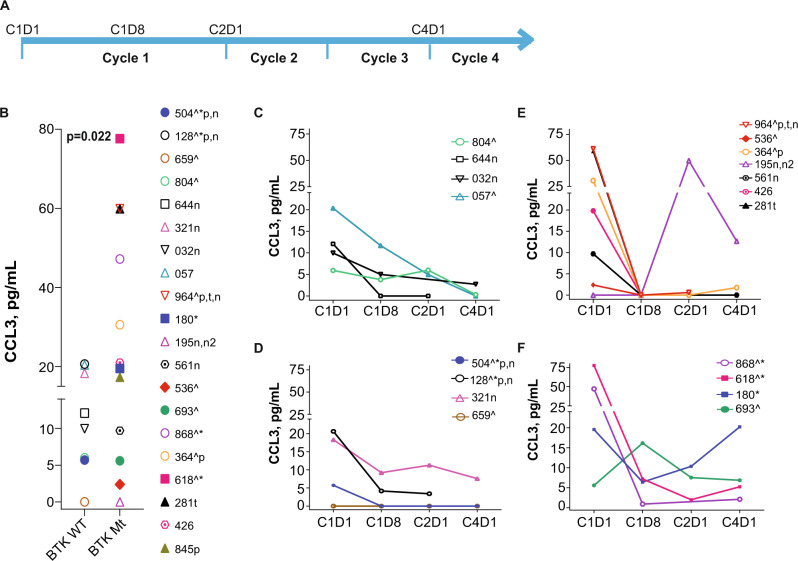
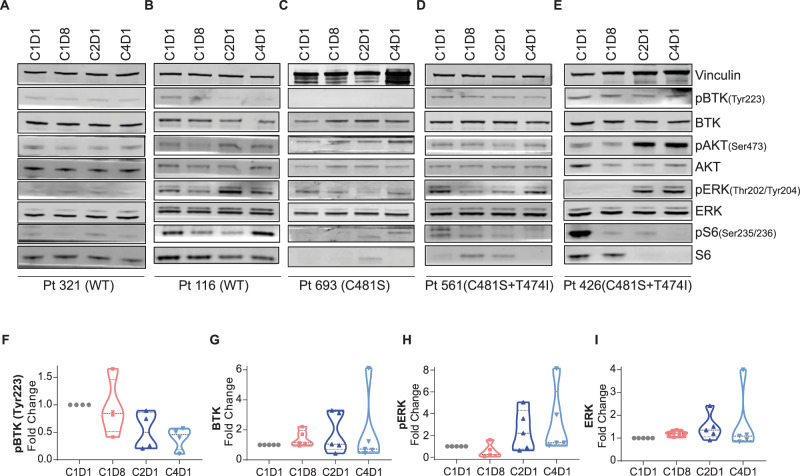
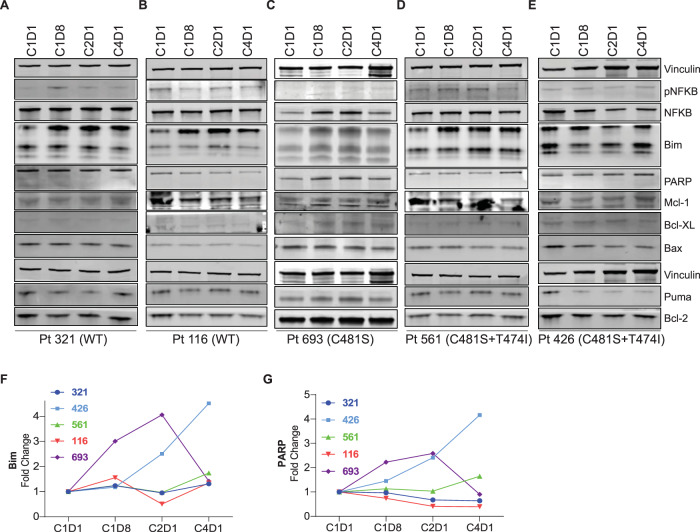
Pirtobrutinib (LOXO-305), a reversible inhibitor of Bruton's tyrosine kinase (BTK), was designed as an alternative strategy to treat ibrutinib-resistant disease that develops due to C481 kinase domain mutations. The clinical activity of pirtobrutinib has been demonstrated in CLL, but the mechanism of action has not been investigated. We evaluated pirtobrutinib in 4 model systems: first, MEC-1, a CLL cell line overexpressing BTKWT, BTKC481S, or BTKC481R; second, murine models driven by MEC-1 overexpressing BTKWT or BTKC481S; third, in vitro incubations of primary CLL cells; and finally, CLL patients during pirtobrutinib therapy (NCT03740529, ClinicalTrials.gov). Pirtobrutinib inhibited BTK activation as well as downstream signaling in MEC-1 isogenic cells overexpressing BTKWT, BTKC481S, or BTKC481R. In mice, overall survival was short due to aggressive disease. Pirtobrutinib treatment for 2 weeks led to reduction of spleen and liver weight in BTKWT and BTKC481S cells, respectively. In vitro incubations of CLL cells harboring wild-type or mutant BTK had inhibition of the BCR pathway with either ibrutinib or pirtobrutinib treatment. Pirtobrutinib therapy resulted in inhibition of BTK phosphorylation and downstream signaling initially in all cases irrespective of their BTK profile, but these effects started to revert in cases with other BCR pathway mutations such as PLCG2 or PLEKHG5. Levels of CCL3 and CCL4 in plasma were marginally higher in patients with mutated BTK; however, there was a bimodal distribution. Both chemokines were decreased at early time points and mimicked BCR pathway protein changes. Collectively, these results demonstrate that pirtobrutinib is an effective BTK inhibitor for CLL harboring wild-type or mutant BTK as observed by changes in CCL3 and CCL4 biomarkers and suggest that alterations in BCR pathway signaling are the mechanism for its clinical effects. Long-term evaluation is needed for BTK gatekeeper residue variation along with pathologic kinase substitution or mutations in other proteins in the BCR pathway.


Conflict of interest statement

Specifically, for the current investigations, VG received sponsored research agreement from Loxo Oncology (now a subsidiary of Lilly Oncology). Previously, for other investigations, VG received research funding from Pharmacyclics, Acerta, Gilead Sciences, Sunesis, Infinity, AbbVie, and Clear Creek Bio. WGW received research funding from GSK/Novartis, AbbVie, Genentech, Pharmacyclics, AstraZeneca/Acerta Pharma, Gilead Sciences, Juno Therapeutics, KITE Pharma, Sunesis, Miragen, Oncternal Therapeutics, Cyclacel, Loxo Oncology, Janssen, and Xencor. The remaining authors declare no competing financial interests.

Figures

Fig. 1
Fig. 1. Effects of pirtobrutinib on global DNA and RNA synthesis and inhibition of proximal BCR pathway in MEC-1 cells that overexpress wild-type or mutant BTK.
A and B Impact of pirtobrutinib or ibrutinib on DNA and RNA synthesis. Exponentially growing and GFP sorted MEC-1 cells overexpressing wild-type (WT), C481S, or C481R BTK were treated with 1 µM drug for 24 h. [3H]thymidine and [3H]uridine were used to determine incorporation into DNA and RNA, respectively. Data are expressed as percentage of DMSO-treated control cells. *p ≤ 0.05; **p ≤ 0.01; ***p ≤ 0.005. C–E Effect of pirtobrutinib or ibrutinib on BCR pathway signaling. Protein extracts were prepared from drug-treated cells and were subjected to immunoblot assays to determine levels of pBTK inhibition and downstream signaling of BTK in MEC-1 cells with BTKWT (C), BTKC481S (D), or BTKC481R (E). Vinculin and GAPDH were used as the loading controls. F and G Dose- and time-dependent inhibition of BTK phosphorylation after treatment with pirtobrutinib (orange bars) or ibrutinib (blue bars) in MEC-1 cells overexpressing BTKWT, BTKC481S, and BTKC481R. Cells were treated at three different concentrations of drug at four different time points. Densitometry values are presented as percentage of DMSO-treated control, which is set at 1 (dashed line). PBR pirtobrutinib, IBR ibrutinib.
Fig. 2
Fig. 2. Impact of pirtobrutinib in murine model expressing MEC-1 cells harboring either BTKWT or BTKC481S.
MEC-1 cells overexpressing BTKWT or mutant BTK (1 × 107 cells/mouse) were injected into 8-week-old Rag2−/−γc−/− female mice and the animals were monitored daily. At day 10, mice were randomly assigned to groups: vehicle (n = 7 or n = 6 in BTKWT and BTKC481S models, respectively) and pirtobrutinib (n = 10, in both models), and treatment started. The experiment was terminated at day 26. At the endpoint, mice were euthanized, and spleens, livers, and left femurs were collected. Cells were isolated from spleens and bone marrow and stained with a monoclonal antibody against PE-labeled human CD19 Clone J3119 (Beckman Coulter) followed by flow cytometry analysis. Body weight A in BTKWT model and B in BTKC481S model (P = 0.19 and 0.07, two-tailed Student t-test). C and D Liver to body weight ratios of mice. Percentage Ki67 positivity in livers (P = 0.07 and 0.016, one-tailed Student t-test). E in BTKWT model (n = 7 for vehicle, n = 10 for pirtobrutinib) (P = 0.028, one-tailed Student t-test) and F in BTKC481S model (n = 6 for vehicle, n = 10 pirtobrutinib) (P = 0.027, one-tailed Student t-test). G and H Representative images of proliferation marker Ki-67-stained slides of livers in G BTKWT and H BTKC481S models before and after pirtobrutinib treatment. PBR pirtobrutinib. First row: representative images of vehicle group (top) and pirtobrutinib-treated group (lower) in BTKWT model. Second row: representative images of vehicle group (top) and pirtobrutinib-treated-group (lower) in BTKC481S model.
Fig. 3
Fig. 3. Inhibition of BCR and non-BCR pathways in CLL cells from patients with BTKWT or cysteine 481 residue mutant disease after incubations with ibrutinib or pirtobrutinib in vitro.
Patient blood samples were collected into Vacutainer glass green-top blood collection tubes; cells were isolated by Ficoll-Hypaque density centrifugation and were incubated with pirtobrutinib and ibrutinib at two concentrations (0.1 and 1 µM) for 24 h. A Apoptotic cell death in primary CLL lymphocytes of four patients. Freshly isolated cells were incubated for 24 h with indicated concentrations of pirtobrutinib. Cells were stained with annexin V–FITC and propidium iodide (PI), and apoptotic (annexin V+) cells were determined by flow cytometry. Cell death in DMSO-treated samples was subtracted from inhibitor-treated samples. BE Effect of pirtobrutinib on BCR pathway proteins. Protein extracts were subjected to immunoblot assays to determine levels of phospho-BTK (Y223), BTK, phospho-ERK (T202/Y204), ERK, phospho-S6 (Ser235/236), and S6. F Graphs depict densitometry analysis for immunoblot results for phospho-BTK, BTK, phospho-ERK, ERK presented in BE. Solid symbols represent the samples from cells treated with pirtobrutinib (unique patient ID followed by “P”), and open symbols represent samples from cells treated with ibrutinib (unique patient ID followed by “I”). GI Effect of pirtobrutinib on non-BCR pathway proteins. Protein extracts were subjected to immunoblot assays to determine levels of phospho-NFkB, NFkB, Mcl-1, Bcl-XL, Bcl-2, Puma, Bax, and Bim. Vinculin was used as loading control. PBR pirtobrutinib, IBR ibrutinib.
Fig. 4
Fig. 4. Inhibition of CCL3 chemokine production during pirtobrutinib therapy in CLL patients previously treated with irreversible BTK inhibitors.
Peripheral blood samples were collected prior to therapy (C1D1) and 1 week (C1D8), 4 weeks or one cycle (C2D1), and three cycles (C4D1) after the start of pirtobrutinib. A Schema depicts the time points that samples were collected in the study. This study is registered at ClinicalTrials.gov (identifier NCT03740529). Plasma was collected at indicated time points and used for chemokine assays. CCL3 (Mip-1α) B–F levels were quantitated using Luminex XMap Technology as described under Supplementary Methods. B CCL3 levels at baseline (C1D1) in plasma of patients with either WT BTK or mutant BTK (P = 0.022, one-tailed Welch’s t-test) (C) and (D) Changes in CCL3 levels during therapy in patients harboring WT BTK CLL cells without PLCG2 or PLEKHG5 mutations (C) or in patients harboring WT BTK CLL cells with PLCG2 and/or PLEKHG5 mutations (D). E and F Changes in CCL3 levels during therapy in patients harboring mutant BTK CLL cells without PLCG2 or PLEKHG5 mutations (E) or in patients harboring WT BTK CLL cells with PLCG2 and/or PLEKHG5 mutations (F). Study included patients with WT BTK (n = 8) and mutant BTK (n = 12). BTK double kinase mutants are depicted by solid squares (patients 618 [BTKC481S+C481R] and 180 [BTKC481F+C481S]). BTK kinase domain as well as gatekeeper mutants are indicated by a hexagon with a dot (patients 426 [BTKC481S+T474] and 561 [BTKC481S+T474]). Patient 845 received pirtobrutinib and venetoclax combination and was not included in the time course; patients 364 and 128 had Richter transformation. Patients’ additional mutations are indicated in the key by a caret (TP53), navy blue color (BCL2), n (NOTCH1), n2 (NOTCH2), and asterisk (PLCG2), p indicates 17pdel and t indicates trisomy 12.
Fig. 5
Fig. 5. Inhibition of CCL4 chemokine production during pirtobrutinib therapy in CLL patients previously treated with irreversible BTK inhibitors.
Peripheral blood samples were collected prior to therapy (C1D1) and 1 week (C1D8), 4 weeks or one cycle (C2D1), and three cycles (C4D1) after the start of pirtobrutinib. A Schema depicts the time points that samples were collected in the study. This study is registered at ClinicalTrials.gov (identifier NCT03740529). Plasma was collected at indicated time points and used for chemokine assays. CCL4 (Mip-1β) BF levels were quantitated using Luminex XMap Technology as described under Supplementary Methods. B CCL4 levels at baseline (C1D1) in plasma of patients with either WT BTK or mutant BTK. (P = 0.026, One-tailed Welch’s t-test). C and D Changes in CCL4 levels during therapy in patients harboring WT-BTK CLL cells without PLCG2 or PLEKHG5 mutations (C) or in patients harboring WT BTK CLL cells with PLCG2 and/or PLEKHG5 mutations (D). E and F Changes in CCL4 levels during therapy in patients harboring mutant BTK CLL cells without PLCG2 or PLEKHG5 mutations (E) or in patients harboring WT BTK CLL cells with PLCG2 and/or PLEKHG5 mutations (F). Study included patients with WT BTK (n = 8) and mutant BTK (n = 12). BTK double kinase mutants are depicted by solid squares (patients 618 [BTKC481S+C481R] and 180 [BTKC481F+C481S]). BTK kinase domain as well as gatekeeper mutants are indicated by a hexagon with a dot (patients 426 [BTKC481S+T474] and 561 [BTKC481S+T474]). Patient 845 received pirtobrutinib and venetoclax combination and was not included in the time course; patients 364 and 128 had Richter transformation. Patients’ additional mutations are indicated in the key by a caret (TP53), navy blue color (BCL2), n (NOTCH1), n2 (NOTCH2), and asterisk (PLCG2); p indicates 17pdel and t indicates trisomy 12.
Fig. 6
Fig. 6. Inhibition of BCR pathway during pirtobrutinib therapy in CLL patients previously treated with irreversible BTK inhibitors.
Peripheral blood samples were collected prior to therapy (C1D1) and 1 week (C1D8), 4 weeks or one cycle (C2D1), and three cycles (C4D1) after the start of pirtobrutinib. Samples were processed and cells were isolated by Ficoll-Hypaque density centrifugation. AE Effect of pirtobrutinib on BCR pathway proteins. Protein extracts were subjected to immunoblot assays to determine levels of phospho-BTK (Y223), BTK, phospho-AKT, AKT, phospho-ERK (T202/Y204), ERK, phospho-S6 (Ser235/236), and S6. Vinculin was used as loading control. FI Violin plots depicting changes in phospho-BTK (F), total BTK (G), phospho-ERK (H), and total ERK (I) during therapy. Proteins were quantitated, normalized with vinculin, and presented as fold change to baseline (C1D1) value.
Fig. 7
Fig. 7. Alterations in non-BCR proteins during pirtobrutinib therapy in CLL patients with ibrutinib-resistant disease.
Patient blood samples were collected (as in Fig. 6), and cells were isolated by Ficoll-Hypaque density centrifugation. AE Protein extracts were subjected to immunoblot assays to determine levels of phospho-NFkB, NFkB, Mcl-1, Bcl-XL, Bcl-2, Bax, Puma, PARP, and Bim. Vinculin was used as loading control. F, G Graphs depict densitometry analysis for immunoblots results of Bim (F) and PARP (G). Each patient is represented by a colored symbol and a unique ID.

Similar articles

Cited by

References

    1. Kipps TJ, Stevenson FK, Wu CJ, Croce CM, Packham G, Wierda WG, et al. Chronic lymphocytic leukaemia. Nat Rev Dis Prim. 2017;3:1–22.. - PMC - PubMed
    1. Stevenson FK, Krysov S, Davies AJ, Steele AJ, Packham G. B-cell receptor signaling in chronic lymphocytic leukemia blood. Blood J Am Soc Hematol. 2011;118:4313–20. - PubMed
    1. Burger JA. Treatment of chronic lymphocytic leukemia. N Engl J Med. 2020;383:460–73.. doi: 10.1056/NEJMra1908213. - DOI - PubMed
    1. Burger JA, Tedeschi A, Barr PM, Robak T, Owen C, Ghia P, et al. Ibrutinib as initial therapy for patients with chronic lymphocytic leukemia. N Engl J Med. 2015;373:2425–37. doi: 10.1056/NEJMoa1509388. - DOI - PMC - PubMed
    1. Byrd JC, Furman RR, Coutre SE, Flinn IW, Burger JA, Blum KA, et al. Targeting BTK with ibrutinib in relapsed chronic lymphocytic leukemia. N Engl J Med. 2013;369:32–42. doi: 10.1056/NEJMoa1215637. - DOI - PMC - PubMed

Publication types

MeSH terms

Substances

Associated data