. 2022 May 20;13(1):2834.
doi: 10.1038/s41467-022-30543-w.

Nanoparticle-enhanced radiotherapy synergizes with PD-L1 blockade to limit post-surgical cancer recurrence and metastasis

Affiliations

Nanoparticle-enhanced radiotherapy synergizes with PD-L1 blockade to limit post-surgical cancer recurrence and metastasis

Xin Guan et al. Nat Commun. .

Abstract

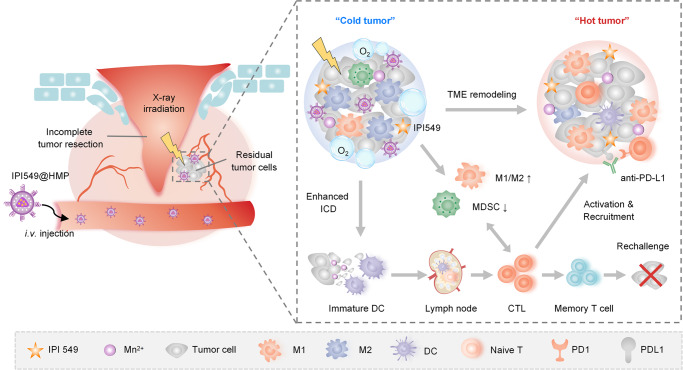
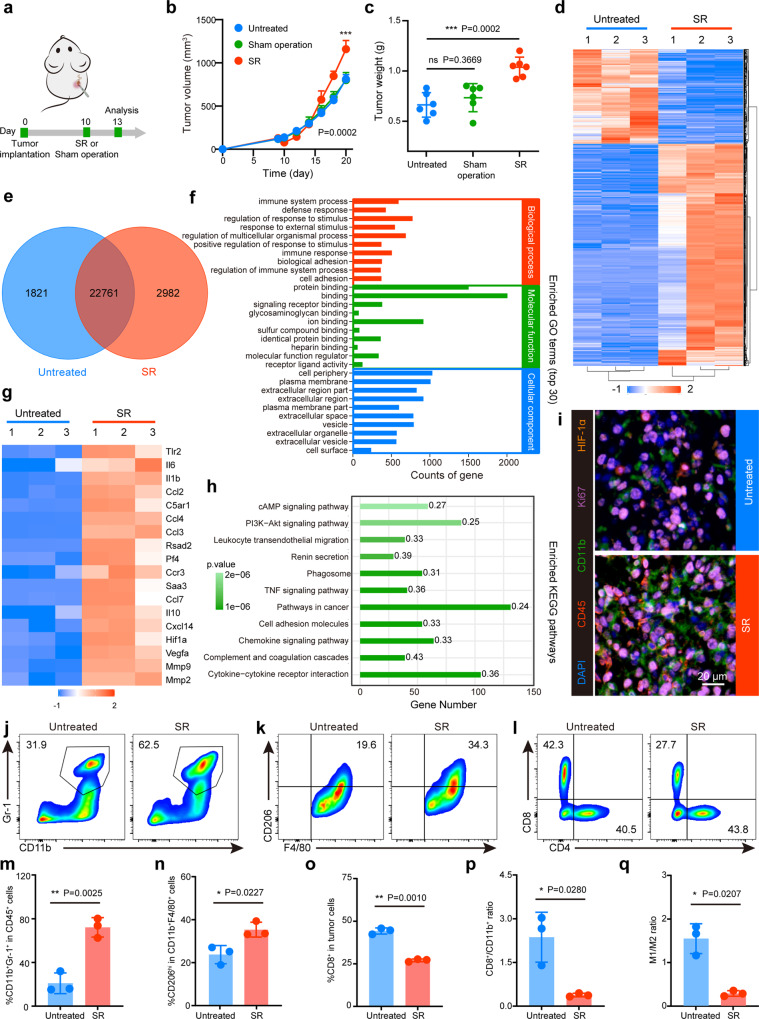
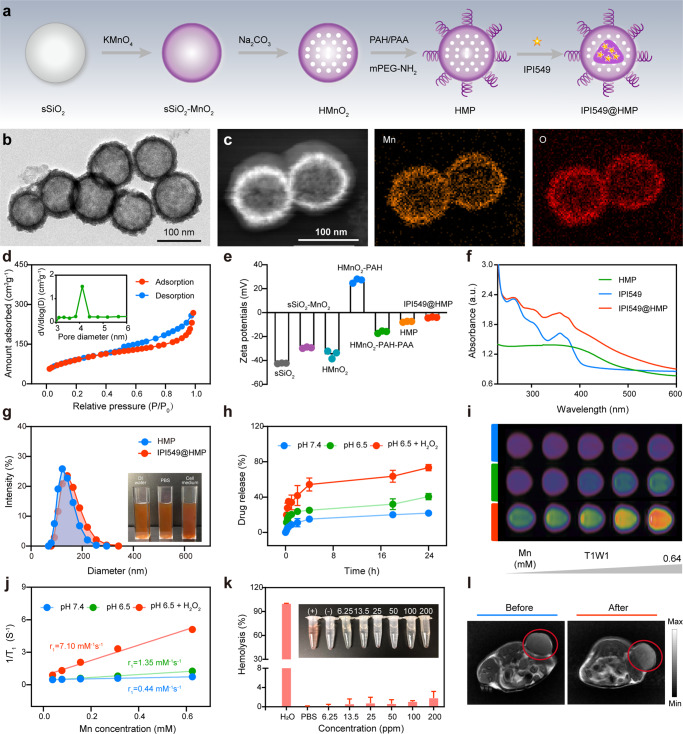
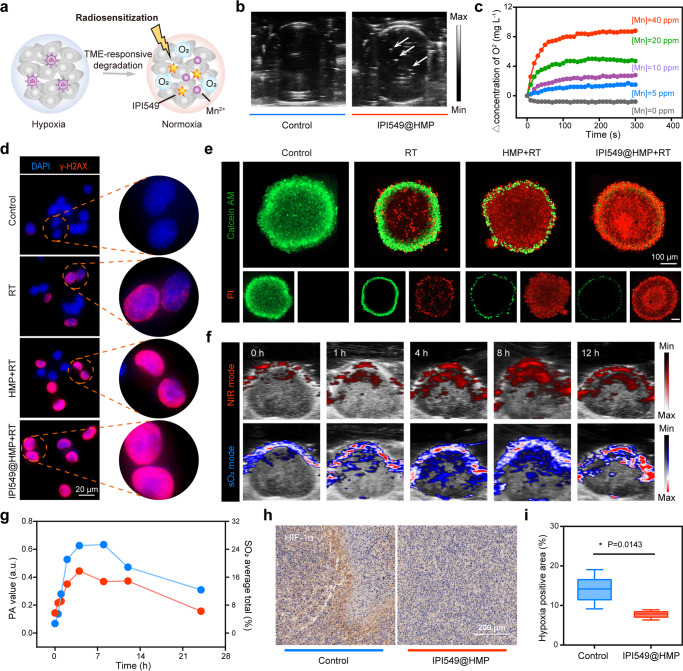
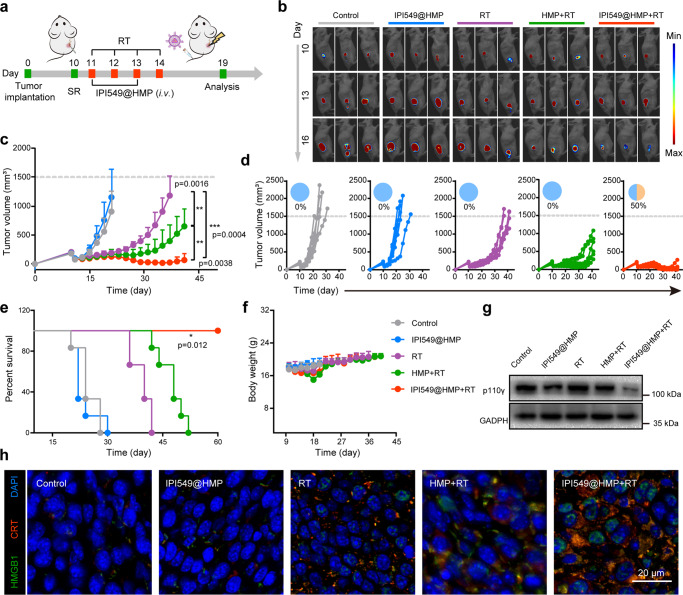
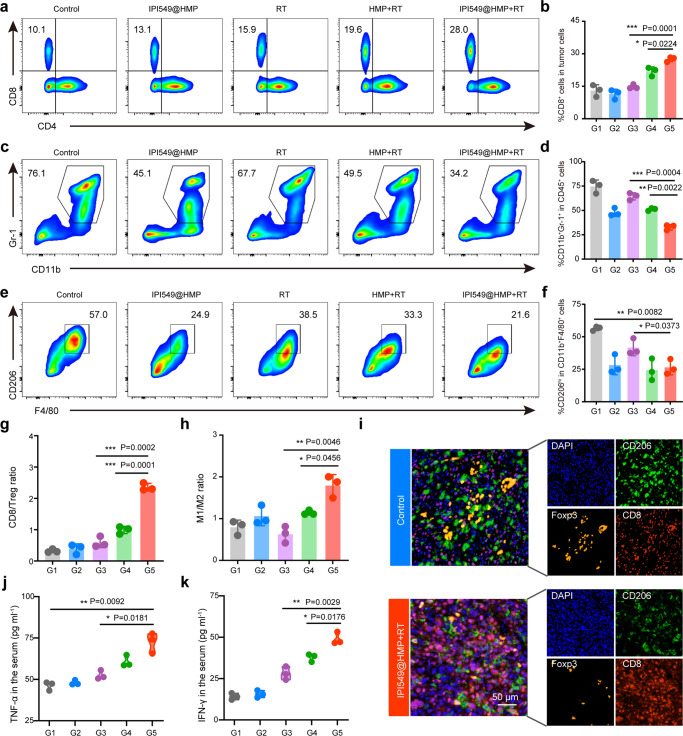
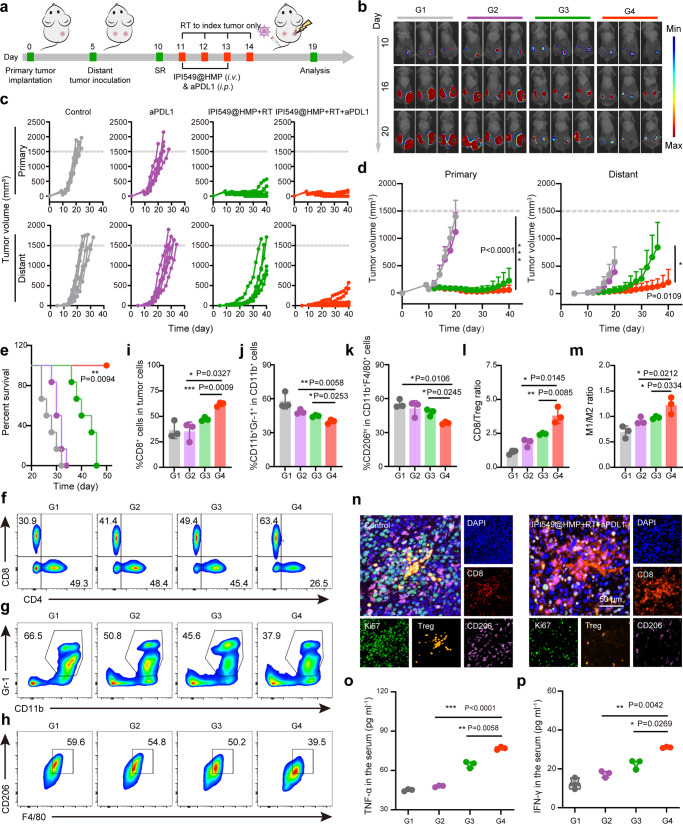
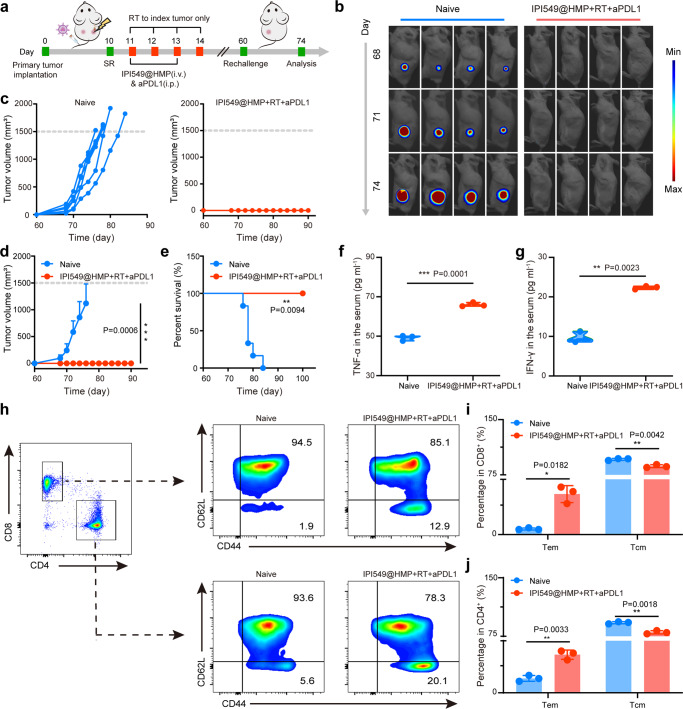
Cancer recurrence after surgical resection (SR) is a considerable challenge, and the biological effect of SR on the tumor microenvironment (TME) that is pivotal in determining postsurgical treatment efficacy remains poorly understood. Here, with an experimental model, we demonstrate that the genomic landscape shaped by SR creates an immunosuppressive milieu characterized by hypoxia and high-influx of myeloid cells, fostering cancer progression and hindering PD-L1 blockade therapy. To address this issue, we engineer a radio-immunostimulant nanomedicine (IPI549@HMP) capable of targeting myeloid cells, and catalyzing endogenous H2O2 into O2 to achieve hypoxia-relieved radiotherapy (RT). The enhanced RT-mediated immunogenic effect results in postsurgical TME reprogramming and increased susceptibility to anti-PD-L1 therapy, which can suppress/eradicate locally residual and distant tumors, and elicits strong immune memory effects to resist tumor rechallenge. Our radioimmunotherapy points to a simple and effective therapeutic intervention against postsurgical cancer recurrence and metastasis.


Conflict of interest statement

The authors declare no competing interests.

Figures

Fig. 1
Fig. 1. Schematic illustration of engineering radioimmunostimulant nanomedicine synergizing with PD-L1 blockade for postsurgical cancer immunotherapy.
Surgical resection (SR) creates an immunosuppressive milieu characterized by hypoxia and high-influx of myeloid cells. The radioimmunostimulant HMnO2-based nanoplatform (IPI549@HMP) involved in this strategy enables hypoxia-relieved radiotherapy and pH-triggered release of IPI549 capable of targeting myeloid cells, which subsequently remodels immunosuppressive postresection TME into an immunostimulatory phenotype and heightens susceptibility to anti-PD-L1 therapy. IPI549@HMP-augmented radioimmunotherapy in combination with anti-PD-L1 leads to significant inhibition of locally residual and distant tumors, and elicits strong immune memory effect to completely resist tumor rechallenge. ICD, immunogenic cell death; M1, M1-like macrophage; M2, M2-like macrophage; MDSC, myeloid-derived suppressor cell; DC, dendritic cell; CTL, cytotoxic T lymphocyte.
Fig. 2
Fig. 2. SR-driven immunosuppression accelerates local tumor progression.
a Schematic illustration of surgical resection (SR) treatment. 1×10⁶ CT26 cells were subcutaneously injected into the right flank of BALB/c mice. SR or sham operation was conducted on the right tumor or left skin, respectively, on day 10 postinoculation. b Residual tumor growth kinetics of mice in Untreated, SR and Sham operation groups (n = 6 mice). c Weight of the excised tumor on day 20 after varied treatments (n = 6 mice). d, e Cluster analysis (d) and Venn diagram (e) of differential expression genes in RNAseq between untreated and SR-treated tumors three days post treatment (n = 3 mice). Red and blue colors represent upregulated or downregulated genes, respectively. f Significant enrichment in gene ontology (GO) terms (top 30, n = 3 mice). g Heatmap of differentially expressed genes associated with tumor progression and immunosuppression (n = 3 mice). Red and blue colors represent upregulated or downregulated genes, respectively. h Kyoto Encyclopedia of Genes and Genomes (KEGG) enrichment histogram of differentially expressed genes (Statistical difference was calculated using Fisher’s exact test, n = 3 mice). i Representative polychromatic immunofluorescent staining images of tumors from three biologically independent samples showing CD45+ (red), CD11b+ (green), Ki67+ (purple) and HIF-1α+ (orange) cells infiltration for Untreated and SR tumors three days post-treatment. jo Representative flow cytometric images and the corresponding quantification of MDSCs (CD11b+Gr-1+CD45+) (j, m), TAMs-M2 (CD206hiCD11b+F4/80+CD45+) (k, n) and CTLs (CD8+CD3+CD45+) (l, o). p The ratio of CD8+ cells to CD11b+ MDSCs in tumors. q The ratio of M1 to M2 in tumors. SR, surgical resection; MDSCs, myeloid-derived suppressor cells; TAMs-M2, M2-like macrophages; TAMs-M1, M1-like macrophages; CTLs, cytotoxic T lymphocytes. Data were expressed as means ± SD (n = 3 biologically independent samples). Statistical difference was calculated using two-tailed unpaired student’s t-test. ns, not significant, *P < 0.05, **P < 0.01 and ***P < 0.001. The experiments were repeated three times. Source data are provided as a Source Data file.
Fig. 3
Fig. 3. Schematic and characterization of HMP-based nanoplatform.
a A scheme indicating the step-by-step synthesis of HMP nanoparticles and the subsequent drug loading. b The representative TEM image of HMP nanoparticles from three independent samples. c The representative HAADF-STEM image and corresponding elemental mappings of HMP nanoparticles from three independent samples. d The representative N2 absorption-desorption isotherms and pore size distribution (inset) of HMnO2 nanoparticles from three independent samples. e Zeta potential variations in the preparation procedure of IPI549@HMP nanoparticles. Data were expressed as means ± SD (n = 3 independent samples). f Representative UV-vis spectrums of free IPI549, HMP and IPI549@HMP from three independent samples. g Representative particle-size distributions of HMP and IPI549@HMP from three independent samples (Inset: digital photos of IPI549@HMP dispersed in deionized water, PBS and cell culture medium). h Cumulative release kinetics of IPI549 from HMP in varied conditions. i Representative T1-weighted MR images of different concentrations of IPI549@HMP dispersed in varied conditions from three independent samples. j Representative relaxation rate r1 versus Mn2+ concentrations when dispersed in varied conditions from three independent samples. k Concentration-dependent hemolysis and relative digital photo (inset) of IPI549@HMP. Data were expressed as means ± SD (n = 3 independent samples). H2O and PBS were set as positive and negative control, respectively. l Representative T1-weighted MR images of CT26 tumor-bearing mice before and after IPI549@HMP intravenous injection from three biologically independent samples. The red circle indicates tumor tissue. Source data are provided as a Source Data file.
Fig. 4
Fig. 4. IPI549@HMP-induced hypoxia remission for augmented RT.
a Schematic illustration of IPI549@HMP for hypoxia-relieved RT. b Representative ultrasonic image of IPI549@HMP reacted with H2O2 (100 μM) of three independent samples from each group. The white arrow points to the generated oxygen bubble. c Time-dependent oxygen production at varied Mn concentrations as detected by a portable dissolved oxygen analyzer (n = 3 independent samples). d Representative DNA damage marker γ-H2AX assays of CT26 tumor cells after varied treatments of three biologically independent samples from each group. e Representative confocal images of CT26 multicellular spheroids (MCSs) treated with varied samples and stained with Calcein AM (green) and PI (red) from three biologically independent samples. f, g Photoacoustic images (f) and corresponding quantification (g) in near-infrared mode (upper) and oxygen saturation mode (below) of tumors at varied time points post IPI549@HMP injection (n = 3 mice). Blue color indicates IPI549@HMP enrichment while red color represents oxygen saturation. h, i Representative HIF-1α immunohistochemical staining of three biologically independent samples from each group (h) and relative quantitative analysis (i) of tumor sections after i.v. injection of IPI549@HMP. The bold lines, upper boundaries and lower boundaries of notches represent the mean, max and min values. Data were expressed as means ± SD (n = 5 images per group). Statistical difference was calculated using two-tailed unpaired student’s t-test. *P < 0.05. Source data are provided as a Source Data file.
Fig. 5
Fig. 5. IPI549@HMP-augmented RT against postsurgical tumor progression.
a Schematic illustration of the experiment design to assess the in vivo IPI549@HMP-based RT and its triggered immune responses. b Representative bioluminescence images of Luc+ CT26 tumor after varied treatments as indicated (n = 6 mice). c-f Average tumor growth curves (c), individual tumor growth kinetics (d), Kaplan-Meier survival curves (e) and body weight fluctuation curves (f) of CT26 tumor-bearing mice after varied therapeutic combinations (n = 6 mice in c-f). g Western blot analysis of p110γ in residual tumors collected from mice in different groups. The experiments were repeated three times. h Representative immunofluorescence images from three biologically independent samples of tumor slices stained with DAPI (blue), CRT (red) and HMGB1 (green) antibodies. SR, surgical resection; RT, radiotherapy; CRT, calreticulin; HMGB1, high mobility group box 1. Statistical difference was calculated using two-tailed unpaired student’s t-test (c) and Log-rank (Mantel-Cox) test (e). Data were expressed as means ± SD (c, f). *P < 0.05, **P < 0.01 and ***P < 0.001. Source data are provided as a Source Data file.
Fig. 6
Fig. 6. Robust antitumor immune responses triggered by IPI549@HMP-augmented RT.
af Representative flow cytometric analysis and relative quantification of CTLs (CD8+CD3+CD45+) (a, b), MDSCs (CD11b+Gr-1+CD45+) (c, d) and TAM-M2 (CD206hiCD11b+F4/80+CD45+) (e, f). g, h Quantification by flow cytometry of CD8/Treg (g) and M1/M2 ratios (h). i Representative polychromatic immunofluorescent staining images of tumors from three biologically independent samples showing DAPI (blue), CD206+ (green), Foxp3+ (orange) and CD8+ (red) cells infiltration for Control and IPI549@HMP + RT groups. j, k Cytokine levels of TNF-α (j) and IFN-γ (k) in the serum after varied treatments. G1, Control; G2, IPI549@HMP; G3, RT; G4, HMP + RT; G5, IPI549@HMP + RT. RT, radiotherapy; CTLs, cytotoxic T lymphocytes; Tregs, regulatory T cells; MDSCs, myeloid-derived suppressor cells; TAMs-M2, M2-like macrophages; TAMs-M1, M1-like macrophages. Data were expressed as means ± SD (n = 3 biologically independent samples in b, d, f, g, h, j, and k). Statistical difference was calculated using two-tailed unpaired student’s t-test. *P < 0.05, **P < 0.01, ***P < 0.001. Source data are provided as a Source Data file.
Fig. 7
Fig. 7. Abscopal effect of IPI549@HMP-augmented RT plus PD-L1 blockade.
a Schematic illustration of the experiment design for in vivo evaluations. b Representative bioluminescence images of Luc+ CT26 tumor of six biologically independent animals from each group after varied treatments as indicated. c, d Individual (c) and average tumor growth curves (d) of primary and distant tumors (n = 6 mice in c, d). e Kaplan-Meier survival curves of mice treated with varied therapeutic combinations (n = 6 mice). f-k Representative flow cytometric analysis and relative quantification of CTLs (CD8+CD3+CD45+) (f, i), MDSCs (CD11b+Gr-1+CD45+) (g, j) and TAM-M2 (CD206hiCD11b+F4/80+CD45+) (h, k). l, m Quantification by flow cytometry of CD8/Treg (l) and M1/M2 ratios (m). n Representative polychromatic immunofluorescent staining images of tumor sections from three biologically independent samples showing DAPI (blue), CD8+ (red), CD206+ (purple), Foxp3+ (orange) and Ki67+ (green) cells infiltration for Control and IPI549@HMP + RT + aPDL1 groups. o, p Cytokine levels of TNF-α (o) and IFN-γ (p) in the serum after varied treatments. G1, Control; G2, aPDL1; G3, IPI549@HMP + RT; G4, IPI549@HMP + RT + aPDL1. RT, radiotherapy; CTLs, cytotoxic T lymphocytes; Tregs, regulatory T cells; MDSCs, myeloid-derived suppressor cells; TAMs-M2, M2-like macrophages; TAMs-M1, M1-like macrophages. Data were expressed as means ± SD (n = 3 biologically independent samples in im, o and p). Statistical difference was calculated using two-tailed unpaired student’s t-test (d, im, o and p) and Log-rank (Mantel-Cox) test (e). *P < 0.05, **P < 0.01, ***P < 0.001. Source data are provided as a Source Data file.
Fig. 8
Fig. 8. Long-term immune memory effects.
a Schematic illustration of the experiment design to assess the immunological memory response triggered by IPI549@HMP-augmented RT and anti-PD-L1 combination therapy. b Representative bioluminescence images of Luc+ CT26 tumor of six biologically independent animals from each group after varied treatments as indicated. ce Individual (c), average (d) tumor growth curves and survival curves (e) of the treated mice. Error bars are based on means ± SD (n = 6 mice in ce). f, g Cytokine levels of TNF-α (f) and IFN-γ (g) in the serum after tumor rechallenging. h-j Representative flow cytometric analysis (h) and relative quantification of central memory T cell (Tcm, CD62L+CD44+) and effector memory T cell (Tem, CD62L-CD44+) subset from CD8+ (i) and CD4+ (j) T cells in the spleen. Data were expressed as means ± SD (n = 3 biologically independent samples in f, g, i and j). Statistical difference was calculated using two-tailed unpaired student’s t-test (d, f, g, i and j) and Log-rank (Mantel-Cox) test (e). *P < 0.05, **P < 0.01, ***P < 0.001. Source data are provided as a Source Data file.

References

    1. Chen Q, et al. In situ sprayed bioresponsive immunotherapeutic gel for post-surgical cancer treatment. Nat. Nanotechnol. 2019;14:89–97. doi: 10.1038/s41565-018-0319-4. - DOI - PubMed
    1. Turajlic S, Swanton C. Metastasis as an evolutionary process. Science. 2016;352:169–175. doi: 10.1126/science.aaf2784. - DOI - PubMed
    1. Park CG, et al. Extended release of perioperative immunotherapy prevents tumor recurrence and eliminates metastases. Sci. Transl. Med. 2018;10:433. doi: 10.1126/scitranslmed.aar1916. - DOI - PubMed
    1. Boussiotis VA. Molecular and Biochemical Aspects of the PD-1 Checkpoint Pathway. N. Engl. J. Med. 2016;375:1767–1778. doi: 10.1056/NEJMra1514296. - DOI - PMC - PubMed
    1. Bear AS, Vonderheide RH, O’Hara MH. Challenges and Opportunities for Pancreatic Cancer Immunotherapy. Cancer Cell. 2020;38:788–802. doi: 10.1016/j.ccell.2020.08.004. - DOI - PMC - PubMed

Publication types