. 2022 Jul;19(7):834-847.
doi: 10.1038/s41423-022-00872-3. Epub 2022 May 20.

Aberrant cholesterol metabolic signaling impairs antitumor immunosurveillance through natural killer T cell dysfunction in obese liver

Affiliations

Aberrant cholesterol metabolic signaling impairs antitumor immunosurveillance through natural killer T cell dysfunction in obese liver

Wenshu Tang et al. Cell Mol Immunol. 2022 Jul.

Abstract

Obesity is a major risk factor for cancers including hepatocellular carcinoma (HCC) that develops from a background of non-alcoholic fatty liver disease (NAFLD). Hypercholesterolemia is a common comorbidity of obesity. Although cholesterol biosynthesis mainly occurs in the liver, its role in HCC development of obese people remains obscure. Using high-fat high-carbohydrate diet-associated orthotopic and spontaneous NAFLD-HCC mouse models, we found that hepatic cholesterol accumulation in obesity selectively suppressed natural killer T (NKT) cell-mediated antitumor immunosurveillance. Transcriptome analysis of human liver revealed aberrant cholesterol metabolism and NKT cell dysfunction in NAFLD patients. Notably, cholesterol-lowering rosuvastatin restored NKT expansion and cytotoxicity to prevent obesogenic diet-promoted HCC development. Moreover, suppression of hepatic cholesterol biosynthesis by a mammalian target of rapamycin (mTOR) inhibitor vistusertib preceded tumor regression, which was abolished by NKT inactivation but not CD8+ T cell depletion. Mechanistically, sterol regulatory element-binding protein 2 (SREBP2)-driven excessive cholesterol production from hepatocytes induced lipid peroxide accumulation and deficient cytotoxicity in NKT cells, which were supported by findings in people with obesity, NAFLD and NAFLD-HCC. This study highlights mTORC1/SREBP2/cholesterol-mediated NKT dysfunction in the tumor-promoting NAFLD liver microenvironment, providing intervention strategies that invigorating NKT cells to control HCC in the obesity epidemic.

Keywords: HCC; NAFLD; NKT cells; cholesterol; mTOR.


Conflict of interest statement

JZ and ASLC received the funding support and drug (vistusertib) from AstraZeneca. VWSW has consultancy in 3V-BIO, AbbVie, Allergan, Boehringer Ingelheim, Center for Outcomes Research in Liver Diseases, Echosens, Gilead Sciences, Hanmi Pharmaceutical, Intercept, Inventiva, Merck, Novartis, Novo Nordisk, Perspectum Diagnostics, Pfizer, ProSciento, Sagimet Biosciences, TARGET PharmaSolutions and Terns; has lectures in Abbott, AbbVie, Bristol-Myers Squibb, Echosens, Gilead Sciences and Novo Nordisk; received research grants from Gilead Sciences; and holds stock as co-founder of Illuminatio Medical Technology Limited. The other authors declare no competing interests.

Figures

Fig. 1
Fig. 1
Obesity-promoted NAFLD is accompanied by a selective NKT cell reduction. A Schematic for orthotopic NAFLD-HCC mouse model. Body weight (B), cholesterol level in blood and liver (C, D), the proportion of NK1.1+TCRβ+NKT cells in liver infiltrating CD45+ leukocytes (E) and PBMCs (G) of CD- and HFHC-fed mice at week 8, 12 and 15. F, H, Correlations between cholesterol level and NKT cell proportion in liver and blood. I Principal component analysis comparing human NAFLD liver samples with healthy controls. J Gene Ontology analysis of top differentially upregulated genes (adjusted p < 0.05, Log2FC > 1.5, n = 301) in NAFLD livers compared to healthy livers using MSigDB Hallmark 2020 database. K, L Volcano plots of differentially expressed genes in NAFLD livers compared to healthy livers (blue points, Log2FC > 1.5; brown points, Log2FC < −1.5). Genes involved in Cholesterol Homeostasis/mTORC1 Signaling (B) and NKT signatures (L) are highlighted. Representative photos of liver and tumor, and tumor weight (M) as well as proportions of NKT cells in tumor infiltrating CD45+ leukocytes (N) at the endpoint were shown. Data are mean ± SD of at least 5 mice per group. *p < 0.05; **p < 0.01 (BE, G, M, N, two-tailed t test; F, H, Spearman’s correlation coefficient)
Fig. 2
Fig. 2
Rosuvastatin restores NKT cell-mediated liver immunosurveillance to prevent obesity-promoted HCC. A HFHC-fed mice were treated with vehicle or rosuvastatin (40 mg/kg) for the latter 3 weeks via oral gavage (5 times/week) before intrahepatic injection of 5 × 105 RIL-175 cells at week 15. Isotype (rat IgG1 HRPN), anti-CD1d (19G11) or anti-CD8α (YTS169.4) antibodies were injected into rosuvastatin-treated mice one day before tumor injection and every 5 days for a total of three injections. Liver cholesterol level (B), representative images and H&E staining of livers (C), as well as proportion of NKT cells in liver infiltrating CD45+ leukocytes (D) in vehicle- and rosuvastatin-treated mice at week 15 were shown. E Correlation between liver cholesterol level and hepatic NKT cell proportion was shown. F CD69+ proportion in the hepatic NKT cells of vehicle- and rosuvastatin-treated mice at week 15 was shown. G Cytolytic activity of hepatic NKT cells sorted from vehicle- and rosuvastatin-treated mice was determined on RIL-175 cells. H Representative photos of liver and tumor, as well as statistic of tumor weight were shown. I, J, The proportions of NKT and CD8+ T cells in tumor-infiltrating CD45+ leukocytes were determined at the endpoint. K, L, Correlations between the proportions of tumor-infiltrating NKT or CD8+ T cells toward tumor weight were shown. Data are mean ± SD of at least 6 mice per group. *p < 0.05; **p < 0.01. (B, D, F, two-tailed t test; E, K, L, Spearman’s correlation coefficient; G two-way ANOVA; HJ, one-way ANOVA)
Fig. 3
Fig. 3
mTOR inhibitor AZD2014 confines obesity-promoted HCC development via NKT but not CD8+ T cells. A HFHC-fed mice were received vehicle or AZD2014 (10 mg/kg) treatment for the latter 3 weeks via oral gavage (5 times/week) before RIL-175 inoculation at week 15. Isotype control, anti-CD1d or anti-CD8α antibodies were injected into AZD2014-treated mice one day before tumor injection and every 5 days for a total of three injections. B Western blot analysis of pmTORser2448, mTOR, SREBP2 in livers of vehicle- and AZD2014-treated mice at week 15. β-actin served as loading control. Liver cholesterol level (C) and proportion of NKT cells in liver infiltrating CD45+ leukocytes (D) in vehicle- and AZD2014-treated mice at week 15 were shown. E Correlation between liver cholesterol level and hepatic NKT cell proportion was shown. Representative photos of liver and tumor, H&E staining with highlighted tumor regions (F), tumor weight (G), proportions of NKT cells (H) and CD8+ T cells (I) in tumor-infiltrating CD45+ leukocytes in indicated groups of mice at the endpoint were shown. J Correlations between proportions of tumor-infiltrating NKT or CD8+ T cells toward tumor weight were shown. K Schematic diagram of spontaneous NAFLD-HCC model induced by streptozocin (STZ) and HFHC diet. The mice were treated with vehicle or AZD2014 (10 mg/kg, 5 times/week) from week 16 to 19. L Western blot of pmTORser2448, mTOR and SREBP2 in livers of vehicle and AZD2014-treated STZ-HFHC mice were shown. β-actin served as loading control. Liver cholesterol level (M) and proportion of NKT cells in liver infiltrating CD45+ leukocytes (N) were shown in STZ-HFHC mice treated with vehicle or AZD2014 at the endpoint. O Representative photos of liver and tumor, with tumor lesions highlighted by blue arrows, as well as statistic of tumor weight were shown. Data are mean ± SD of at least 5 mice per group. *p < 0.05; **p < 0.01; ****p < 0.0001. (C, D, M, N, O, two-tailed t test; E, J, Spearman’s correlation coefficient; GI, one-way ANOVA)
Fig. 4
Fig. 4
SREBP2-mediated hepatic cholesterol biosynthesis precedes NKT dysfunction and HCC development. A HFHC-fed mice were received a single injection of 5 × 107 TU lentivirus-shCtrl or -shSrebp2 at week 12 and intrahepatic inoculation with RIL-175 cells at week 15. B Western blot analysis of SREBP2 in livers of shCtrl or shSrebp2 treated-NAFLD mice at week 15 was shown. β-actin served as loading control. Representative images and H&E staining of livers (C), liver cholesterol level (D) and proportion of NKT cells in liver infiltrating CD45+ leukocytes (E) in shCtrl or shSrebp2 treated mice at week 15 were shown. Representative images of liver and tumor, H&E staining of tumor, tumor weight (F) and proportion of NKT cells in tumor infiltrating CD45+ leukocytes (G) were shown at the endpoint. H Correlation between NKT cell proportion and tumor weight was shown. I Western blot of SREBP2 and loading control β-actin, heatmap of relative fold change of SREBP2, CYP51A1, DHCR7, HMGCR, HMGCS and SQLE mRNA level in LO2-SREBP2 toward LO2-VECTOR cells were shown. J Intracellular cholesterol levels of LO2-VECTOR and -SREBP2 cells treated with DMSO or U18666A (1.25 μM) was determined by Filipin III staining and shown as overlay histogram. Blue line represented LO2-VECTOR while purple line represented LO2-SREBP2. K Schematic for NKT cell expansion and cytotoxicity analysis in the presence of α-GalCer (100 ng/mL) and LO2 conditional medium (CM) in vitro. L Representative flow cytometry dot plots and percentage of CD3+CD56+TCRα+NKT cells in CD3+T cells cultured by LO2-VECTOR or -SREBP2 CM. M The cytolytic activity of NKT cells cultured by LO2-VECTOR or -SREBP2 CM was determined on HCC Huh7 cells. Data are mean ± SD of at least 5 mice per group or 3 biological replicates of at least 3 independent experimental settings. *p < 0.05; **p < 0.01. (D, E, F, G, two-tailed unpaired t test; H Spearman’s correlation coefficient; L, M two-tailed paired t test)
Fig. 5
Fig. 5
Cholesterol directly impairs NKT cell expansion and cytotoxicity by lipid peroxide accumulation. A Schematic for NKT cell expansion and functional analysis in the presence of α-GalCer (100 ng/mL) and cholesterol (20 μg/mL). B The proportion of CD3+CD56+TCRα+NKT cells in PBMCs. C Representative overlay histograms of Filipin III intensity indicated intracellular cholesterol level. D NKT cells treated with or without cholesterol (c) for 4 h and 24 h were analyzed for lipid peroxidation. E Concentration of of granzyme B and IFN-γ and the cytolytic activity of NKT cells cultured with or without cholesterol on Huh7 cells were shown. F The cytolytic activity of NKT cells cultured in the presence of cholesterol on Huh7 cells were shown. Blood cholesterol level (G), proportion of NKT cells in PBMCs (H), intracellular cholesterol content (I), and lipid peroxidation level in NKT cells (J) of 7 healthy donors and 8 obese people (BMI ≥ 40 kg/m2) were shown. Correlations between cholesterol content and lipid peroxidation levels in NKT cells (K), blood cholesterol level and NKT cell cholesterol content (L), blood cholesterol and NKT cell lipid peroxidation level (M), blood cholesterol level and NKT cell proportion (N) were shown. Data are mean ± SD of at least three biological replicates from two independent experiments. *p < 0.05; **p < 0.01. (E one-way ANOVA; DJ, two-tailed paired t test; KN, Spearman’s correlation coefficient)
Fig. 6
Fig. 6
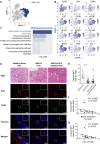
Hypercholesterolemia is associated with NKT cell reduction and dysfunction in people with NAFLD and NAFLD-HCC. A UMAP plot of CD3+ single-cell transcriptomes from human healthy and NAFLD/NASH livers. NKT-like cells were colored by blue. B UMAP plots showing the expressions and distributions of CD3E, CD4, CD8A, and certain NKT cell markers. C KEGG pathway analysis showing the top 6 enriched categories of downregulated genes in NKT cells from NAFLD/NASH livers (Adjusted p < 0.05, Log2FC > 0.15, n = 455). D H&E, CD3 and CD56 co-immunofluorescence in healthy livers (n = 8), NAFLD livers (n = 26) and NAFLD-HCC- tumor-adjacent liver tissues (n = 30) were shown. Co-localization of CD3 positive and CD56 positive cells were shown in the merged images. Hoechst served as positive control for cell nuclei staining. Scale bar = 100 μm. Correlations between CD3/CD56 scores (E) toward blood total cholesterol (F) or LDL levels (G) were shown. Data are mean ± SD. ****p < 0.0001. (E, one-way ANOVA; F, G, Spearman’s correlation coefficient)
Fig. 7
Fig. 7
Schematic diagram of our study. Aberrant mTORC1/SREBP2-mediated cholesterol accumulation causes NKT dysfunction in the NAFLD liver microenvironment, undermining the antitumor immunosurveillance in obesity. Our study provides intervention strategies e.g. vistusertib and rosuvastatin that invigorating NKT cells to control HCC in the obesity epidemic

Similar articles

Cited by

References

    1. Lauby-Secretanuby-Secretan B, Scoccianti C, Loomis D, Grosse Y, Bianchini F, Straif K. Body fatness and cancer-viewpoint of the IARC Working Group. N Engl J Med. 2016;375:794–8. doi: 10.1056/NEJMsr1606602. - DOI - PMC - PubMed
    1. Quail DF, Dannenberg AJ. The obese adipose tissue microenvironment in cancer development and progression. Nat Rev Endocrinol. 2019;15:139–54. doi: 10.1038/s41574-018-0126-x. - DOI - PMC - PubMed
    1. Demark-Wahnefriedmark-Wahnefried W, Platz EA, Ligibel JA, Blair CK, Courneya KS, Meyerhardt JA, et al. The role of obesity in cancer survival and recurrence. Cancer Epidemiol Biomark Prev. 2012;21:1244–59. doi: 10.1158/1055-9965.EPI-12-0485. - DOI - PMC - PubMed
    1. Avgerinos KI, Spyrou N, Mantzoros CS, Dalamaga M. Obesity and cancer risk: emerging biological mechanisms and perspectives. Metabolism. 2019;92:121–35. doi: 10.1016/j.metabol.2018.11.001. - DOI - PubMed
    1. Ringelngel AE, Drijvers JM, Baker GJ, Catozzi A, García-Cañaveras JC, Gassaway BM, et al. Obesity shapes metabolism in the tumor microenvironment to suppress anti-tumor immunity. Cell. 2020;183:1848–66 e1826. doi: 10.1016/j.cell.2020.11.009. - DOI - PMC - PubMed

Publication types