. 2022 May 20;13(1):2821.
doi: 10.1038/s41467-022-30429-x.

Molecular basis for gating of cardiac ryanodine receptor explains the mechanisms for gain- and loss-of function mutations

Affiliations

Molecular basis for gating of cardiac ryanodine receptor explains the mechanisms for gain- and loss-of function mutations

Takuya Kobayashi et al. Nat Commun. .

Abstract

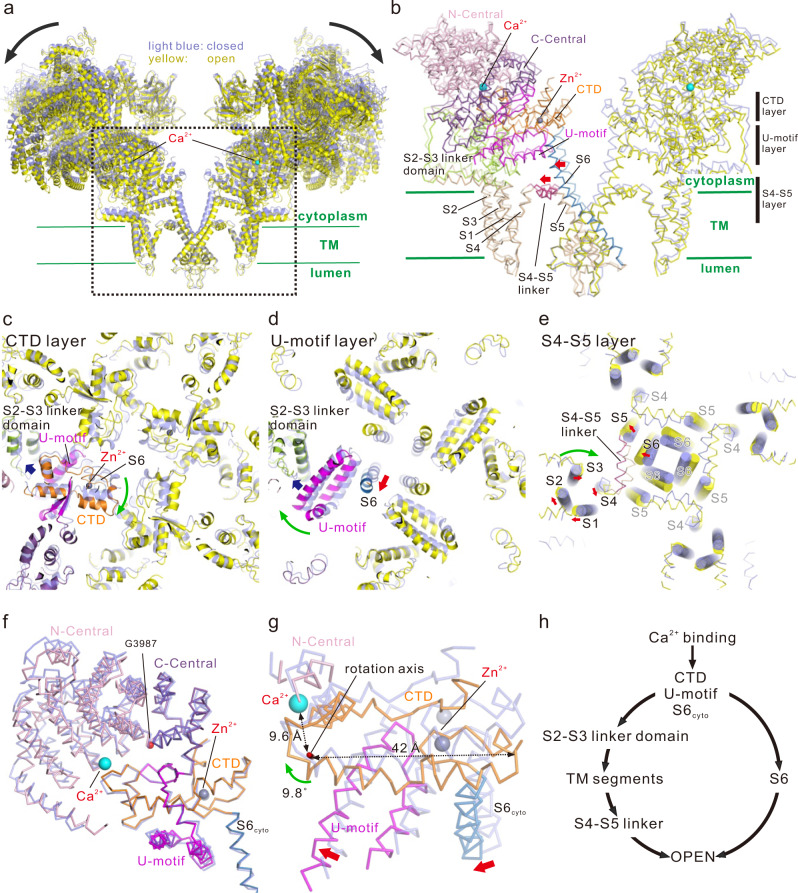
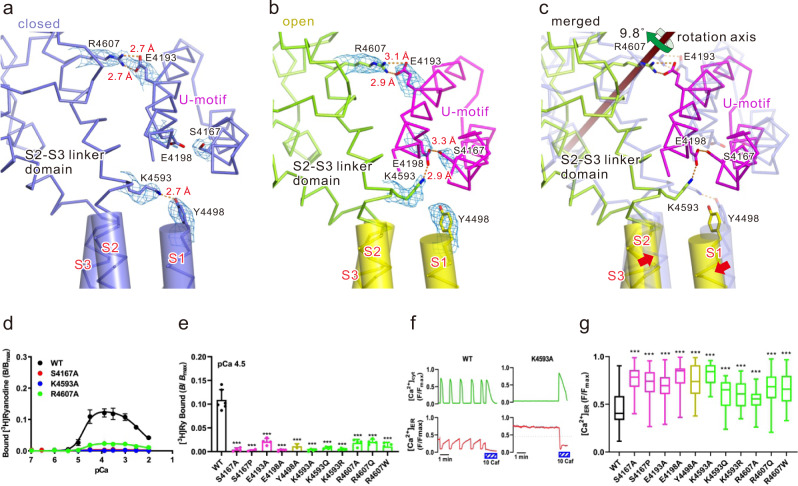
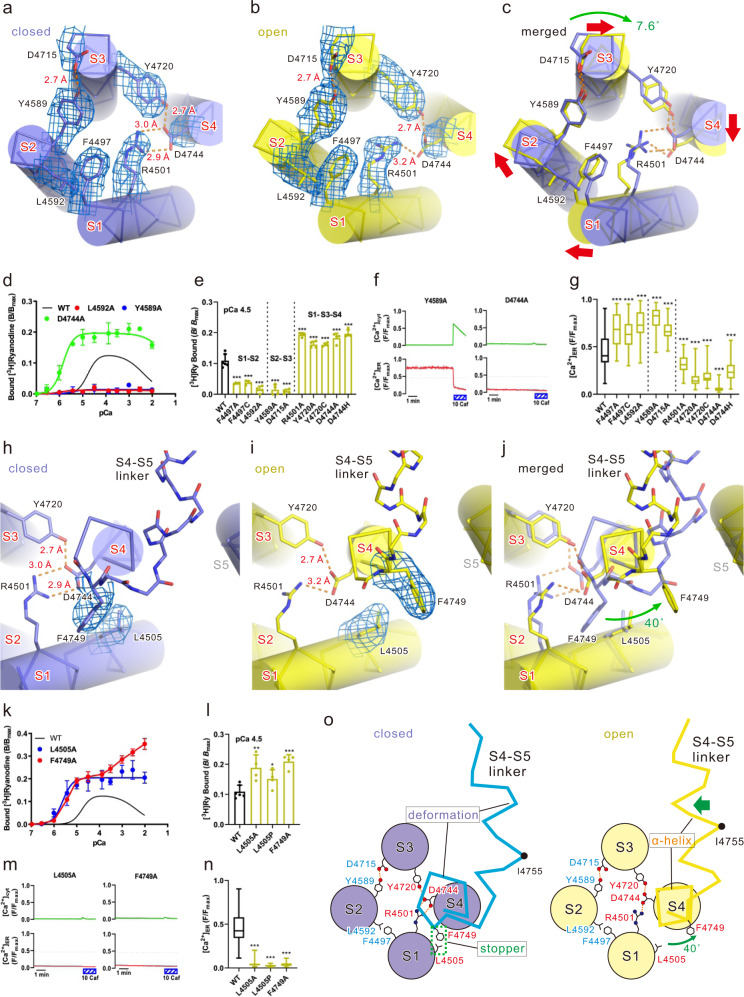
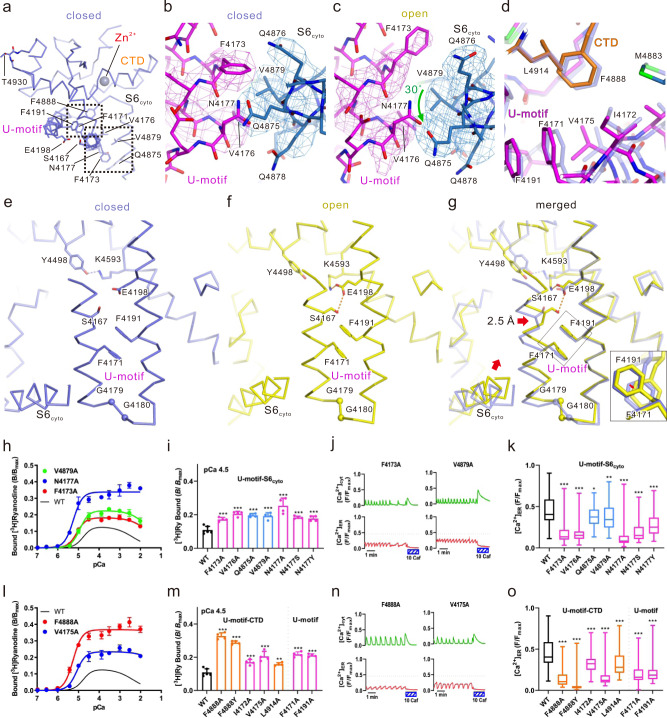
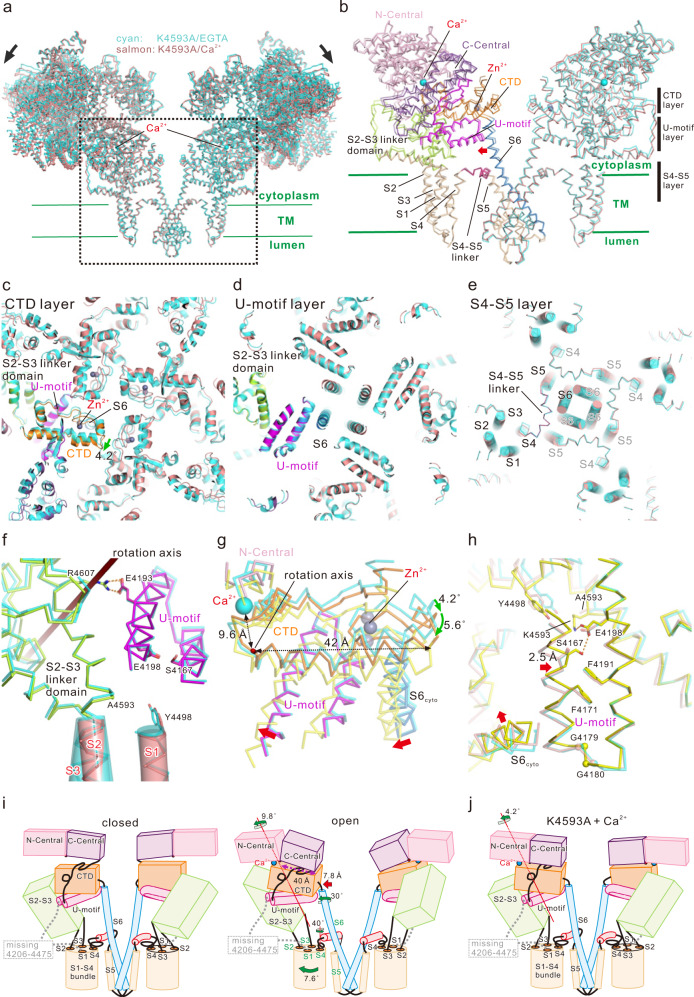
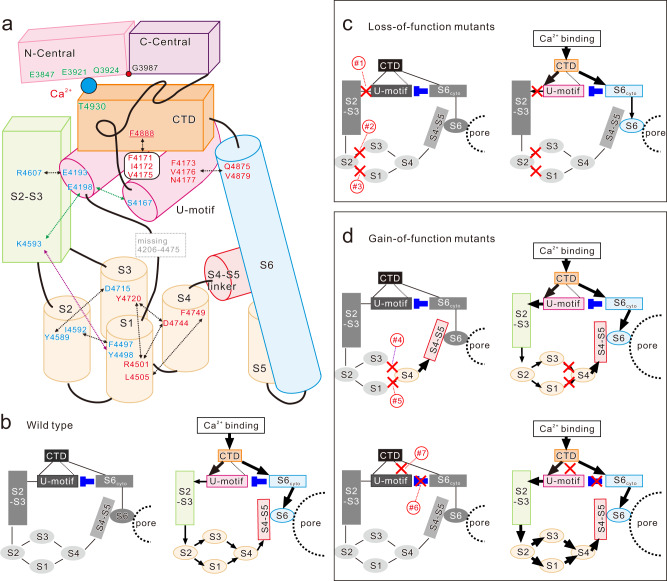
Cardiac ryanodine receptor (RyR2) is a large Ca2+ release channel in the sarcoplasmic reticulum and indispensable for excitation-contraction coupling in the heart. RyR2 is activated by Ca2+ and RyR2 mutations are implicated in severe arrhythmogenic diseases. Yet, the structural basis underlying channel opening and how mutations affect the channel remains unknown. Here, we address the gating mechanism of RyR2 by combining high-resolution structures determined by cryo-electron microscopy with quantitative functional analysis of channels carrying various mutations in specific residues. We demonstrated two fundamental mechanisms for channel gating: interactions close to the channel pore stabilize the channel to prevent hyperactivity and a series of interactions in the surrounding regions is necessary for channel opening upon Ca2+ binding. Mutations at the residues involved in the former and the latter mechanisms cause gain-of-function and loss-of-function, respectively. Our results reveal gating mechanisms of the RyR2 channel and alterations by pathogenic mutations at the atomic level.


Conflict of interest statement

The authors declare no competing interests.

Figures

Fig. 1
Fig. 1. Conformational changes upon Ca2+ binding.
a Overlay of RyR2 in the closed (light blue) and open (yellow) states viewed from the direction parallel to the lipid bilayer is shown as a ribbon model. Two facing protomers in the RyR2 tetramer are shown. b Magnified view of the dotted box in (a). In the left protomer, each domain is colored (N-Central, light pink; C-Central, purple; U-motif, magenta; S1–S5, wheat; S2–S3 linker domain, light green; S4–S5 linker, warm pink; S6, blue; CTD, orange). S4–S5 linker and S6 moved outside upon Ca2+ binding as indicated by the red arrows. Three regions parallel to the membrane are defined as CTD, U-motif, and S4–S5 layers. Ca2+, shown as a cyan ball; Zn2+, shown as a gray ball. ce Cross-section views of CTD, U-motif, and S4–S5 layers. The closed state is colored in light blue and the open state is colored according to (b) or yellow. In (e), Cα representation overlaid with cylindrical TM helices is used. Ca2+ binding causes clockwise rotation of CTD (green arrow in (c)), U-motif (green arrow in (d)), and S1-S4 TM helices and outward movement of S4-S5 linker and S6 (red arrows in (e)). f C-Central/U-motif/S6cyto/CTD complex. Closed (light blue) and open (colored according to (b)) states are overlaid at the CTD. Central domain is split into two parts at G3987 which works as the pivot of the rotation upon Ca2+ binding. g Rotation of the C-Central/U-motif/S6cyto/CTD complex upon Ca2+ binding viewed from the rotation axis. h Scheme of channel opening upon Ca2+ binding. Two independent pathways via S6 and S4–S5 linker are hypothesized. Source data are provided as a Source Data file.
Fig. 2
Fig. 2. Key interactions between U-motif and S2-S3 linker domain upon channel opening.
ac Interface of U-motif and S2-S3 linker domain in the closed state (a), open state (b), and an overlay of both states (c) viewed parallel to the membrane is shown as a Cα model. Amino acid residues involved in key interactions are shown as stick models. The color of carbon atoms is the same as that of Cα; oxygen, red; nitrogen, blue. The TM region forming α-helices is overlaid with the cylinder model. Hydrogen bonds or salt bridges are shown as orange dotted lines. Density maps around side chains shown in (a) and (b) are superimposed and contoured at 0.025. dg Functional analysis of mutants involved in U-motif/S2–S3 linker domain interaction. d Ca2+-dependent [3H]ryanodine binding of WT and representative mutants. Data are shown as means ± SD (n = 4). e Summary of [3H]ryanodine binding of WT and mutants at pCa 4.5. Data are shown as means ± SD (n = 6 and 4 for WT and mutants, respectively) and were analyzed by one-way ANOVA with Dunnett’s multiple comparisons test. ***p < 0.001 from WT. f Representative traces of cytoplasmic ([Ca2+]cyt) and ER ([Ca2+]ER) Ca2+ signals of HEK293 cells expressing WT or K4593A. Spontaneous Ca2+ oscillations occurred with a concomitant decrease in [Ca2+]ER in WT, while the K4593 mutant showed no Ca2+ oscillations with an increased [Ca2+]ER, indicating loss-of-function of the channel. g Summary of the upper level of [Ca2+]ER signals in WT and mutants. All mutants showed loss-of-function of the channel. Data are shown as box-and-whisker plots, with the median for all subjects shown as the center line, the box representing the 25–75 percentile, and the lines showing the range of the data (n = 97, 68, 76, 73, 46, 35, 44, 36, 46, 54, 63, and 53 for WT, S4167A, S4167P, E4193A, E4198A, Y4498A, K4593A, K4593Q, K4593R, R4607A, R4607Q, and R4607W, respectively). Data were analyzed by one-way ANOVA with Dunnett’s multiple comparisons test. ***p < 0.001 from WT. Source data are provided as a Source Data file.
Fig. 3
Fig. 3. Key interactions in the transmembrane region upon channel opening.
ac The S1–S4 bundle. Closed state (a), open state (b), and overlay of the structures in both states (c) are shown as a Cα model and overlaid with cylinder models. Hydrogen bonds/salt bridges are shown as orange dotted lines. Density maps around side chains shown in (a) and (b) are superimposed and contoured at 0.03. dg Functional analysis of mutants involved in the S1/S2, S2/S3, S1/S4, or S3/S4 interaction. d Ca2+-dependent [3H]ryanodine binding of WT and representative mutants. Data are shown as means ± SD (n  =  4). e Summary of [3H]ryanodine binding of WT and mutants at pCa 4.5. Data are shown as means ± SD (n = 6 and 4 for WT and mutants, respectively) and were analyzed by one-way ANOVA with Dunnett’s test. ***p < 0.001 from WT. f Representative traces of [Ca2+]cyt and [Ca2+]ER signals of HEK293 cells expressing Y4589A or D4744A. g Summary of the upper level of [Ca2+]ER signals in WT and mutants. Data are shown as box-and-whisker plots, with the median for all subjects shown as the center line, the box representing the 25–75 percentile, and the lines showing the range of the data (n = 97, 69, 65, 66, 35, 56, 74, 54, 63, 39, and 94 for WT, F4497A, F4497C, L4592A, Y4589A, D4715A, R4501A, Y4720A, Y4720C, D4744A, and D4744H, respectively) and were analyzed by one-way ANOVA with Dunnett’s test. ***p < 0.001 from WT. hj TM region around S4. Closed state (h), open state (i), and overlay of the structures in both states (j). Structures in both states were fitted to the bottom part of S4 helices and viewed along the axis of the S4 helix and from the cytoplasm; the Cα model overlaid with cylinder models. Main chain representation of the S4-S5 linker. Density maps around side chains shown in (h) and (i) are superimposed and contoured at 0.03. k Ca2+-dependent [3H]ryanodine binding of WT and representative mutants. Data are shown as means ± SD (n  =  4). l Summary of [3H]ryanodine binding of WT and mutants at pCa 4.5. Data are shown as means ± SD (n = 6 and 4 for WT and mutants, respectively) and were analyzed by one-way ANOVA with Dunnett’s test. *p < 0.05, **p < 0.01, ***p < 0.001 from WT. m Representative traces of [Ca2+]cyt and [Ca2+]ER signals of HEK293 cells expressing L4505A or F4749A. n Summary of the upper level of [Ca2+]ER signals in WT and mutants. Data are shown as box-and-whisker plots, with the median for all subjects shown as the center line, the box representing the 25–75 percentile, and the lines showing the range of the data (n = 97, 67, 35, and 74 for WT, L4505A, L4505P, and F4749A, respectively) and were analyzed by one-way ANOVA with Dunnett’s test. ***p < 0.001 from WT. o Scheme of the structure in the S1-S4 TM helices and S4-S5 linker. S1-S4 helices are drawn with a circle, and the positions of Cα atoms of S4-S5 linker are connected by a line. Amino-acid numbers associated with signal transduction and stabilization are shown in blue and red, respectively. While the S1/S2 and S2/S3 interactions are involved in signal transduction, the S1/S4 and S3/S4 interactions are involved in the stabilization of the channel in the closed state. Alteration of the relative positions of L4505 and F4749 to release the stopper shown as the green dotted box. This allows α-helix formation of the upper part of S4 and subsequent α-helix formation and outward movement of the S4–S5 linker to open the channel. Since α-helix formation of the S4–S5 linker shortened its length in the open state, the rewinding to α-helix in the upper part of S4 provides a margin for shortening of the S4–S5 linker. The position of the Cα atom of I4755 are shown as a black-filled circle. Source data are provided as a Source Data file.
Fig. 4
Fig. 4. Key interactions between the U-motif and S6cyto/CTD.
a Structure around the U-motif in the open state (U-motif, magenta; S6cyto, blue; CTD, orange). Ca2+ and Zn2+ are shown as cyan and gray spheres, respectively. b, c Details of the U-motif/S6cyto interaction. Structures in the closed (b) and open (c) states fitted to the N-terminal region of the U-motif are shown as a full atomic model. Density maps around the interaction are superimposed and contoured at 0.025. d Details of the U-motif/CTD interaction around F4888. Overlay of the structures in the closed (light blue) and open (colored) states. eg Compaction in U-motif. Closed state (e), open state (f), and overlay of the structures in both states (g) are shown as a Cα model. Inset of (g) shows the magnified view of the F4171/F4191 stacking looking from aromatic ring of F4191. F4171 is stacked in parallel with F4191 in both the closed and the open states, but it slightly moves away from F4191 in the open state. The structures are fitted in the C-terminal side of U-motif (4183–4205). The closed state and the open state is colored with light blue and yellow, respectively. The N-terminus side of the U-motif of the WT in the open state is ~2.5 Å closer to the C-terminus side of the U-motif as indicated by the red arrow, and as a result, S6cyto movement (red arrow) becomes possible. ho Functional analysis of mutants involved in U-motif/S6cyto (hk) and U-motif/CTD (lo) interactions. h, l Ca2+-dependent [3H]ryanodine binding of WT and representative mutants. Data are shown as means ± SD (n  =  4). i, m Summary of [3H]ryanodine binding of WT and mutants at pCa 4.5. Data are shown as means ± SD (n = 6 and 4 for WT and mutants, respectively) and were analyzed by one-way ANOVA with Dunnett’s test. **p < 0.01, ***p < 0.001 from WT. j, n Representative traces of [Ca2+]cyt and [Ca2+]ER signals of HEK293 cells expressing F4173A or V4879A (j) and F4888A or V4175A (n). k, o Summary of the upper level of [Ca2+]ER signals in WT and mutants. Data are shown as box-and-whisker plots, with the median for all subjects shown as the center line, the box representing the 25–75 percentile, and the lines showing the range of the data (n = 97, 96, 97, 89, 87, 96, 54, and 49 for WT, F4173A, V4176A, Q4875A, V4879A, N4177A, N4177S, and N4177Y, respectively, for (k) and 97, 34, 59, 58, 98, 63, 94, and 94 for WT, F4888A, F4888Y, I4172A, V4175A, L4914A, F4171A, and F4191A, respectively, for (o)) and were analyzed by one-way ANOVA with Dunnett’s test. *p < 0.05, **p < 0.01, ***p < 0.001 from WT. Source data are provided as a Source Data file.
Fig. 5
Fig. 5. Structural basis of loss-of-function mutation and gating mechanism upon Ca2+ binding.
a Overlay of K4593A mutant in the presence of EGTA (cyan) and K4593A mutant in the presence of Ca2+ (salmon) viewed from the direction parallel to the lipid bilayer is shown as a ribbon model. Two facing protomers in the RyR2 tetramer are shown. b Magnified view of the dotted box in (a). In the left protomer, each domain is colored (N-Central, light pink; C-Central, purple; U-motif, magenta; S1–S5, wheat; S2–S3 linker domain, light green; S4–S5 linker, warm pink; S6, blue; CTD, orange). S6 moved outside upon Ca2+ binding as indicated by the red arrow. Three regions parallel to the membrane are defined as CTD, U-motif, and S4–S5 layers. Ca2+, shown as cyan ball; Zn2+, shown as gray ball. ce Cross-section views of CTD, U-motif, and S4-S5 layers. K4593A mutant in the presence of EGTA is colored with cyan and in the presence of Ca2+ is colored according to (b) or salmon. In (e), Cα representation overlaid with cylindrical TM helices are used. Ca2+ binding causes clockwise rotation of CTD (green arrow in (c)), but U-motif and S1-S4 TM helices show no considerable movement as shown in Figs. 1d, e. f An overlay of the interface of U-motif and S2-S3 linker domain in K4593A mutant in the presence of EGTA and Ca2+ viewed parallel to the membrane and shown as a Cα model. Amino acid residues involved in key interactions are shown as stick models. The color of carbon atoms is the same as that of Cα; oxygen, red; nitrogen, blue. The TM region forming α-helices is overlaid with the cylinder model. Hydrogen bonds or salt bridges are shown as orange dotted lines. g Rotation of the C-Central/U-motif/S6cyto/CTD complex upon Ca2+ binding viewed from the rotation axis. Each domain of the K4593A mutant in the presence of Ca2+ is colored (U-motif, magenta; S6, blue; CTD, orange). K4593A mutant in the presence of EGTA and WT in the open state is shown as cyan and yellow, respectively. h Overlay of three structures (K4593A mutant in the presence of EGTA, K4593A mutant in the presence of Ca2+, and WT in the open state) fitted in the C-terminal side of U-motif (4183–4205). K4593A mutant in the presence of EGTA, K4593A mutant in the presence of Ca2+, and WT in the open state is shown as cyan, salmon, and yellow, respectively. The N-terminus side of the U-motif of the WT in the open state is ~2.5 Å closer to the C-terminus side of the U-motif as indicated by the red arrow, and as a result, S6cyto movement (red arrow) becomes possible. This movement was not observed in the K4593A mutant in the presence of Ca2+. i, j Scheme of the structure in the closed (i, left), open state (i, right) and K4593A mutant in the presence of Ca2+ (j). i In the closed state, the upper part of S4 does not form an α-helix. The S4–S5 linker is unfolded and significantly bends in the direction of S6. In the open state, binding of Ca2+ to the C-Central/CTD interface causes 9.8° rotation of all domains consisting of C-Central/U-motif/S6cyto/CTD complex and compaction of U-motif, leading to two pathways. Pathway 1: the rotation causes 30° rotation of S6cyto which loosens the U-motif/S6cyto interaction and allows outward movement of S6. Pathway 2: a sequential movement of the S2–S3 linker domain, S2, S1–S4 bundle, and S4 allows the upper part of S4 to rewind and form an α-helix. Subsequently, the S4-S5 linker moves outward, creating a space where S6 can lean into. A combination of these two independent pathways eventually leads to the opening of the channel. j In the K4593A mutant, binding of Ca2+ to the C-Central/CTD interface causes 4.2° rotation of the C-Central/U-motif complex, but no substantial movement occurs in the U-motif and S6cyto, therefore, the signal of Ca2+ binding is not transmitted to the subsequent steps, and the opening of the channel pore does not occur.
Fig. 6
Fig. 6. Details of interactions and schematic diagram of the channel gating of WT and mutant RyR2 upon Ca2+ binding.
a Details of interactions identified in this study. Amino-acid residues shown in red letter and blue letter indicate gain-of-function and loss-of-function by alanine-substituted or pathogenic mutations, respectively. Arrows indicate interactions. Purple and green arrows indicate interactions only found in the closed and open states, respectively. bd Schematic diagram of the channel gating of WT and mutant RyR2 upon Ca2+ binding. The left and right diagrams show the states in the absence and presence of Ca2+, respectively. The black lines, the domain interactions; The dotted line, CTD/U-motif interaction via F4888; The blue T-shaped lines, U-motif/S6cyto interaction that acts as a suppressor; The black lines with arrowhead, signals for channel opening. The domains shown in gray-scale and colored indicate the domains in the inactive and active states, respectively. b In WT., the channel pore is closed, since the movement of S4-S5 linker is locked. Ca2+ binding unlocks the S4-S5 linker and induces the outward leaning of S6, resulting in the pore opening. c Loss-of-function (LOF) mutants. Mutations in the U-motif/S2-S3 linker domain (#1), S1/S2 (#2) or S2/S3 (#3) interface cause disconnection of signal transduction. The binding of Ca2+ therefore cannot induce the outward movement of the S4-S5 linker and the channel pore is kept closed. d Gain-of-function (GOF) mutants. (Upper panels) Mutations in S3/S4 (#4) or S1/S4 (#5) interface unlock the S4-S5 linker to be activated. In the absence of Ca2+, the channel pore is kept closed, since the outward leaning of S6 does not occur spontaneously. Binding of Ca2+ causes hyperactivity of the channel, since the S4-S5 linker is more active than WT. (Lower panels) Mutations in U-motif/S6cyto (#6) or CTD/U-motif (#7) reduce or lose U-motif/S6cyto interaction. The binding of Ca2+ causes hyperactivity of the channel, since S6 and the S4–S5 linker are more active than WT.

Similar articles

Cited by

References

    1. Bers DM. Macromolecular complexes regulating cardiac ryanodine receptor function. J. Mol. Cell Cardiol. 2004;37:417–429. doi: 10.1016/j.yjmcc.2004.05.026. - DOI - PubMed
    1. Santulli G, Lewis D, des Georges A, Marks AR, Frank J. Ryanodine receptor structure and function in health and disease. Subcell. Biochem. 2018;87:329–352. doi: 10.1007/978-981-10-7757-9_11. - DOI - PMC - PubMed
    1. Endo M. Calcium-induced calcium release in skeletal muscle. Physiol. Rev. 2009;89:1153–1176. doi: 10.1152/physrev.00040.2008. - DOI - PubMed
    1. Fabiato A, Fabiato F. Calcium-induced release of calcium from the sarcoplasmic reticulum of skinned cells from adult human, dog, cat, rabbit, rat, and frog hearts and from fetal and new-born rat ventricles. Ann. NY Acad. Sci. 1978;307:491–522. doi: 10.1111/j.1749-6632.1978.tb41979.x. - DOI - PubMed
    1. Kawamura M, et al. Genetic background of catecholaminergic polymorphic ventricular tachycardia in Japan. Circ. J. 2013;77:1705–1713. doi: 10.1253/circj.CJ-12-1460. - DOI - PubMed

Publication types

MeSH terms

Substances