

Spatial distribution and risk assessments due to the microplastics pollution in sediments of Karnaphuli River Estuary, Bangladesh
- PMID: 35595854
- PMCID: PMC9123007
- DOI: 10.1038/s41598-022-12296-0
Spatial distribution and risk assessments due to the microplastics pollution in sediments of Karnaphuli River Estuary, Bangladesh
Abstract
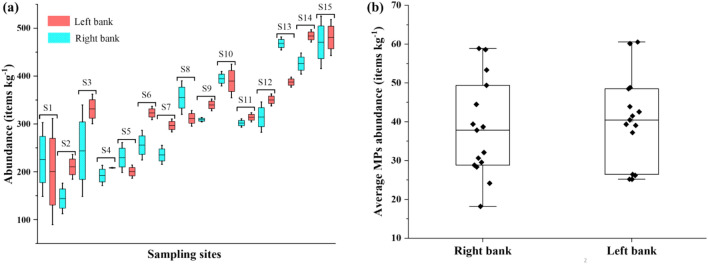
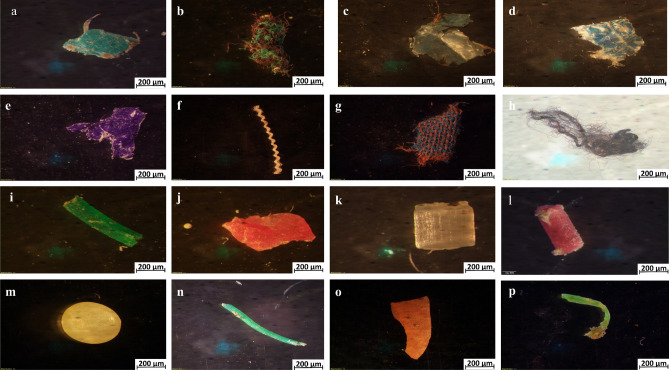
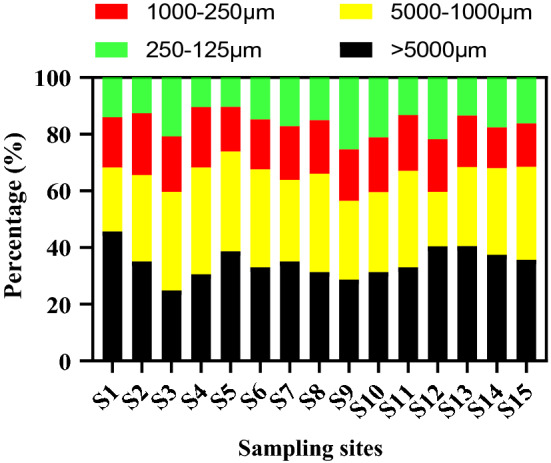
Microplastics (MPs) have become an emerging global pollutant due to their widespread dispersion and potential threats to marine ecosystems. However, studies on MPs in estuarine and coastal ecosystems of Bangladesh are very limited. Here, we conducted the first study on abundance, distribution, characteristics, and risk assessment of microplastics in the sediment of Karnaphuli River estuary, Bangladesh. Microplastic particles were extracted from sediments of 30 stations along the estuary by density separation and then enumerated and characterized using a stereomicroscope and Fourier Transform Infrared (FT-IR) spectroscopy. In the collected sediment of the Karnaphuli River estuary, the number of MPs varied from 22.29 to 59.5 items kg-1 of dry weight. The mean abundance was higher in the downstream and left banks of the estuary, whereas the predominant shape, colour, and size of MPs were films (35%), and white (19%), and 1-5 mm (30.38%), respectively. Major polymer types were polyethylene terephthalate, polystyrene, polyethylene, cellulose, and nylon. MPs were found to pose risks (low to high) in the sediment of the estuary, with the highest risk occurring at one station near a sewage outlet, according to the results of risk analyses using the pollution risk index, polymer risk index (H), contamination factors, and pollution load index (PLI). The single value index, PLI, clearly demonstrated that all sampling sites were considerably polluted with microplastics (PLI > 1). H values showed toxic polymers, even in lower proportions, possess higher polymeric hazard scores and vice versa. This investigation uncovered new insights on the status of MPs in the sediments of the Karnaphuli River estuary, laying the groundwork for future research and control of microplastic pollution and management.
© 2022. The Author(s).
Conflict of interest statement
The authors declare no competing interests.
Figures


Similar articles
-
Distribution, characterization and contamination risk assessment of microplastics in the sediment from the world's top sediment-laden estuary.J Environ Manage. 2023 Oct 15;344:118472. doi: 10.1016/j.jenvman.2023.118472. Epub 2023 Jun 27. J Environ Manage. 2023. PMID: 37384995
-
Microplastic pollution in the water and sediment of the Karnaphuli River, Bangladesh: An ecological risk assessment.Mar Pollut Bull. 2025 Jul;216:117948. doi: 10.1016/j.marpolbul.2025.117948. Epub 2025 Apr 11. Mar Pollut Bull. 2025. PMID: 40220547
-
Distribution of microplastics in shoreline water and sediment of the Ganges River Basin to Meghna Estuary in Bangladesh.Ecotoxicol Environ Saf. 2023 Nov 1;266:115537. doi: 10.1016/j.ecoenv.2023.115537. Epub 2023 Oct 6. Ecotoxicol Environ Saf. 2023. PMID: 37806129
-
Recent trends on microplastics abundance and risk assessment in coastal Antarctica: Regional meta-analysis.Environ Pollut. 2023 May 1;324:121385. doi: 10.1016/j.envpol.2023.121385. Epub 2023 Mar 1. Environ Pollut. 2023. PMID: 36868550 Review.
-
Microplastics in aquatic ecosystems of Africa: A comprehensive review and meta-analysis.Environ Res. 2024 May 1;248:118307. doi: 10.1016/j.envres.2024.118307. Epub 2024 Feb 1. Environ Res. 2024. PMID: 38307187 Review.
Cited by
-
Microplastic from beach sediment to tissue: a case study on burrowing crab Dotilla blanfordi.PeerJ. 2024 Jul 12;12:e17738. doi: 10.7717/peerj.17738. eCollection 2024. PeerJ. 2024. PMID: 39011379 Free PMC article.
-
Abundance and characterization of personal protective equipment (PPE) polluting Kish Island, Persian Gulf.Sci Total Environ. 2023 Jan 1;854:158678. doi: 10.1016/j.scitotenv.2022.158678. Epub 2022 Sep 11. Sci Total Environ. 2023. PMID: 36099950 Free PMC article.
-
Vertical profile of dissolved oxygen and associated water variables in the Pasur-Rupsha estuary of Bangladesh.Heliyon. 2022 Oct 7;8(10):e10935. doi: 10.1016/j.heliyon.2022.e10935. eCollection 2022 Oct. Heliyon. 2022. PMID: 36276724 Free PMC article.
-
Personal protective equipment-derived pollution during Covid-19 era: A critical review of ecotoxicology impacts, intervention strategies, and future challenges.Sci Total Environ. 2023 Aug 20;887:164164. doi: 10.1016/j.scitotenv.2023.164164. Epub 2023 May 13. Sci Total Environ. 2023. Retraction in: Sci Total Environ. 2025 Mar 1;967:178758. doi: 10.1016/j.scitotenv.2025.178758. PMID: 37187394 Free PMC article. Retracted. Review.
-
Assessment of microplastics as contaminants in a coal mining region.Heliyon. 2022 Nov 17;8(11):e11666. doi: 10.1016/j.heliyon.2022.e11666. eCollection 2022 Nov. Heliyon. 2022. PMID: 36439743 Free PMC article.
References
-
- Rakib MRJ, De-la-Torre GE, Pizarro-Ortega CI, Dioses-Salinas DC, Al-Nahian S. Personal protective equipment (PPE) pollution driven by the COVID-19 pandemic in Cox's Bazar, the longest natural beach in the world. Mar. Pollut. Bull. 2021;169:112497. doi: 10.1016/j.marpolbul.2021.112497. - DOI - PMC - PubMed
-
- Rakib MRJ, Ertaş A, Walker TR, Rule MJ, Khandaker MU, Idris AM. Macro marine litter survey of sandy beaches along the Cox's Bazar Coast of Bay of Bengal, Bangladesh: LAND-based sources of solid litter pollution. Mar. Pollut. Bull. 2022;174:113246. doi: 10.1016/j.marpolbul.2021.113246. - DOI - PubMed
-
- Villarrubia-Gómez P, Cornell SE, Fabres J. Marine plastic pollution as a planetary boundary threat–the drifting piece in the sustainability puzzle. Mar. Policy. 2018;96:213–220. doi: 10.1016/j.marpol.2017.11.035. - DOI
Publication types
MeSH terms
Substances
LinkOut - more resources
Full Text Sources
Miscellaneous
