

Alterations of the gut microbial community structure and function with aging in the spontaneously hypertensive stroke prone rat
- PMID: 35595870
- PMCID: PMC9122926
- DOI: 10.1038/s41598-022-12578-7
Alterations of the gut microbial community structure and function with aging in the spontaneously hypertensive stroke prone rat
Abstract
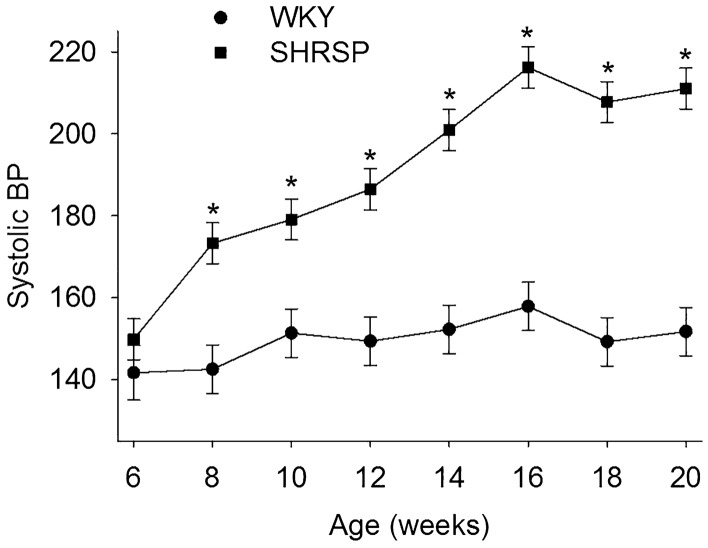
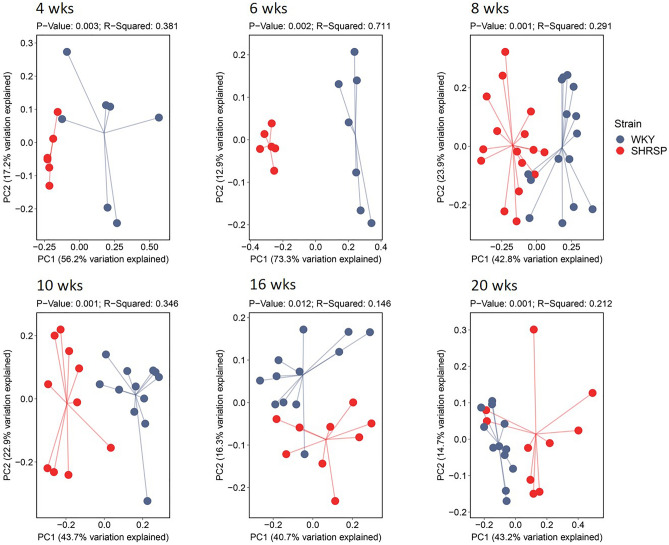
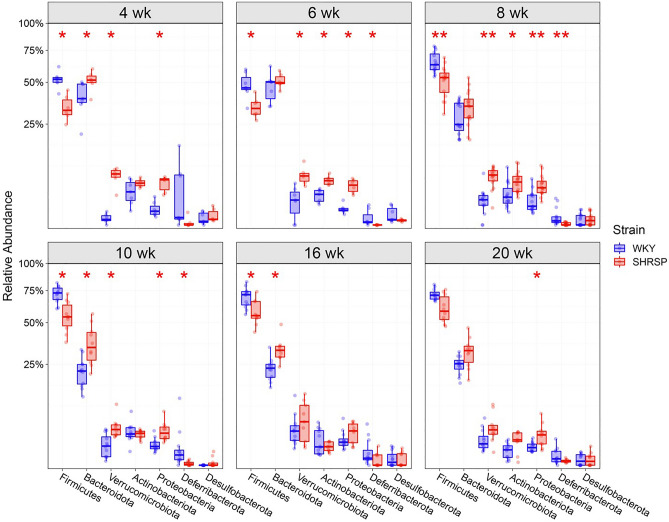
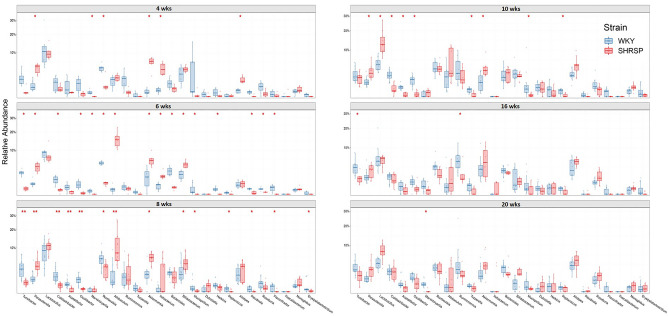
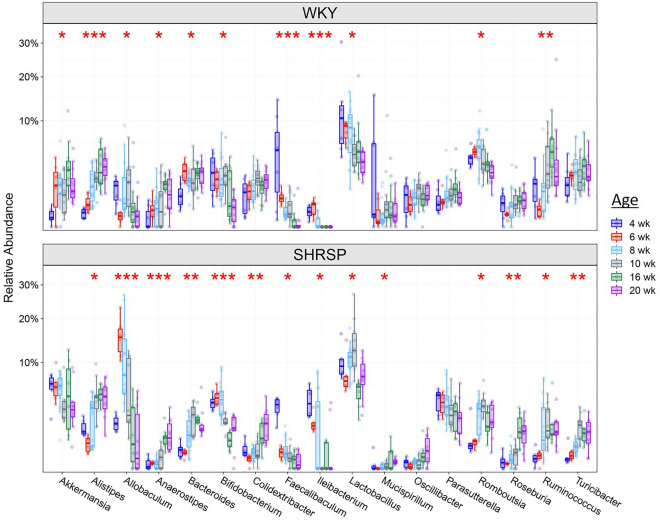
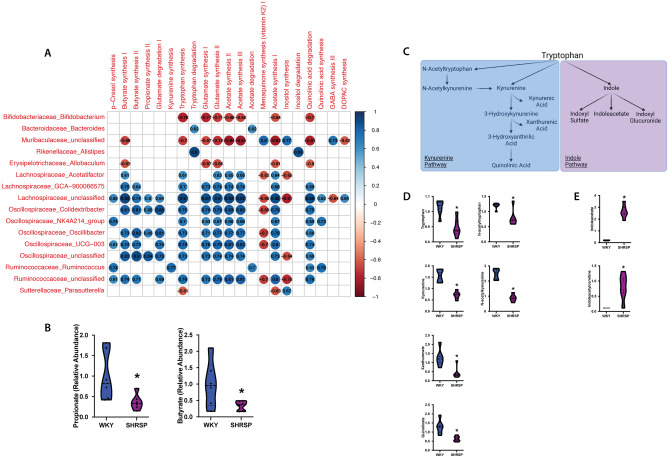
Gut dysbiosis, a pathological imbalance of bacteria, has been shown to contribute to the development of hypertension (HT), systemic- and neuro-inflammation, and blood-brain barrier (BBB) disruption in spontaneously hypertensive stroke prone rats (SHRSP). However, to date individual species that contribute to HT in the SHRSP model have not been identified. One potential reason, is that nearly all studies of the SHRSP gut microbiota have analyzed samples from rats with established HT. The goal of this study was to examine the SHRSP gut microbiota before, during, and after the onset of hypertension, and in normotensive WKY control rats over the same age range. We hypothesized that we could identify key microbes involved in the development of HT by comparing WKY and SHRSP microbiota during the pre-hypertensive state and longitudinally. Systolic blood pressure (SBP) was measured by tail-cuff plethysmography and fecal microbiota analyzed by16S rRNA gene sequencing. SHRSP showed significant elevations in SBP, as compared to WKY, beginning at 8 weeks of age (p < 0.05 at each time point). Bacterial community structure was significantly different between WKY and SHRSP as early as 4 weeks of age, and remained different throughout the study (p = 0.001-0.01). At the phylum level we observed significantly reduced Firmicutes and Deferribacterota, and elevated Bacteroidota, Verrucomicrobiota, and Proteobacteria, in pre-hypertensive SHRSP, as compared to WKY. At the genus level we identified 18 bacteria whose relative abundance was significantly different in SHRSP versus WKY at the pre-hypertensive ages of 4 or 6 weeks. In an attempt to further refine bacterial candidates that might contribute to the SHRSP phenotype, we compared the functional capacity of WKY versus SHRSP microbial communities. We identified significant differences in amino acid metabolism. Using untargeted metabolomics we found significant reductions in metabolites of the tryptophan-kynurenine pathway and increased indole metabolites in SHRSP versus WKY plasma. Overall, we provide further evidence that gut dysbiosis contributes to hypertension in the SHRSP model, and suggest for the first time the potential involvement of tryptophan metabolizing microbes.
© 2022. The Author(s).
Conflict of interest statement
The authors declare no competing interests.
Figures
Similar articles
-
Alterations in the gut microbiota can elicit hypertension in rats.Physiol Genomics. 2017 Feb 1;49(2):96-104. doi: 10.1152/physiolgenomics.00081.2016. Epub 2016 Dec 23. Physiol Genomics. 2017. PMID: 28011881 Free PMC article.
-
The gut microbiome contributes to blood-brain barrier disruption in spontaneously hypertensive stroke prone rats.FASEB J. 2021 Feb;35(2):e21201. doi: 10.1096/fj.202001117R. FASEB J. 2021. PMID: 33496989 Free PMC article.
-
Defective trophoblast invasion underlies fetal growth restriction and preeclampsia-like symptoms in the stroke-prone spontaneously hypertensive rat.Mol Hum Reprod. 2017 Jul 1;23(7):509-519. doi: 10.1093/molehr/gax024. Mol Hum Reprod. 2017. PMID: 28402512
-
Pathological alterations of astrocytes in stroke-prone spontaneously hypertensive rats under ischemic conditions.Neurochem Int. 2012 Jan;60(1):91-8. doi: 10.1016/j.neuint.2011.11.002. Epub 2011 Nov 15. Neurochem Int. 2012. PMID: 22100568 Review.
-
Astrocytic nutritional dysfunction associated with hypoxia-induced neuronal vulnerability in stroke-prone spontaneously hypertensive rats.Neurochem Int. 2020 Sep;138:104786. doi: 10.1016/j.neuint.2020.104786. Epub 2020 Jun 21. Neurochem Int. 2020. PMID: 32579896 Review.
Cited by
-
Distinct gut microbial signature and altered short chain fatty acid metabolism at disease onset in a rat preclinical model of superimposed preeclampsia.Sci Rep. 2024 Dec 30;14(1):32137. doi: 10.1038/s41598-024-83981-5. Sci Rep. 2024. PMID: 39738527 Free PMC article.
-
Aging Gut Microbiome in Healthy and Unhealthy Aging.Aging Dis. 2024 Mar 31;16(2):980-1002. doi: 10.14336/AD.2024.0331. Aging Dis. 2024. PMID: 38607737 Free PMC article. Review.
-
The Emerging Role of the Aging Process and Exercise Training on the Crosstalk between Gut Microbiota and Telomere Length.Int J Environ Res Public Health. 2022 Jun 25;19(13):7810. doi: 10.3390/ijerph19137810. Int J Environ Res Public Health. 2022. PMID: 35805470 Free PMC article. Review.
-
The Role of Gut Microbiota in Blood-Brain Barrier Disruption after Stroke.Mol Neurobiol. 2024 Dec;61(12):9735-9755. doi: 10.1007/s12035-023-03512-7. Epub 2023 Jul 27. Mol Neurobiol. 2024. PMID: 37498481 Review.
-
Lung-Gut Microbiota and Tryptophan Metabolites Changes in Neonatal Acute Respiratory Distress Syndrome.J Inflamm Res. 2024 May 15;17:3013-3029. doi: 10.2147/JIR.S459496. eCollection 2024. J Inflamm Res. 2024. PMID: 38764492 Free PMC article.
References
Publication types
MeSH terms
Substances
Grants and funding
LinkOut - more resources
Full Text Sources
Medical
