. 2022 May 20;5(1):487.
doi: 10.1038/s42003-022-03437-2.

Chemical fixation creates nanoscale clusters on the cell surface by aggregating membrane proteins

Affiliations

Chemical fixation creates nanoscale clusters on the cell surface by aggregating membrane proteins

Takehiko Ichikawa et al. Commun Biol. .

Abstract

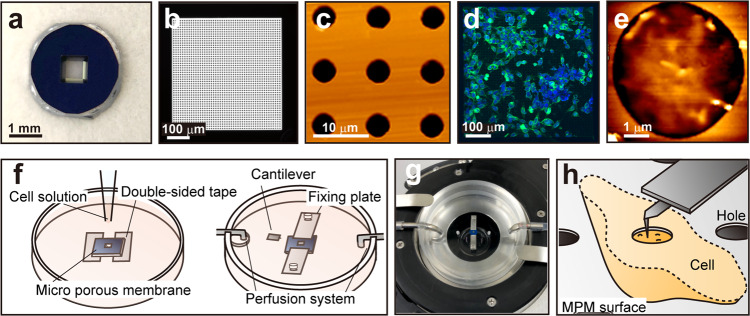
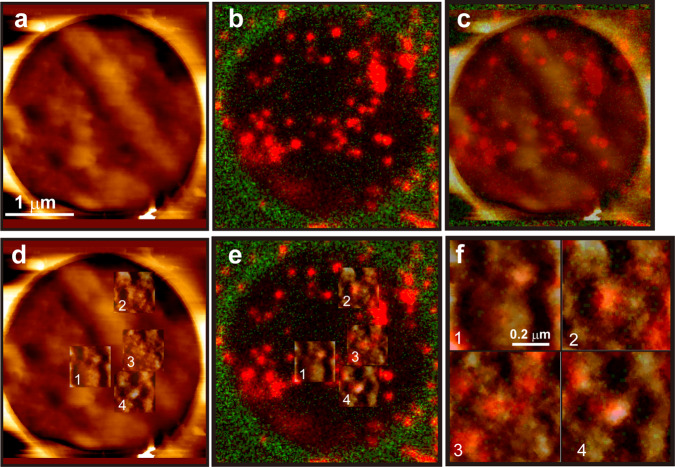
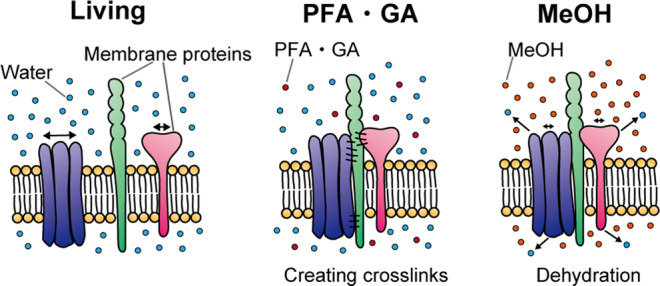
Chemical fixations have been thought to preserve the structures of the cells or tissues. However, given that the fixatives create crosslinks or aggregate proteins, there is a possibility that these fixatives create nanoscale artefacts by aggregation of membrane proteins which move around freely to some extent on the cell surface. Despite this, little research has been conducted about this problem, probably because there has been no method for observing cell surface structures at the nanoscale. In this study, we have developed a method to observe cell surfaces stably and with high resolution using atomic force microscopy and a microporous silicon nitride membrane. We demonstrate that the size of the protrusions on the cell surface is increased after treatment with three commonly used fixatives and show that these protrusions were created by the aggregation of membrane proteins by fixatives. These results call attention when observing fixed cell surfaces at the nanoscale.


Conflict of interest statement

The authors declare no competing interests.

Figures

Fig. 1
Fig. 1. Microporous silicon nitride membrane (MPM) and its application to the cell surface observation in AFM imaging.
a Appearance of MPM (NH050D549, Norcada); frame size 2.6 × 2.6 mm, frame thickness 0.2 mm, membrane size 0.5 × 0.5 mm, membrane thickness 200 nm, hole diameter 5 μm, hole pitch 10 μm. b The transmitted light image of the membrane. c AFM image of the hole of the membrane. d Cultured DLD-1 cells on MPM. The cell membrane and nuclei are stained green and blue, respectively. e AFM image of the DLD-1 cell surface on the MPM hole. f Schematic diagram of the method for culturing and observing the cell surface using MPM. g Photo of the area around the sample. h Schematic diagram of the AFM observation of the cell surface using MPM.
Fig. 2
Fig. 2. AFM images of the DLD-1 cell surface and the effect of the chemical fixation.
a AFM image of the living DLD-1 cell surface without MPM in 2.5 × 2.5 μm scale. b 0.5 × 0.5 μm scale image. c Three consecutive images of 100 × 100 nm scale at the same position acquired every 2 min. Arrowheads of the same colors indicate the same protrusions. d Superimposed image of the third image in c with the boundary of the recognized protrusion area (white line) through the auto-recognition tool. e Height profile along the line in c. f AFM image of the living DLD-1 cell surface using MPM in 2.5 × 2.5 μm scale. g 0.5 × 0.5 μm scale image. h Three consecutive images of 100 × 100 nm scale at the same position acquired every 2 min. Arrowheads of the same colors indicate the same protrusions. i Superimposed image of the third image in h with the boundary of the recognized protrusion area (white line). j Height profile along the line in h. k AFM image after treatment with 4% PFA using MPM on 2.5 × 2.5 μm scale. l 0.5 × 0.5 μm scale image. m Three consecutive images of 100 × 100 nm scale. n Superimposed image of the third image in m with the boundary of the recognized protrusion area (white line). o Height profile along the line in m. p AFM image after treatment with 2% GA using MPM on 2.5 × 2.5 μm scale. q 0.5 × 0.5 μm scale image. r Three consecutive images of 100 × 100 nm scale. s Superimposed image of the third image in r with the boundary of the recognized protrusion area (white line). t Height profile along the line in r. u AFM image after treatment with cold 100% MeOH using MPM on 2.5 × 2.5 μm scale. v 0.5 × 0.5 μm scale image. w Three consecutive images of 100 × 100 nm scale. x Superimposed image of the third image in w with the boundary of the recognized area (white line). y Height profile along the line in w. z Distributions of the protrusion area on the surface of living or fixed cells using MPM (n = 27 averages per image for living, 25 for PFA, 46 for GA, 38 for MeOH). Red bars indicate median values. Asterisks (** or ***) denote statistical significance (p < 0.01 or p < 0.001, Mann–Whitney U test). aa Distributions of the nearest distance between protrusions on the cell surface of living or fixed cells using MPM (n = 129 averages per image for living, 129 for PFA, 114 for GA, 120 for MeOH). Red bars indicate median values. Asterisks (** or ***) denote statistical significance (p < 0.01 or p < 0.001, Mann–Whitney U test). We used BL-AC40TS-C2 cantilevers (Olympus, spring constant ∼0.1 N/m).
Fig. 3
Fig. 3. Nearest distance of two kinds of membrane proteins and the effect of fixatives.
a EpCAM image of a living cell. b E-cadherin image of the same cell as a. c Superimposed image of EpCAM (a green) and E-cadherin (b red). d EpCAM image after 4% PFA treatment. e E-cadherin image of the same cell as d. f Superimposed image of EpCAM (d, green) and E-cadherin (e red). g EpCAM image after 2% GA treatment. h E-cadherin image of the same cell as g. i Superimposed image of EpCAM (g green) and E-cadherin (h red). j EpCAM image after 100% EtOH treatment. k E-cadherin image of the same cell as j. l Superimposed image of EpCAM (j, green) and E-cadherin (k red). m Distribution of the average nearest distance per cell. n = 14 (living), 15 (PFA), 13 (GA) and 14 (MeOH). Red lines indicate mean values. Asterisks (*, ** and ***) denote statistical significance (p < 0.05, 0.01 and 0.001, two-sided t test). n Time series during fixation. EpCAM (green) and E-cadherin (red) are presented. Arrowheads indicate the same molecule. The scale bar is 1 μm. 2% GA was added at 0 s. o Time-lapse change of the distance from the E-cadherin indicated in n to the nearest EpCAM. The dotted line indicates the time point of GA addition. p Model of the behavior of membrane proteins during fixation. Before adding fixatives, membrane proteins approach and move apart from each other. However, after adding a fixative, proteins cannot move apart once they make contact.
Fig. 4
Fig. 4. Correspondence of AFM and STED image.
a AFM image of DLD-1 cell cultured on 3 μm MPM after fixation using 2% GA. b STED image of the same position and scale depicted on a. Red spots indicate the localization of E-cadherin. The green color shows the MPM surface. c Superimposed image of AFM and fluorescence images. d Superimposed image of cropped and contrast adjusted AFM image and original AFM image. e Superimposed image of cropped AFM image and STED image. f Magnified overlayed image of e. Numbers correspond in e.
Fig. 5
Fig. 5. AFM measurement after treatment of Cytochalasin D.
We treated the DLD-1 cells on MPM with 10 μM Cytochalasin D for 15 min and then fixed them with 2% GA. a 2.5 × 2.5 μm scale image. b 0.5 × 0.5 μm scale image. c Three consecutive images of 100 × 100 nm. d Superimposed image of the third image in c with the boundary of the recognized protrusion area (white line). e Height profile along the line in c. FWHM is 15.6 nm.
Fig. 6
Fig. 6. Model of the fixation mechanism of membrane proteins using aldehyde or alcohol fixatives.
Aldehyde fixatives (such as PFA and GA) directly create crosslinks between membrane proteins. Thus the nearest distance between membrane proteins is thought to be close. In contrast, alcohol fixatives (such as MeOH) dehydrate and precipitate proteins. Therefore, it can be thought that the binding between membrane proteins is loose, and the nearest distances are not very close. This difference reflects the weak effect of MeOH in Figs. 2 and 3.

Similar articles

Cited by

References

    1. Sabatini DD, Bensch K, Barrnett RJ. Cytochemistry and electron microscopy. The preservation of cellular ultrastructure and enzymatic activity by aldehyde fixation. J. Cell Biol. 1963;17:19–58. doi: 10.1083/jcb.17.1.19. - DOI - PMC - PubMed
    1. Hopwood D. Cell and tissue fixation, 1972-1982. Histochem. J. 1985;17:389–442. doi: 10.1007/BF01003203. - DOI - PubMed
    1. Ramos-Vara JA. Principles and methods of immunohistochemistry. Methods Mol. Biol. 2017;1641:115–128. doi: 10.1007/978-1-4939-7172-5_5. - DOI - PubMed
    1. Kiernan JA. Formaldehyde, formalin, paraformaldehyde and glutaraldehyde: what they are and what they do. Microsc. Today. 2000;1:8–12. doi: 10.1017/S1551929500057060. - DOI
    1. Eltoum I, Fredenburgh J, Myers RB, Grizzle WE. Introduction to the theory and practice of fixation of tissues. J. Histotechnol. 2001;24:173–190. doi: 10.1179/his.2001.24.3.173. - DOI

Publication types