. 2022 May;8(5):583-595.
doi: 10.1038/s41477-022-01153-7. Epub 2022 May 19.

Modelling the pyrenoid-based CO2-concentrating mechanism provides insights into its operating principles and a roadmap for its engineering into crops

Affiliations

Modelling the pyrenoid-based CO2-concentrating mechanism provides insights into its operating principles and a roadmap for its engineering into crops

Chenyi Fei et al. Nat Plants. 2022 May.

Abstract

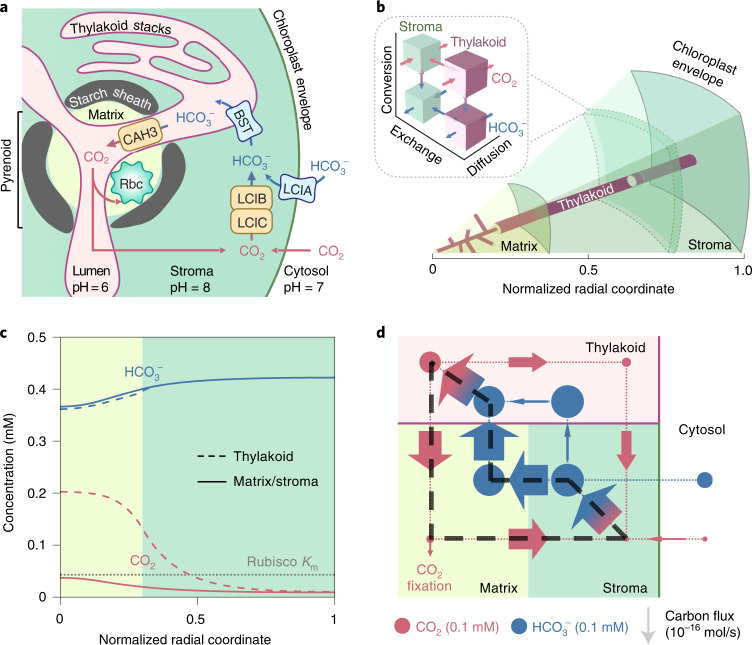
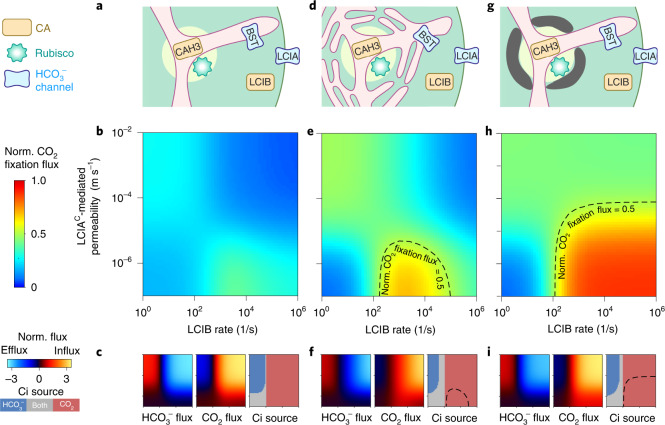
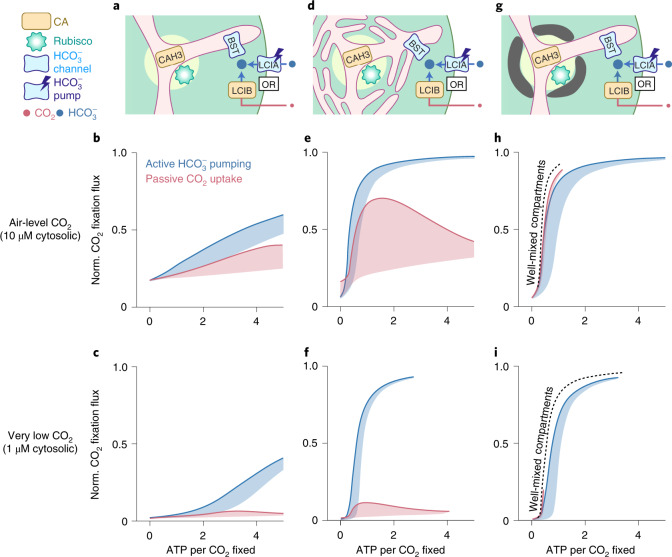
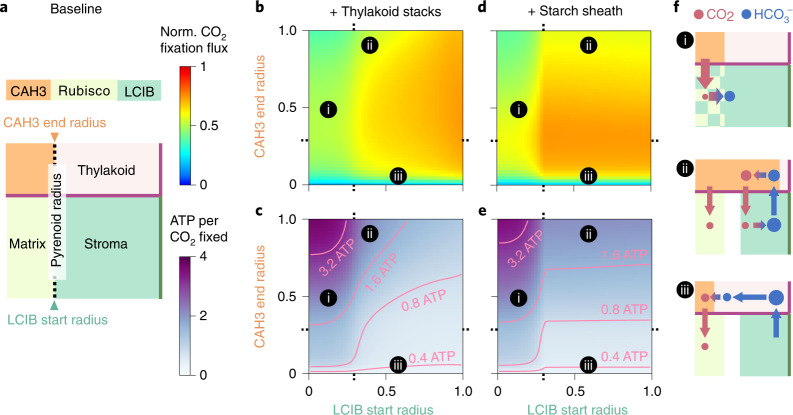
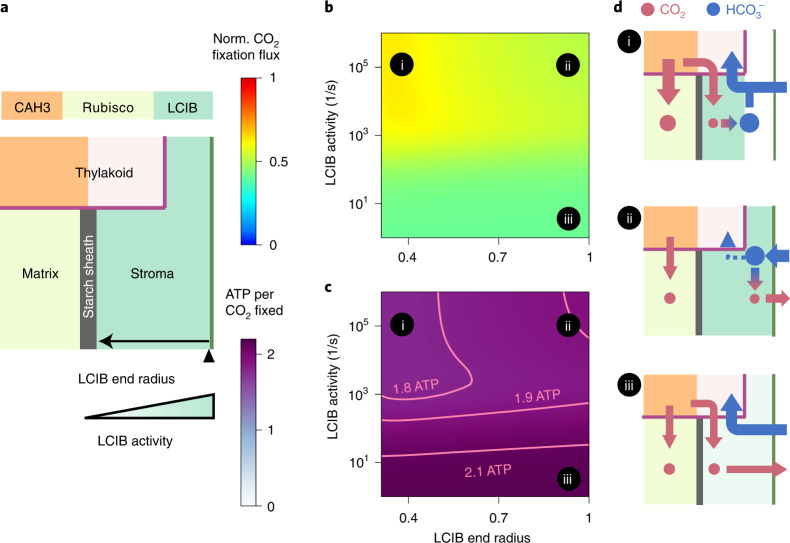
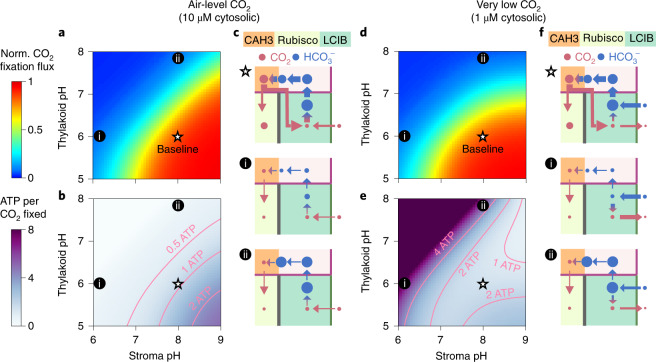
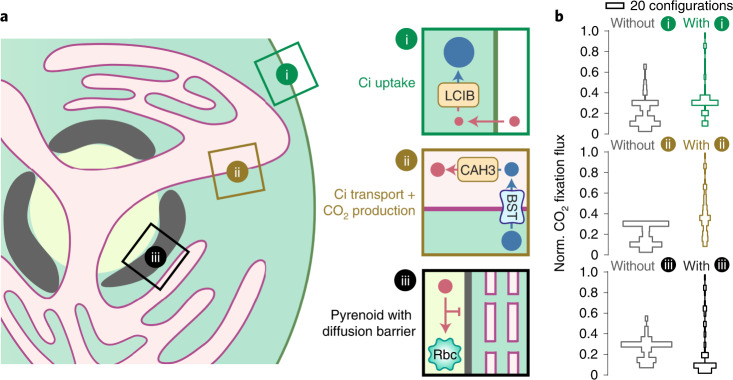
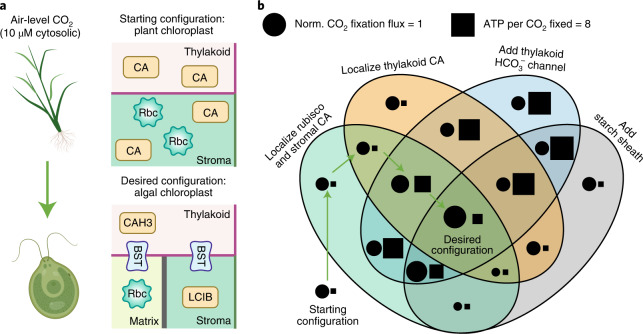
Many eukaryotic photosynthetic organisms enhance their carbon uptake by supplying concentrated CO2 to the CO2-fixing enzyme Rubisco in an organelle called the pyrenoid. Ongoing efforts seek to engineer this pyrenoid-based CO2-concentrating mechanism (PCCM) into crops to increase yields. Here we develop a computational model for a PCCM on the basis of the postulated mechanism in the green alga Chlamydomonas reinhardtii. Our model recapitulates all Chlamydomonas PCCM-deficient mutant phenotypes and yields general biophysical principles underlying the PCCM. We show that an effective and energetically efficient PCCM requires a physical barrier to reduce pyrenoid CO2 leakage, as well as proper enzyme localization to reduce futile cycling between CO2 and HCO3-. Importantly, our model demonstrates the feasibility of a purely passive CO2 uptake strategy at air-level CO2, while active HCO3- uptake proves advantageous at lower CO2 levels. We propose a four-step engineering path to increase the rate of CO2 fixation in the plant chloroplast up to threefold at a theoretical cost of only 1.3 ATP per CO2 fixed, thereby offering a framework to guide the engineering of a PCCM into land plants.


Conflict of interest statement

The authors declare no competing interests.

Figures

Fig. 1
Fig. 1. A multicompartment reaction-diffusion model describes the Chlamydomonas PCCM.
a, Cartoon of a Chlamydomonas chloroplast with known PCCM components. HCO3 is transported across the chloroplast membrane by LCIA and across the thylakoid membranes by BST1–3 (referred to as BST henceforth for simplicity). In the acidic thylakoid lumen, a carbonic anhydrase CAH3 converts HCO3 into CO2, which diffuses into the pyrenoid matrix where the CO2-fixing enzyme Rubisco (Rbc) is localized. CO2 leakage out of the matrix and the chloroplast can be impeded by potential diffusion barriers—a starch sheath and stacks of thylakoids—and by conversion to HCO3 by a CO2-recapturing complex LCIB/LCIC (referred to as LCIB henceforth for simplicity) in the basic chloroplast stroma. b, A schematic of the modelled PCCM, which considers intracompartment diffusion and intercompartment exchange of CO2 and HCO3, as well as their interconversion, as indicated in the inset. Colour code as in a. The model is spherically symmetric and consists of a central pyrenoid matrix surrounded by a stroma. Thylakoids run through the matrix and stroma; their volume and surface area correspond to a reticulated network at the centre of the matrix extended by cylinders running radially outward. c, Concentration profiles of CO2 and HCO3 in the thylakoid (dashed curves) and in the matrix/stroma (solid curves) for the baseline PCCM model that lacks LCIA activity and diffusion barriers. Dotted grey line indicates the effective Rubisco Km for CO2 (Methods). Colour code as in a. d, Net fluxes of inorganic carbon between the indicated compartments. The width of arrows is proportional to flux; the area of circles is proportional to the average molecular concentration in the corresponding regions. The black dashed loop denotes the major futile cycle of inorganic carbon in the chloroplast. Colour code as in a. For c and d, LCIAC-mediated chloroplast membrane permeability to HCO3 κchlorH = 10−8 m s−1, BST-mediated thylakoid membrane permeability to HCO3 κthyH = 10−2 m s−1, LCIB rate VLCIB = 103 s−1 and CAH3 rate VCAH3 = 104 s−1 (Methods). Other model parameters are estimated from experiments (Supplementary Table 2).
Fig. 2
Fig. 2. Barriers to CO2 diffusion out of the pyrenoid matrix enable an effective PCCM driven only by intercompartmental pH differences.
ai, A model with no barrier to CO2 diffusion out of the pyrenoid matrix (ac) is compared to a model with thylakoid stacks slowing inorganic carbon diffusion in the stroma (df) and a model with an impermeable starch sheath (gi) under air-level CO2 (10 µM cytosolic). a,d,g, Schematics of the modelled chloroplast. b,e,h, Heatmaps of normalized CO2 fixation flux, defined as the ratio of the total Rubisco carboxylation flux to its maximum if Rubisco were saturated, at varying LCIAC-mediated chloroplast membrane permeabilities to HCO3 and varying LCIB rates. The BST-mediated thylakoid membrane permeability to HCO3 is the same as in Fig. 1c,d. For e and h, dashed black curves indicate a normalized CO2 fixation flux of 0.5. c,f,i, Overall fluxes of HCO3 (left) and CO2 (middle) into the chloroplast, normalized by the maximum CO2 fixation flux if Rubisco were saturated, at varying LCIAC-mediated chloroplast membrane permeabilities to HCO3 and varying LCIB rates. Negative values denote efflux out of the chloroplast. The inorganic carbon (Ci) species with a positive influx is defined as the Ci source (right). Axes are the same as in b, e and h.
Fig. 3
Fig. 3. Feasible inorganic carbon uptake strategies for the chloroplast depend on the environmental level of CO2.
ai, Results are shown for a model with no barrier to CO2 diffusion out of the pyrenoid matrix (ac), a model with thylakoid stacks serving as diffusion barriers (df) and a model with an impermeable starch sheath (gi). a,d,g, Schematics of the modelled chloroplast employing LCIB for passive CO2 uptake (red), or employing active LCIAP-mediated HCO3 pumping across the chloroplast envelope and no LCIB activity (blue). PCCM performance under air-level CO2 (10 µM cytosolic) (b,e,h) and under very low CO2 (1 µM cytosolic) (c,f,i) are shown, as measured by normalized CO2 fixation flux versus ATP spent per CO2 fixed, for the two inorganic carbon uptake strategies in a, d and g. Solid curves indicate the minimum energy cost necessary to achieve a certain normalized CO2 fixation flux. Shaded regions represent the range of possible performances found by varying HCO3 transport rates and LCIB rates. Colour code as in a. In h and i, dashed black curves indicate the optimal PCCM performance of a simplified model that assumes fast intracompartmental diffusion, fast HCO3 diffusion across the thylakoid membranes, and fast equilibrium between CO2 and HCO3 catalysed by CAH3 in the thylakoid tubules inside the pyrenoid (Methods).
Fig. 4
Fig. 4. Proper localization of carbonic anhydrases enhances PCCM performance.
a, Schematics of varying localization of carbonic anhydrases. The CAH3 domain starts in the centre of the intrapyrenoid tubules (radius r = 0) and the LCIB domain ends at the chloroplast envelope. Colour code as in Fig. 1d. Orange denotes region occupied by CAH3. be, CAH3 end radius and LCIB start radius are varied in a modelled chloroplast employing the passive CO2 uptake strategy under air-level CO2, with thylakoid stacks slowing inorganic carbon diffusion in the stroma (b,c) or with an impermeable starch sheath (d,e). Normalized CO2 fixation flux (b,d) and ATP spent per CO2 fixed (c,e) when the localizations of carbonic anhydrases are varied. f, Schematics of inorganic carbon fluxes for the localization patterns (i–iii) indicated in be. Colour code as in a and Fig. 1d. Dotted ticks in be denote pyrenoid radius as in a. Simulation parameters are the same as in Fig. 1c,d.
Fig. 5
Fig. 5. Localization of LCIB around the pyrenoid periphery reduces Ci leakage out of the chloroplast.
a, Schematics of varying activity and end radius of LCIB in a modelled chloroplast employing an impermeable starch sheath and active HCO3 pumping across the chloroplast envelope under very low CO2. Colour code as in Fig. 4a. The LCIB domain starts at the pyrenoid radius (0.3 on the x axis in b and c). b,c, Normalized CO2 fixation flux (b) and ATP spent per CO2 fixed (c) when the designated characteristics of LCIB are varied. d, Schematics of inorganic carbon fluxes for the LCIB states (i–iii) indicated in b and c. Colour code as in Fig. 4f. Simulation parameters as in Fig. 4. Active LCIAP-mediated HCO3 pumping is described by the rate κchlorH = 10−4 m s−1 and the reversibility γ = 10−4. To show a notable variation in normalized CO2 fixation flux, a model with shortened thylakoid tubules is simulated (Methods). The qualitative results hold true independent of this specific choice.
Fig. 6
Fig. 6. High PCCM performance requires low-pH thylakoids and a high-pH stroma.
af, pH values of the thylakoid lumen and the stroma are varied in a modelled chloroplast with an impermeable starch sheath employing passive CO2 uptake under air-level CO2 (ac) (10 μM cytosolic; parameters as in Fig. 4d,e) or active HCO3 pumping under very low CO2 (df) (1 μM cytosolic, parameters as in Supplementary Fig. 17c,d). Normalized CO2 fixation flux (a,d) and ATP spent per CO2 fixed (b,e) as functions of the pH values in the two compartments are shown. c,f, Schematics of inorganic carbon pools and fluxes for the pH values indicated in a, b, d and e. White stars indicate the baseline pH values used in all other simulations.
Fig. 7
Fig. 7. An effective PCCM is composed of three essential modules.
a, Schematics of the three essential modules with designated functions (same style as in Fig. 1a). In Chlamydomonas, LCIB can be used for passive uptake of CO2, which is then trapped in the stroma as HCO3 (module i); BST allows stromal HCO3 to diffuse into the thylakoid lumen where CAH3 converts HCO3 into CO2 (module ii); and a starch sheath and thylakoid stacks could act as diffusion barriers to slow CO2 escape out of the pyrenoid matrix (module iii). b, Histograms of normalized CO2 fixation flux for CCM configurations without (left, grey) or with (right, coloured) the respective module. We tested 216 CCM configurations by varying the presence and/or localization of enzymes, HCO3 channels and diffusion barriers in the model (see Supplementary Fig. 26).
Fig. 8
Fig. 8. Proposed engineering path for installing a minimal PCCM into land plants.
a, Top: schematics of the starting configuration representing a typical plant chloroplast that contains diffuse thylakoid carbonic anhydrase, diffuse stromal carbonic anhydrase, and diffuse Rubisco, and lacks HCO3 transporters and diffusion barriers. Bottom: the desired configuration representing a Chlamydomonas chloroplast that employs the passive CO2 uptake strategy and a starch sheath (as in Fig. 2g). b, Venn diagram showing the normalized CO2 fixation flux (circle, area in proportion to magnitude) and ATP spent per CO2 fixed (square, area in proportion to magnitude) of various configurations after implementing the designated changes. Arrows denote the proposed sequential steps to transform the starting configuration into the desired configuration (see text). The starting configuration has a normalized CO2 fixation flux of 0.31 and negligible ATP cost. All costs below 0.25 ATP per CO2 fixed are represented by a square of the minimal size.

References

    1. Phillips R, Milo R. A feeling for the numbers in biology. Proc. Natl Acad. Sci. USA. 2009;106:21465–21471. doi: 10.1073/pnas.0907732106. - DOI - PMC - PubMed
    1. Field CB, Behrenfeld MJ, Randerson JT, Falkowski P. Primary production of the biosphere: integrating terrestrial and oceanic components. Science. 1998;281:237–240. doi: 10.1126/science.281.5374.237. - DOI - PubMed
    1. Bar-On YM, Milo R. The global mass and average rate of Rubisco. Proc. Natl Acad. Sci. USA. 2019;116:4738–4743. doi: 10.1073/pnas.1816654116. - DOI - PMC - PubMed
    1. Tcherkez GGB, Farquhar GD, Andrews TJ. Despite slow catalysis and confused substrate specificity, all ribulose bisphosphate carboxylases may be nearly perfectly optimized. Proc. Natl Acad. Sci. USA. 2006;103:7246–7251. doi: 10.1073/pnas.0600605103. - DOI - PMC - PubMed
    1. Andersson I. Catalysis and regulation in Rubisco. J. Exp. Bot. 2008;59:1555–1568. doi: 10.1093/jxb/ern091. - DOI - PubMed

MeSH terms

Substances