

Effect of osmotic stress on live cell plasma membranes, probed via Laurdan general polarization measurements
- PMID: 35596525
- PMCID: PMC9279170
- DOI: 10.1016/j.bpj.2022.05.016
Effect of osmotic stress on live cell plasma membranes, probed via Laurdan general polarization measurements
Abstract
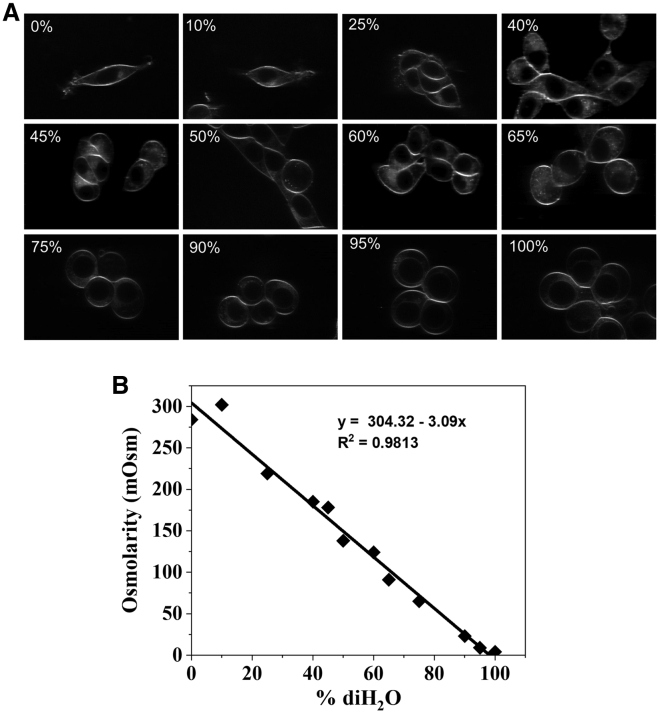
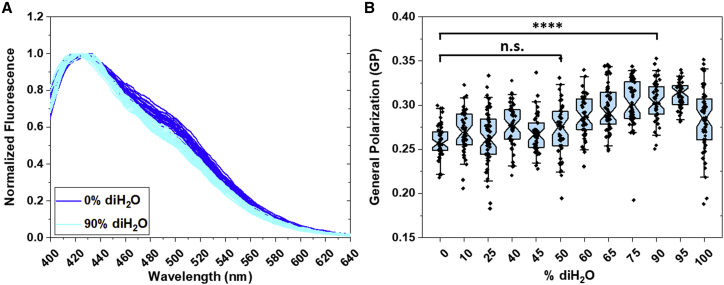
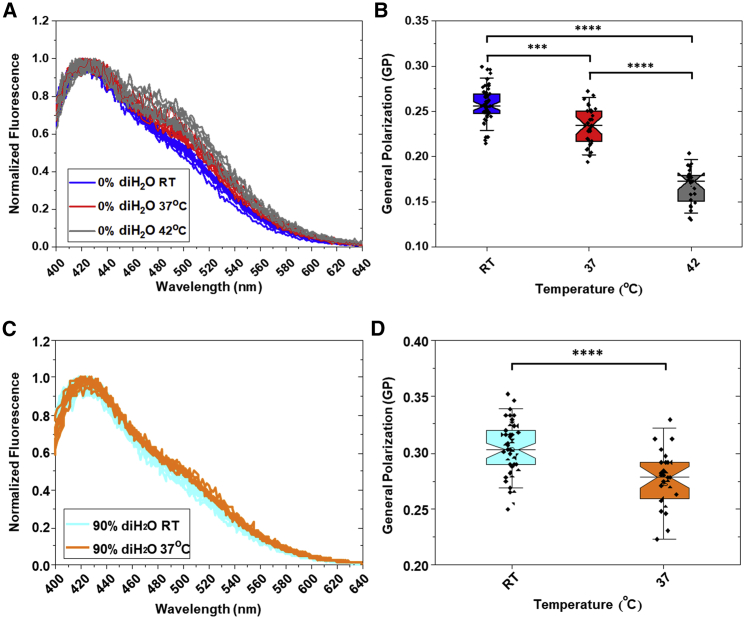
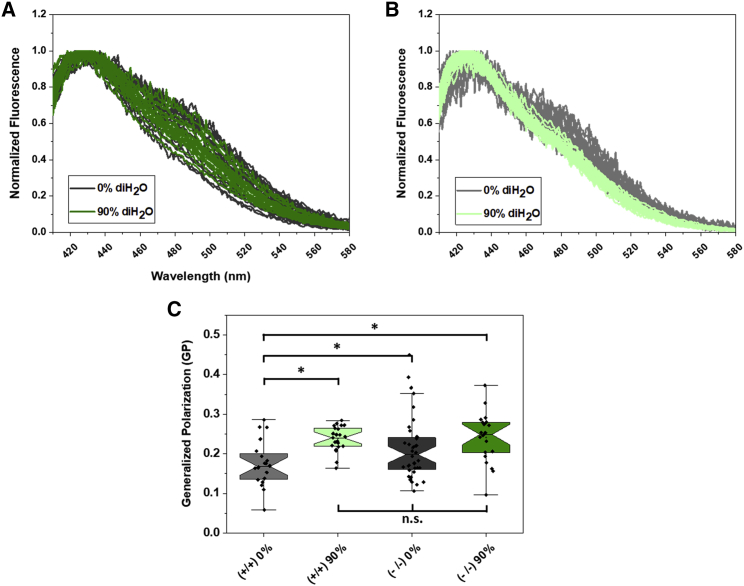
Here we seek to gain insight into changes in the plasma membrane of live cells upon the application of osmotic stress using Laurdan, a fluorescent probe that reports on membrane organization, hydration, and dynamics. It is known that the application of osmotic stress to lipid vesicles causes a decrease in Laurdan's generalized polarization (GP), which has been interpreted as an indication of membrane stretching. In cells, we see the opposite effects, as GP increases when the osmolarity of the solution is decreased. This increase in GP is associated with the presence of caveolae, which are known to disassemble and flatten in response to osmotic stress.
Copyright © 2022 Biophysical Society. Published by Elsevier Inc. All rights reserved.
Conflict of interest statement
Declaration of interests The authors declare no competing interests.
Figures


Similar articles
-
Use of laurdan fluorescence intensity and polarization to distinguish between changes in membrane fluidity and phospholipid order.Biochim Biophys Acta. 2002 Sep 20;1565(1):123-8. doi: 10.1016/s0005-2736(02)00514-x. Biochim Biophys Acta. 2002. PMID: 12225860
-
Water dynamics in glycosphingolipid aggregates studied by LAURDAN fluorescence.Biophys J. 1998 Jul;75(1):331-41. doi: 10.1016/S0006-3495(98)77517-4. Biophys J. 1998. PMID: 9649390 Free PMC article.
-
Time-Resolved Laurdan Fluorescence Reveals Insights into Membrane Viscosity and Hydration Levels.Biophys J. 2018 Oct 16;115(8):1498-1508. doi: 10.1016/j.bpj.2018.08.041. Epub 2018 Sep 6. Biophys J. 2018. PMID: 30269886 Free PMC article.
-
Disorder Amidst Membrane Order: Standardizing Laurdan Generalized Polarization and Membrane Fluidity Terms.J Fluoresc. 2017 Jan;27(1):243-249. doi: 10.1007/s10895-016-1951-8. Epub 2016 Oct 13. J Fluoresc. 2017. PMID: 27738919 Review.
-
Visualizing membrane microdomains by Laurdan 2-photon microscopy.Mol Membr Biol. 2006 Jan-Feb;23(1):41-8. doi: 10.1080/09687860500466857. Mol Membr Biol. 2006. PMID: 16611579 Review.
References
Publication types
MeSH terms
Substances
LinkOut - more resources
Full Text Sources
