. 2022 Aug;23(8):e13646.
doi: 10.1002/acm2.13646. Epub 2022 May 20.

Static MLC transmission simulation using two-dimensional ray tracing

Affiliations

Static MLC transmission simulation using two-dimensional ray tracing

David P Adam et al. J Appl Clin Med Phys. 2022 Aug.

Abstract

Purpose: We investigated the hypothesis that the transmission function of rounded end linearly traveling multileaf collimators (MLCs) is constant with position. This assumption is made by some MLC models used in clinical treatment planning systems (TPSs) and in the Varian MLC calibration convention. If not constant, this would have implications for treatment plan QA results.

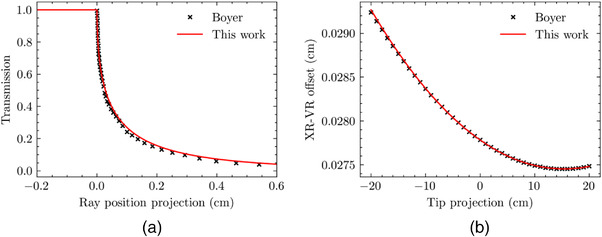
Methods: A two-dimensional ray-tracing tool to generate transmission curves as a function of leaf position was created and validated. The curves for clinically available leaf tip positions (-20 to 20 cm) were analyzed to determine the location of the beam edge (half-attenuation X-ray [XR]) location, the beam edge broadening (BEB, 80%-20% width), as well as the leaf tip zone width. More generalized scenarios were then simulated to elucidate trends as a function of leaf tip radius.

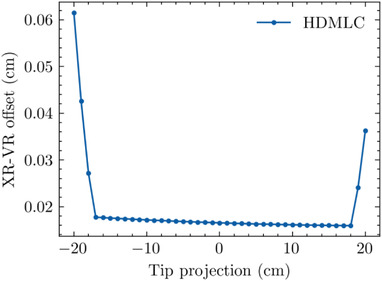
Results: In the analysis of the Varian high-definition MLC, two regions were identified: a quasi-static inner region centered about central axis (CAX), and an outer one, in which large deviations were observed. A phenomenon was identified where the half-attenuation ray position, relative to that of the tip or tangential ray, increases dramatically at definitive points from CAX. Similar behavior is seen for BEB. An analysis shows that as the leaf radius parameter value is made smaller, the size of the quasi-static region is greater (and vice versa).

Conclusion: The MLC transmission curve properties determined by this study have implications both for MLC position calibrations and modeling within TPSs. Two-dimensional ray tracing can be utilized to identify where simple behaviors hold, and where they deviate. These results can help clinical physicists engage with vendors to improve MLC models, subsequent fluence calculations, and hence dose calculation accuracy.

Keywords: HDMLC calibration; MLC modeling; ray tracing.


Conflict of interest statement

BB is a cofounder and has an ownership interest in Voximetry, Inc., a nuclear medicine dosimetry company in Madison, WI.

Figures

FIGURE 1
FIGURE 1
Diagram depicting geometry, ray classification, and relation to a transmission curve. The diagram is not to scale, and the MLC features are exaggerated. For clarity, the leaf is on the CAX, and thus the TR and VR are at the same location. CAX, central axis; MLC, multileaf collimator; TR, tip ray; VR, visible ray
FIGURE 2
FIGURE 2
Comparison of (a) transmission curves and (b) XVO between the ray‐tracing tool and the analytical expressions published by Boyer. XVO, X‐ray visible offset
FIGURE 3
FIGURE 3
Transmission curves at different TR values. The inset figure includes only TR values of 0 (CAX), 10, and 20 cm to show the spread. Other positions lie in a progression from one curve to the other. CAX, central axis; TR, tip‐ray
FIGURE 4
FIGURE 4
Depiction of leaf intersections for an HDMLC leaf tip model at a TR of (a) −2 and (c) −20 cm. Leaf boundaries are depicted in black, the VR is depicted as a red point, and the XR intersection points are portrayed in magenta. A path length analysis is shown in (b) and (d), with the corresponding ray lengths in the tip (green) and body portions of the leaf (blue). HDMLC, high definition‐multileaf collimator; TR, tip‐ray; VR, visible ray; XR, X‐ray
FIGURE 5
FIGURE 5
(a) TZW for the HDMLC as a function of TR and (b) diagram depicting the geometric rationale as to why the TZW is minimized at a TR of −1 cm. In (b), the diagram is not to scale. HDMLC, high‐definition multileaf collimator; TR, tip‐ray; TZW, tip zone width
FIGURE 6
FIGURE 6
XVO as a function of tip position for the HDMLC as a function of TR. HDMLC, high‐definition multileaf collimator; TR, tip‐ray; XVO, X‐ray visible offset
FIGURE 7
FIGURE 7
Depiction of TR at which the XVO Xbreak occurs as a function of tip radius. The smooth line is a fit to the calculated data points. TR, tip‐ray; XVO, X‐ray visible offset
FIGURE 8
FIGURE 8
BEB (80%–20% width) as a function of tip position for HDMLC. BEB, beam edge broadening; HDMLC, high‐definition multileaf collimator
FIGURE 9
FIGURE 9
Depiction of TR at which the BEB Xbreak occurs as a function of tip radius. The smooth line is a fit to the calculated data points. BEB, beam edge broadening; TR, tip‐ray

Similar articles

Cited by

References

    1. LoSasso T, Chui CS, Ling CC. Physical and dosimetric aspects of a multileaf collimation system used in the dynamic mode for implementing intensity modulated radiotherapy. Med Phys. 1998;25(10):1919‐1927. doi:10.1118/1.598381 - DOI - PubMed
    1. LoSasso T, Chui CS, Ling CC. Comprehensive quality assurance for the delivery of intensity modulated radiotherapy with a multileaf collimator used in the dynamic mode. Med Phys. 2001;28(11):2209‐2219. doi:10.1118/1.1410123 - DOI - PubMed
    1. Chen Y, Boyer AL, Ma CM. Calculation of x‐ray transmission through a multileaf collimator. Med Phys. 2000;27(8):1717‐1726. doi:10.1118/1.1286555 - DOI - PubMed
    1. Fix MK, Volken W, Frei D, Frauchiger D, Born EJ, Manser P. Monte Carlo implementation, validation, and characterization of a 120 leaf MLC. Med Phys. 2011;38(10):5311‐5320. doi:10.1118/1.3626485 - DOI - PubMed
    1. Zygmanski P, Rosca F, Kadam D, Lrenz F, Nalichowski A, Chin L. Determination of depth and field size dependence of MLC transmission. J Appl Clin Med Phys. 2007;8(4):76‐95. doi:10.1120/jacmp.v8i4.2693 - DOI - PMC - PubMed