. 2022 Jul;144(1):81-106.
doi: 10.1007/s00401-022-02437-0. Epub 2022 May 21.

Trafficking of the glutamate transporter is impaired in LRRK2-related Parkinson's disease

Affiliations

Trafficking of the glutamate transporter is impaired in LRRK2-related Parkinson's disease

Ludovica Iovino et al. Acta Neuropathol. 2022 Jul.

Abstract

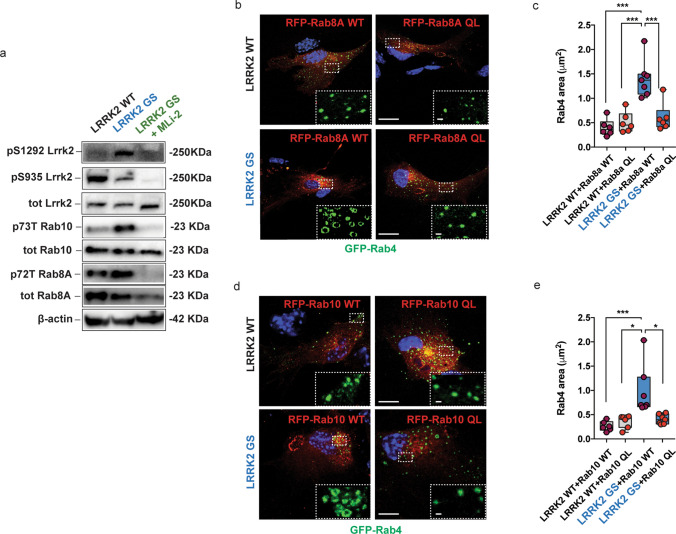
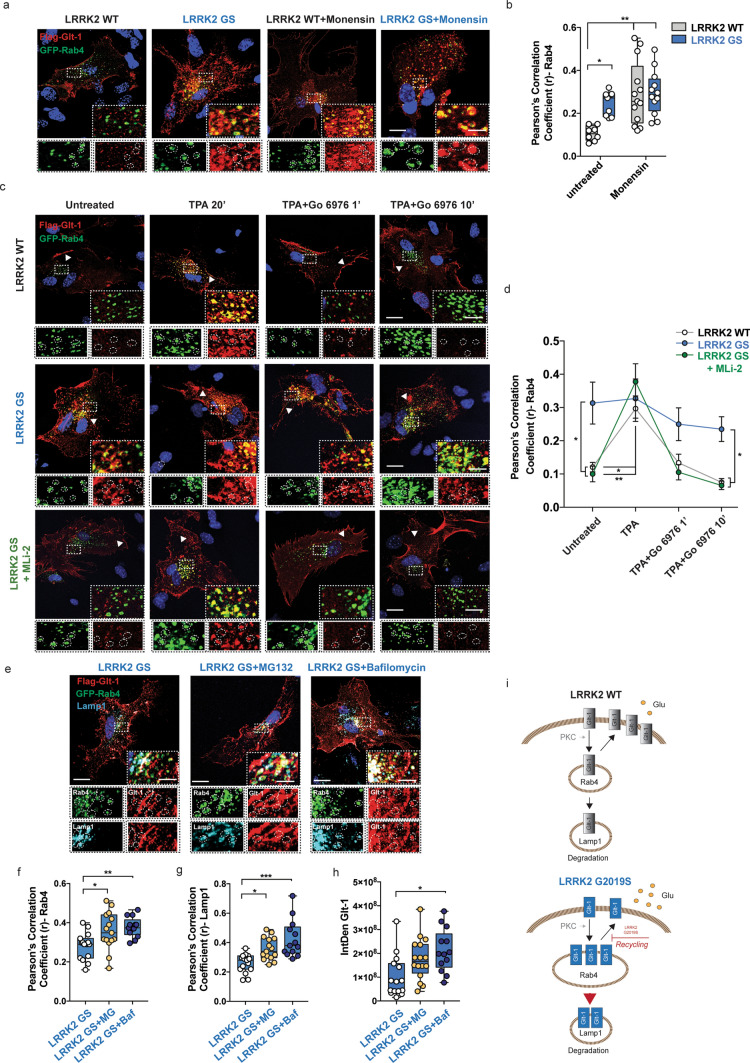
The Excitatory Amino Acid Transporter 2 (EAAT2) accounts for 80% of brain glutamate clearance and is mainly expressed in astrocytic perisynaptic processes. EAAT2 function is finely regulated by endocytic events, recycling to the plasma membrane and degradation. Noteworthy, deficits in EAAT2 have been associated with neuronal excitotoxicity and neurodegeneration. In this study, we show that EAAT2 trafficking is impaired by the leucine-rich repeat kinase 2 (LRRK2) pathogenic variant G2019S, a common cause of late-onset familial Parkinson's disease (PD). In LRRK2 G2019S human brains and experimental animal models, EAAT2 protein levels are significantly decreased, which is associated with elevated gliosis. The decreased expression of the transporter correlates with its reduced functionality in mouse LRRK2 G2019S purified astrocytic terminals and in Xenopus laevis oocytes expressing human LRRK2 G2019S. In LRRK2 G2019S knock-in mouse brain, the correct surface localization of the endogenous transporter is impaired, resulting in its interaction with a plethora of endo-vesicular proteins. Mechanistically, we report that pathogenic LRRK2 kinase activity delays the recycling of the transporter to the plasma membrane via Rabs inactivation, causing its intracellular re-localization and degradation. Taken together, our results demonstrate that pathogenic LRRK2 interferes with the physiology of EAAT2, pointing to extracellular glutamate overload as a possible contributor to neurodegeneration in PD.

Keywords: Astrocytes; EAAT2; Glia; Glt-1; LRRK2; Parkinson’s disease.


Conflict of interest statement

The authors have no conflicts of interest to declare.

Figures

Fig. 1
Fig. 1
EAAT2 levels are decreased in human LRRK2 G2019S brains. a Western blot analysis of human LRRK2 G2019S caudate and putamen lysates and healthy controls using anti-EAAT2, anti-GS, and anti-GFAP antibodies; bd relative quantification of band intensity was performed using ImageJ and normalized to the housekeeping protein GAPDH (n = 5 age-matched control samples and n = 4 LRRK2 G2019S caudate and putamen samples); e representative double-labeling images for EAAT2 (green) and GFAP (red) in LRRK2 G2019S human caudate and putamen and age-matched control; scale bar 50 μm, insets 20 μm; f representative images of DAB-immunostaining for GFAP in LRRK2 G2019S human caudate and putamen and age-matched control; scale bar 25 μm, insets 10 μm; arrowheads in (e and f) indicate the presence of GFAP-positive cells. Statistical analysis in (b) was performed using Mann–Whitney test and in (c, d) using unpaired T test
Fig. 2
Fig. 2
Glutamate transporter is downregulated in the striatum of LRRK2 G2019S mice. a Western blot analysis of LRRK2 WT and LRRK2 G2019S striatal lysates using anti-Glt-1, anti-GS, anti-GFAP, and anti-TH antibodies; be relative quantification of band intensity was performed using ImageJ and normalized to β-actin (n = 7 striatal samples for both LRRK2 WT and LRRK2 G2019S 4-month-old mice); f representative confocal double-labeling images for Glt-1 (green) and GFAP (red) in LRRK2 WT and G2019S striatal slices; scale bar 50 μm, insets 20 μm; g quantification of GFAP IntDen and GFAP+ cells (h) in the dorsal striatum of LRRK2 WT and G2019S mice. Three different fields per animal were collected, n = 3 animals for each genotype; i representative confocal images of the cellular distribution of the endogenous Glt-1 (green) in primary striatal astrocytes stained for GFAP (cyan) derived from LRRK2 WT and LRRK2 G2019S mice treated with dbcAMP (500 μM) for 10 days; scale bars 20 μm, inserts 5 μm; j striatal gliosomes from LRRK2 WT and LRRK2 G2019S 4-month-old mice were exposed for 2 min at 37 °C to increasing concentration of [3H]D-Asp (0.03, 0.1, 1, 3, 30, and 100 µM) in the presence of 10 μM UCPH to exclude [3H]D-Asp uptake by Glast. The specific [3H]D-Asp uptake is expressed as nmol/mg protein/2 min; the kinetic parameters Vmax and Km were obtained by fitting data with the Michaelis–Menten equation (n = 4 independent experiments for each group). Statistical analysis in (b, e, h, and j) was performed using unpaired T test; statistical analysis in g was performed using Mann–Whitney test
Fig. 3
Fig. 3
LRRK2 G2019S alters EAAT2 electrophysiological properties. a Schematic outline of the experimental setup. Oocytes were co-injected with mRNA of EAAT2 and human LRRK2 (WT or G2019S) and glutamate transport-associated currents were recorded using the two-electrode voltage-clamp technique; b the bar graph represents current amplitudes elicited in oocytes co-expressing EAAT2 and LRRK2 WT (n = 79 oocytes, 12 frogs) or G2019S (n = 122 oocytes, 12 frogs). Glutamate application was at 1 mM and the holding potential at − 60 mV; c transport-associated currents in oocytes co-expressing EAAT2 and LRRK2 WT or G2019S as a function of glutamate concentration. The kinetic parameters Imax and aKm were obtained by fitting data with the Michaelis–Menten equation (n = 6 oocytes; 2 frogs); d representative bright-field (left column) or fluorescence (middle column, merge on the right column) images of oocyte slices co-expressing EAAT2 (green) and LRRK2 WT or G2019S, with or without 90 min MLi-2 (200 nM) treatment; scale bar 20 μm. Representative traces of the recorded transport current in all the three groups are shown on the right; e quantitative analysis of the IntDen of the EAAT2 signal at the oocyte membrane was performed in three different fields for each oocyte; n = 3 oocytes for each group; f the bar graph represents current amplitudes elicited in oocytes co-expressing EAAT2 and LRRK2 WT (n = 18 oocytes, 6 frogs), G2019S (n = 22 oocytes, 6 frogs), or G2019S + MLi-2 (n = 22 oocytes, 6 frogs). Statistical analysis in b was performed using Mann–Whitney test, in e using one-way ANOVA test (F = 8.891, P = 0.001) followed by Tukey’s multiple comparison test. Statistical analysis in (f) was performed using unpaired T test to compare EAAT2 + LRRK2 WT to EAAT2 + G2019S-injected oocytes and with paired T test to compare EAAT2 + G2019S oocytes before and after LRRK2 inhibition
Fig. 4
Fig. 4
Astroglial Glt-1 is mislocalized in the presence of LRRK2 G2019S mutation. a Representative TIRFM images of Glt-1 localization in LRRK2 WT and LRRK2 G2019S astrocytes (untreated or treated with MLi-2) transfected with GFP-Glt1 (gray) and stained with GFAP (cyan). Scale bar 20 μm; insets 10 μm; b) quantification of the GFP-Glt-1 mean fluorescence performed in TIRFM images (n = 25 cells from LRRK2 WT, n = 16 cells from LRRK2 WT + MLi-2; n = 30 cells from LRRK2 GS and n = 31 cells from LRRK2 GS + MLi-2, experiments performed at least in triple); c schematic representation of TPA and Go 6976 effects on PKC activity; d representative epifluorescence images of Glt-1 intracellular clusters in LRRK2 WT and LRRK2 G2019S astrocytes transfected with Flag-Glt-1 (green) and stained with GFAP (cyan) under basal condition and after pharmacological treatment; Scale bar 20 μm, insets 5 μm; e quantification of the number of Glt-1-positive clusters per cell in LRRK2 WT and G2019S astrocytes under basal condition and after pharmacological treatment using LRRK2 inhibitor MLi-2 (90 min) and the PKC activator TPA (20 min). Number of cells analyzed: LRRK2 WT (n = 40 cells), LRRK2 WT + MLi-2 (n = 13 cells), LRRK2 G2019S (n = 31 cells), LRRK2 G2019S + MLi-2 (n = 26 cells), LRRK2 WT + TPA (n = 29 cells), and LRRK2 G2019S + TPA (n = 18 cells); f quantification of the number of Glt-1-positive clusters per cell under basal condition and after pharmacological co-treatment with TPA and Mli-2 in LRRK2 WT astrocytes. Number of cells analyzed: LRRK2 WT (n = 9 cells) and WT + TPA + MLI-2 (n = 15 cells); g quantification of the number of Glt-1-positive clusters per cell under basal condition and after pharmacological treatment with the PKC inhibitor Go 6976 in LRRK2 G2019S astrocytes. Number cells analyzed: LRRK2 GS (n = 11 cells) and LRRK2 GS + Go (n = 12 cells). Experiments performed at least in triple. Three cells were analyzed for each independent cell culture. Statistical analysis in (b and e) was performed using two-way ANOVA (b treatment F = 0.06 and p = 0.06; genotypes F = 53.01 and p < 0.0001; e treatment: F = 16.53 and p < 0.0001; genotypes F = 10.67 and p = 0.001) test followed by Tukey’s multiple comparisons test. ($ vs LRRK2 WT and * versus LRRK2 G2019S). Statistical analysis in (f and g) was performed using unpaired T test
Fig. 5
Fig. 5
LRRK2 G2019S enhances Glt-1 accumulation in Rab4-positive organelles. a Representative z-stack confocal images of primary astrocytes from LRRK2 WT and LRRK2 G2019S mice transfected with Flag-Glt-1 and GFP-Lamp1, GFP-Rab11, or GFP-Rab4 under basal conditions or upon treatment with MLi-2 inhibitor. Insets show Lamp1-, Rab11-, or Rab4-positive area and the localization of Glt-1 in the indicated ROIs. Scale bars: 20 μm; insets 5 μm; b, c quantitative analysis of Lamp1 IntDen (n = 14 cells for LRRK2 WT, n = 11 cells for LRRK2 GS and n = 7 cells for LRRK2 GS + MLi2, experiments performed at least in triple) and of the Pearson’s correlation coefficient of Glt-1 co-localizing with the Lamp1-positive compartment (n = 14 cells for LRRK2 WT, n = 12 cells for LRRK2 GS and n = 8 cells for LRRK2 GS + MLi2, experiments performed at least in triple); de quantitative analysis of Rab11 IntDen (n = 12 cells for LRRK2 WT, n = 10 cells for LRRK2 GS and n = 9 cells for LRRK2 GS + MLi2, experiments performed at least in triple) and of the Pearson’s correlation coefficient of Glt-1 co-localizing with the Rab11-positive compartment (n = 12 cells for LRRK2 WT, n = 12 cells for LRRK2 GS and n = 10 cells for LRRK2 GS + MLi2, experiments performed at least in triple); f, g Quantitative analysis of Rab4 IntDen (n = 11 cells for LRRK2 WT, n = 9 cells for LRRK2 GS and n = 9 cells for LRRK2 GS + MLi2, experiments performed at least in triple) and of the Pearson’s correlation coefficient of Glt-1 co-localizing with the Rab4-positive vesicles (n = 13 cells for LRRK2 WT, n = 13 cells for LRRK2 GS and n = 9 cells for LRRK2 GS + MLi2, experiments performed at least in triple). h Representative TEM images of LRRK2 WT and G2019S endosomal-like structures (yellow arrowheads) in primary striatal astrocytes transfected with GFP-Rab4 and Flag-Glt-1 (scale bars: 5 μm; insets: scale bars: 500 nm); i Quantification of the area of endosomal-like structures (n = 5 cells analyzed for each group, ten independent fields were analyzed for quantification). jl Representative z-stack confocal images of coronal organotypic LRRK2 WT, LRRK2 G2019S, and LRRK2 G2019S treated with MLi-2 slices transfected with the GFP-Rab4 plasmid and stained for the endogenous proteins Glt-1 (red) and GFAP (magenta). Insets show Rab4-positive area and the localization of Glt-1 in the indicated ROIs. Scale bars: 20 μm; insets 2 μm; Statistical analysis in b-g was performed using one-way ANOVA test (b) F = 3.77 and p = 0.04; c F = 0.36 and p = 0.69, d F = 0.53 and p = 0.59, e F = 2.77 and p = 0.08, f F = 1.76 and p = 0.19, and g F = 19.04 and p < 0.0001) followed by Tukey’s multiple comparison test. Statistical analysis in i was performed using unpaired t tests
Fig. 6
Fig. 6
LRRK2 G2019S mutation enhances Rab4-positive organelles dimension via Rab8A and Rab10 phosphorylation. a Western blot analysis of extracts from primary striatal astrocyte cultures from LRRK2 WT, LRRK2 G2019S mice with or without MLi-2 treatment, and blotted with the following antibodies: anti-pS1292 LRRK2, anti-pS935 LRRK2, anti-total LRRK2, anti-p73T Rab10, anti-total Rab10, anti-p72T Rab8A, and anti-total Rab8A antibodies; b, d Representative z-stack confocal images of primary astrocytes from LRRK2 WT and LRRK2 G2019S mice transfected with GFP-Rab4 and Rab8A WT/QL or Rab10 WT/QL. Insets show the area of the Rab4-positive structures. Scale bars: 20 μm; insets 1 μm; c, e Quantification of Rab4-positive vesicle area in primary astrocytes from LRRK2 WT and LRRK2 G2019S mice transfected with GFP-Rab4 and Rab8A WT/QL or Rab10 WT/QL; at least n = 6 cells have been analyzed for each experimental group and the experiments have been performed in triple. Statistical analysis in c was performed using the one-way ANOVA test (F = 17.58 and p < 0.0001) followed by Tukey’s multiple comparisons test; Statistical analysis in e was performed using Kruskal–Wallis test (p = 0.0006) followed by Dunn’s multiple comparisons test
Fig. 7
Fig. 7
G2019S pathogenic LRRK2 mutation impacts on Glt-1 recycling and turnover. a Representative confocal images of primary striatal LRRK2 WT and G2019S astrocytes under basal conditions and treated with the recycling blocker Monensin (35 µM, 40 min). Insets show the Rab4-positive area and the localization of Glt-1 in the indicated ROIs. Scale bars: 20 μm; insets 5 μm; b quantitative analysis of the Pearson’s correlation coefficient of Glt-1 co-localizing with the Rab4-positive compartment; n = 8 cells for LRRK2 WT, n = 13 cells for LRRK2 WT + Monensin, n = 9 cells for LRRK2 G2019S and n = 12 cells for LRRK2 G2019S + Monensin, experiments performed at least in triple; c Representative z-stack confocal images of primary LRRK2 WT and G2019S (with or without MLi-2) striatal astrocytes transfected with Flag-Glt-1 (red) and GFP-Rab4 (green). The insets show Rab4-positive area and the localization of Glt-1 in these ROIs; scale bar 20 μm; insets 5 μm; d quantitative analysis of the Pearson’s correlation coefficient of Glt-1 co-localizing with the Rab4-positive compartment in the four selected experimental time points. At least n = 6 cells have been analyzed for each experimental group and the experiments have been performed in triple; e representative z-stack confocal images of primary striatal LRRK2 G2019S astrocytes transfected with GFP-Rab4 and Flag-Glt-1 (red) and labeled for endogenous Lamp1 (far red, pseudocolored in blue). Insets show Rab4- and Lamp1-positive area and the localization of Glt-1 in these ROIs. Scale bar 20 μm; insets 5 μm; f Quantitative analysis of the Pearson’s correlation coefficient of Glt-1 co-localizing with the Rab4-positive vesicles in LRRK2 G2019S astrocytes under basal conditions (n = 15 cells) or upon MG132 (n = 15 cells) or Bafilomycin application (n = 13 cells); g quantitative analysis of the Pearson’s Correlation Coefficient of Glt-1 co-localizing with the Lamp1-positive structures in LRRK2 G2019S astrocytes under basal conditions (n = 15 cells) or upon MG132 (n = 15 cells) or Bafilomycin (n = 13 cells) application; experiments performed at least in triple; h Quantitative analysis of Glt-1 IntDen in LRRK2 G2019S astrocytes, under basal condition or after application of MG132 or Bafilomycin A1 (n = 15 cells for untreated LRRK2 GS, n = 16 cells for LRRK2 GS + MG132 and n = 13 LRRK2 GS + Bafilomycin; experiments performed at least in triple); i schematic representation of Glt-1 trafficking in LRRK2 WT and LRRK2 G2019S astrocytes. Statistical analysis in b was performed using two-way ANOVA test (treatment: F = 12.86 and p = 0.0009; Genotypes F = 4.672 and p = 0.03) followed by Tukey’s multiple comparisons test; statistical analysis in d was performed using two-way ANOVA test (treatment: F = 16.17 and p < 0.0001; group: F = 13.87 and p < 0.0001) followed by Tukey’s multiple comparison test; statistical analysis in (fh) was performed using one-way ANOVA test (f F = 6.68 and p = 0.003); g F = 12.07 and p < 0.0001; h F = 5.79 and p = 0.006) followed by Tukey’s multiple comparisons test (*LRRK2 WT vs LRRK2 G2019S, #LRRK2 G2019S vs LRRK2 G2019S + MLi-2)

References

    1. Armstrong MJ, Okun MS. Diagnosis and treatment of Parkinson disease: a review. JAMA. 2020;323:548–560. doi: 10.1001/JAMA.2019.22360. - DOI - PubMed
    1. Al Awabdh S, Gupta-Agarwal S, Sheehan DF, Muir J, Norkett R, Twelvetrees AE, Griffin LD, Kittler JT. Neuronal activity mediated regulation of glutamate transporter GLT-1 surface diffusion in rat astrocytes in dissociated and slice cultures. Glia. 2016;64:1252. doi: 10.1002/GLIA.22997. - DOI - PMC - PubMed
    1. Bedford C, Sears C, Perez-Carrion M, Piccoli G, Condliffe SB. LRRK2 regulates voltage-gated calcium channel function. Front Mol Neurosci. 2016 doi: 10.3389/FNMOL.2016.00035. - DOI - PMC - PubMed
    1. Booth HDE, Hirst WD, Wade-Martins R. The role of astrocyte dysfunction in parkinson’s disease pathogenesis. Trends Neurosci. 2017;40:358–370. doi: 10.1016/J.TINS.2017.04.001. - DOI - PMC - PubMed
    1. Bossi E, Fabbrini MS, Ceriotti A. Exogenous protein expression in Xenopus oocytes: basic procedures. Methods Mol Biol. 2007;375:107–131. doi: 10.1007/978-1-59745-388-2_6. - DOI - PubMed

Publication types

MeSH terms

Substances