. 2022 Jun:80:104056.
doi: 10.1016/j.ebiom.2022.104056. Epub 2022 May 18.

Polyploid giant cancer cells, EZH2 and Myc upregulation in mammary epithelial cells infected with high-risk human cytomegalovirus

Affiliations

Polyploid giant cancer cells, EZH2 and Myc upregulation in mammary epithelial cells infected with high-risk human cytomegalovirus

Zeina Nehme et al. EBioMedicine. 2022 Jun.

Abstract

Background: Human cytomegalovirus (HCMV) infection has been actively implicated in complex neoplastic processes. Beyond oncomodulation, the molecular mechanisms that might underlie HCMV-induced oncogenesis are being extensively studied. Polycomb repressive complex 2 (PRC2) proteins, in particular enhancer of zeste homolog 2 (EZH2) are associated with cancer progression. Nevertheless, little is known about EZH2 activation in the context of HCMV infection and breast oncogenesis.

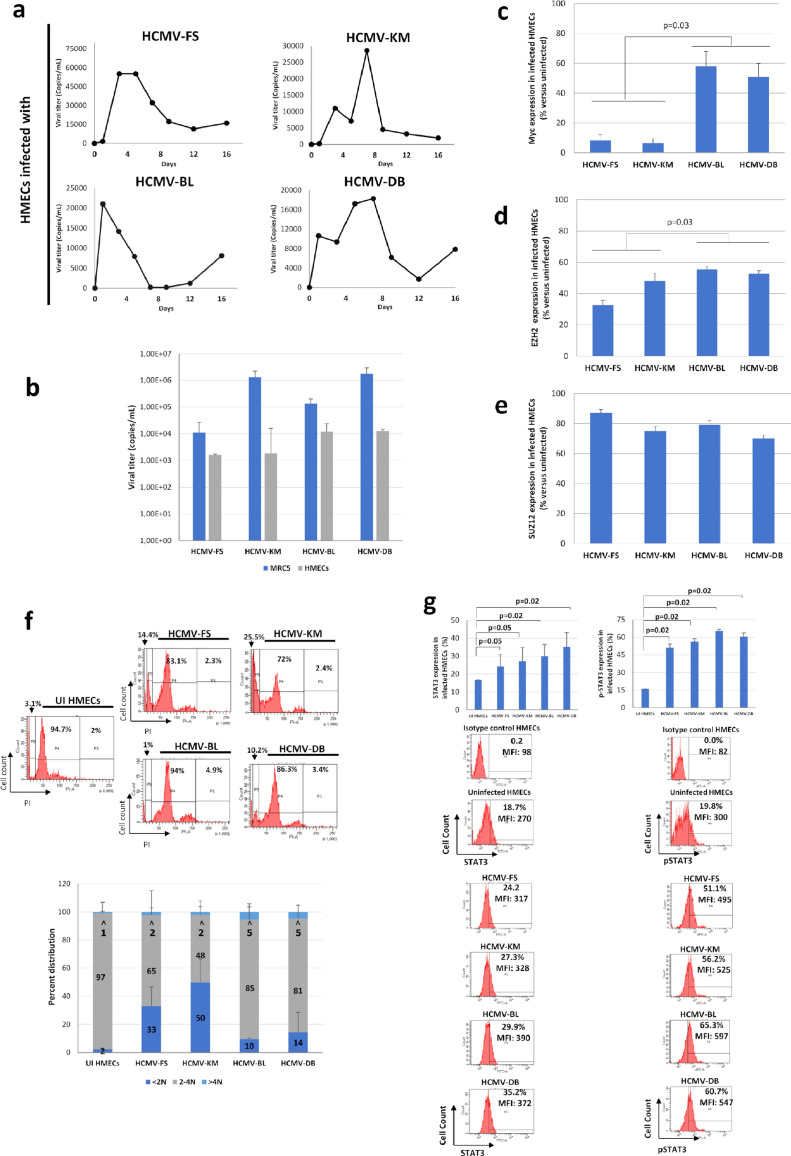
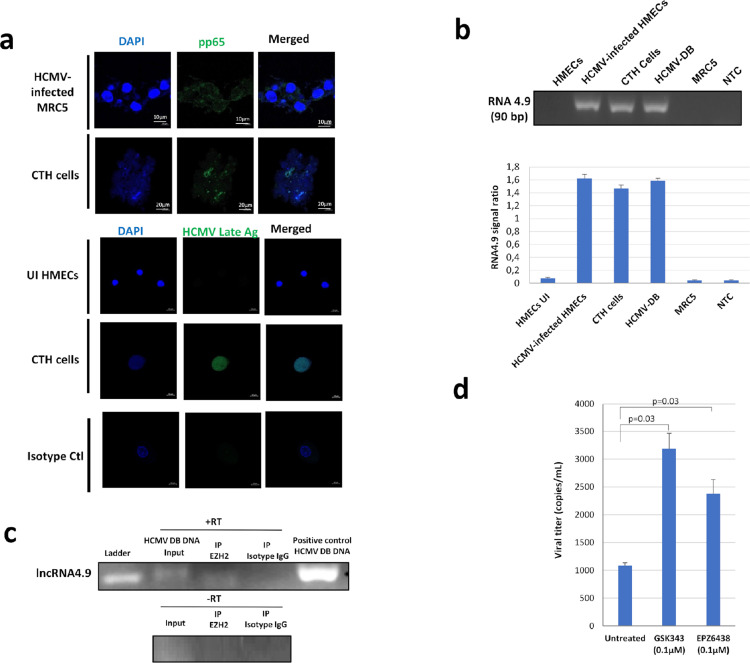
Methods: Herein, we identified EZH2 as a downstream target for HCMV-induced Myc upregulation upon acute and chronic infection with high-risk strains using a human mammary epithelial model.

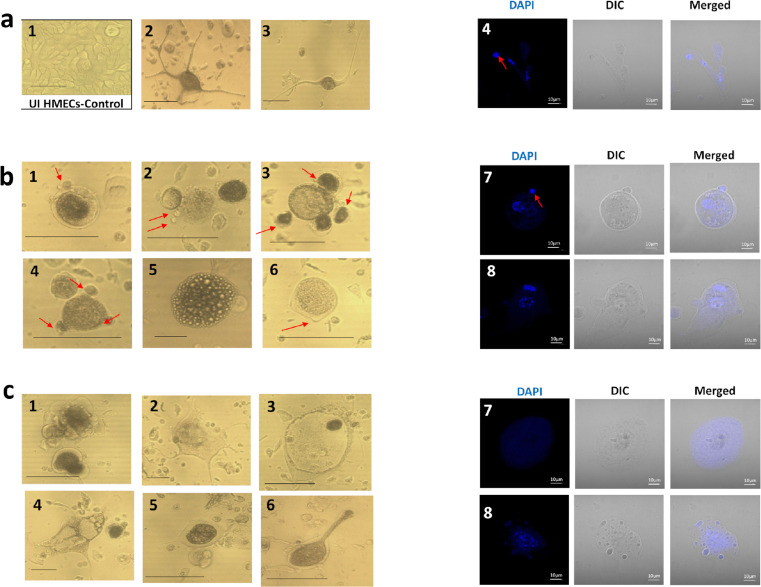
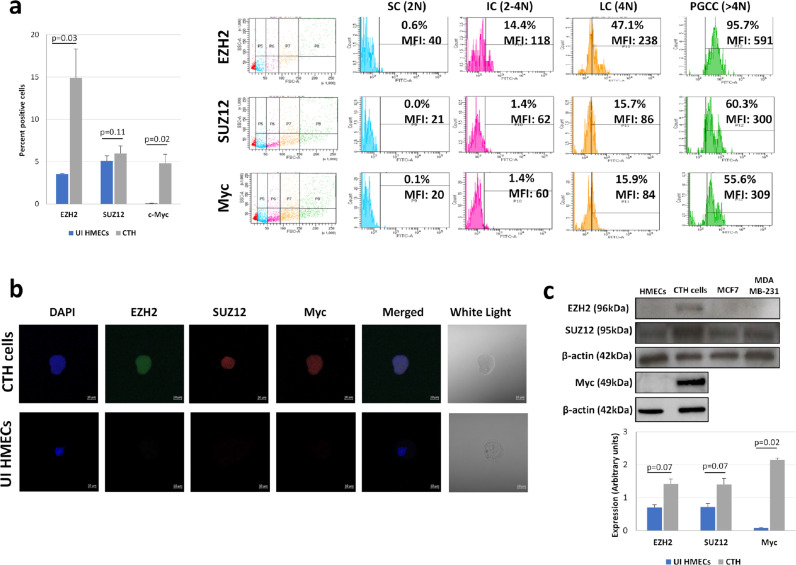
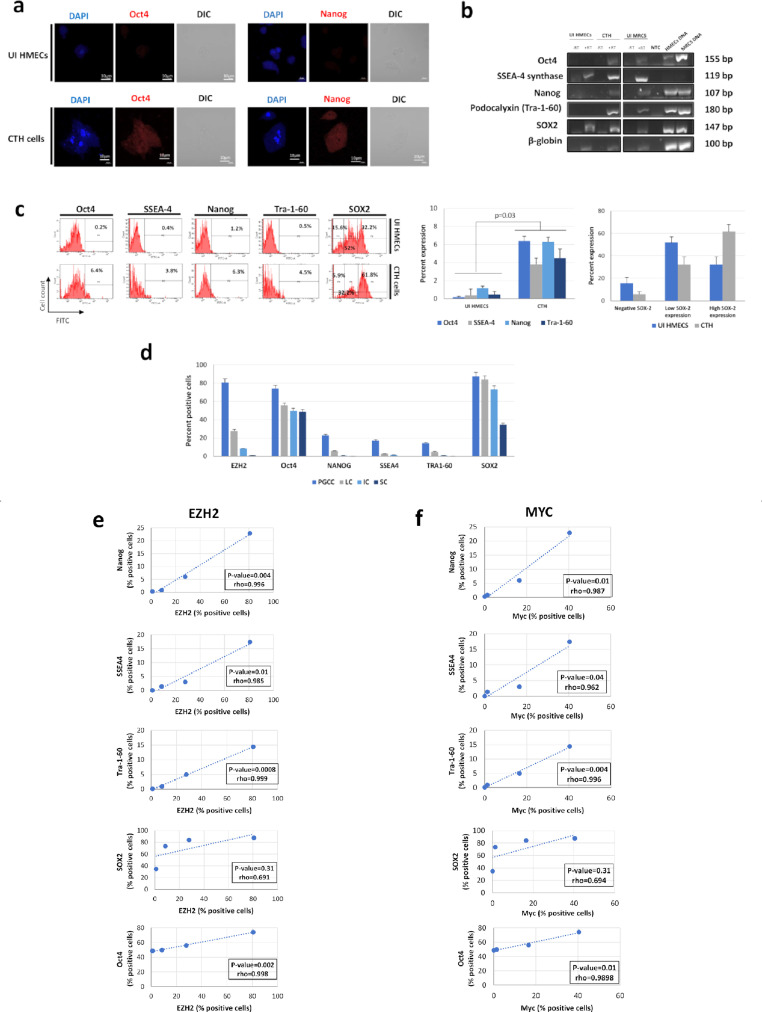
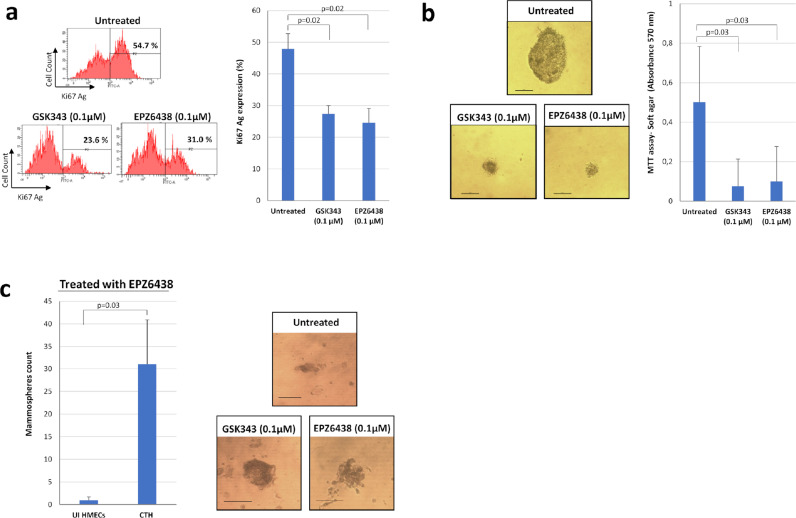
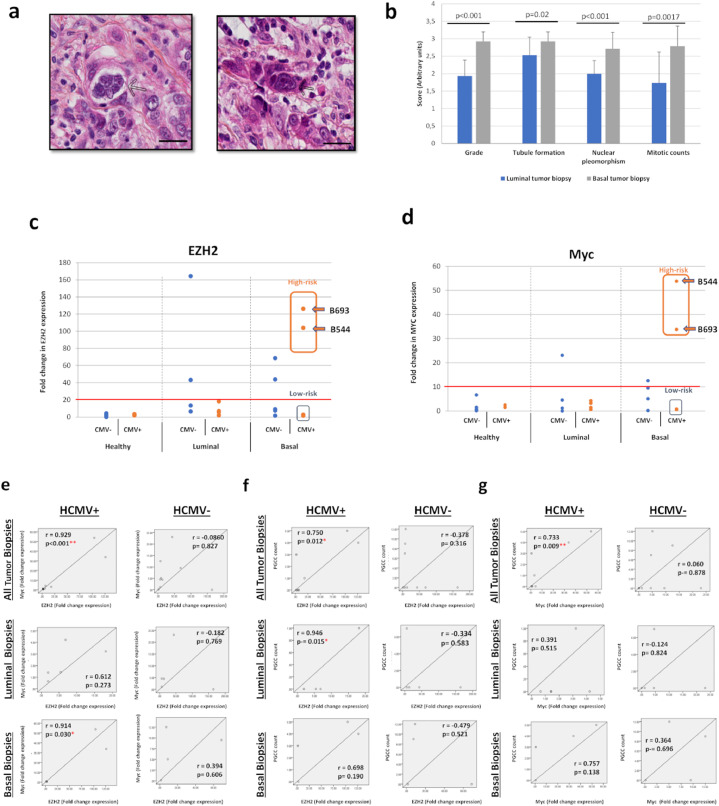
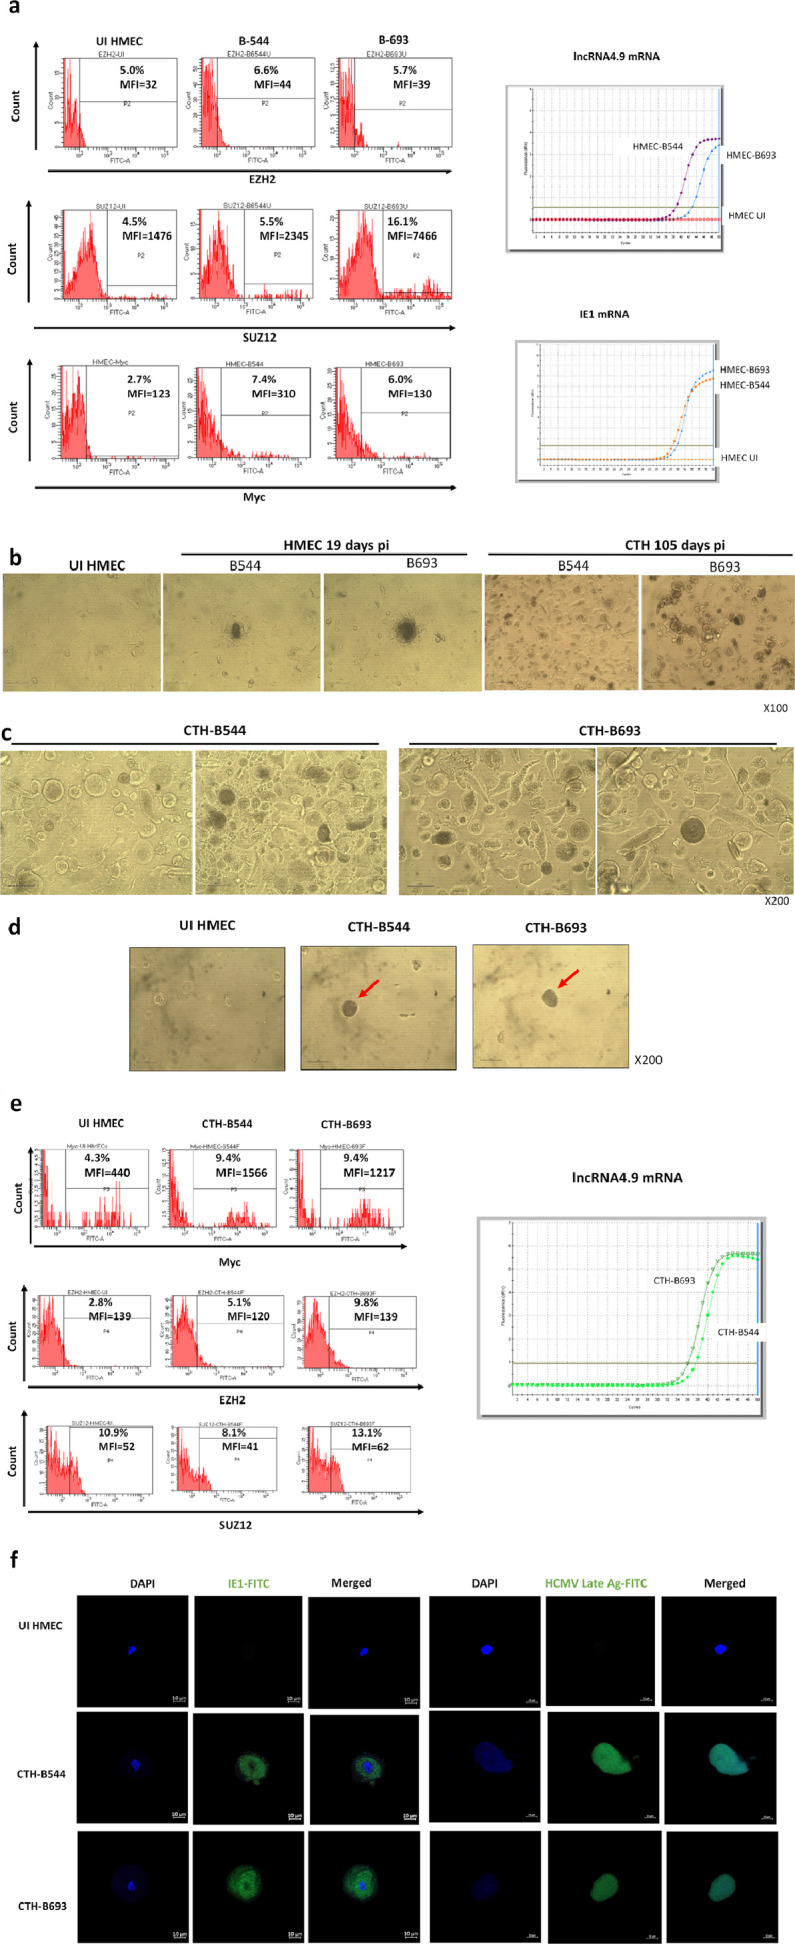
Findings: We detected polyploidy and CMV-transformed HMECs (CTH) cells harboring HCMV and dynamically undergoing the giant cells cycle. Acquisition of embryonic stemness markers positively correlated with EZH2 and Myc expression. EZH2 inhibitors curtail sustained CTH cells' malignant phenotype. Besides harboring polyploid giant cancer cells (PGCCs), tumorigenic breast biopsies were characterized by an enhanced EZH2 and Myc expression, with a strong positive correlation between EZH2 and Myc expression, and between PGCC count and EZH2/Myc expression in the presence of HCMV. Further, we isolated two HCMV strains from EZH2HighMycHigh basal-like tumors which replicate in MRC5 cells and transform HMECs toward CTH cells after acute infection.

Interpretation: Our data establish a potential link between HCMV-induced Myc activation, the subsequent EZH2 upregulation, and polyploidy induction. These data support the proposed tumorigenesis properties of EZH2/Myc, and allow the isolation of two oncogenic HCMV strains from EZH2HighMycHigh basal breast tumors while identifying EZH2 as a potential therapeutic target in the management of breast cancer, particularly upon HCMV infection.

Funding: This work was supported by grants from the University of Franche-Comté (UFC) (CR3300), the Région Franche-Comté (2021-Y-08292 and 2021-Y-08290) and the Ligue contre le Cancer (CR3304) to Georges Herbein. Zeina Nehme is a recipient of a doctoral scholarship from the municipality of Habbouch. Sandy Haidar Ahmad is recipient of a doctoral scholarship from Lebanese municipality. Ranim El Baba is a recipient of a doctoral scholarship from Hariri foundation for sustainable human development.

Keywords: Breast cancer; CTH cells; Cytomegalovirus; EZH2; Myc; Polyploid giant cancer cells.


Conflict of interest statement

The authors declare no conflict of interest.

Figures

Fig 1
Figure 1
Replication of HCMV clinical strains in HMECs with activation of oncogenic pathways and increased polyploidy. a. Time-course of the viral titer in supernatant of HMECs infected with the strains HCMV-FS, HCMV-KM, HCMV-BL and HCMV-DB, as measured by IE1 qPCR. b. Comparison of peak viral titer in supernatant of HMECs and MRC5 cells infected with the strains HCMV-FS, HCMV-KM, HCMV-BL and HCMV-DB, as measured by IE1 qPCR. c, d, e. Comparison of the expression of (c) Myc, (d) EZH2 and (e) SUZ12, in HMECs infected with the strains HCMV-FS, HCMV-KM, HCMV-BL and HCMV-DB. Histograms represent mean values ± SD of 3 independent experiments. f. Cell population repartition based on DNA content, as marked by PI staining of HMECs infected with the strains HCMV-FS, HCMV-KM, HCMV-BL and HCMV-DB. Cells are classified between <2N, 2-4N and >4N populations. Histograms represent the mean ±SD of 3 independent experiments. g. STAT3 and pSTAT3 expression in HMECs infected with HCMV-FS, HCMV-KM, HCMV-BL, and HCMV-DB strains, as measured by FACS. Histograms represent mean ±SD of 3 independent experiments. p-values were determined by Mann-Whitney U test.
Fig 2
Figure 2
Appearance of CTH and polyploid giant cancer cells following infection of HMECs with HCMV-DB and HCMV-BL strains. a. Presence of neuron-like elongated cells, displaying multiple nuclei, as observed under an inverted light microscope (1-3) and a fluorescence confocal microscope (4) using DAPI staining. Uninfected HMECs (1), CTH-DB (3 and 4) and CTH-BL (2). b. Presence of dense bodied cells, showing morula-like or blastomere-like structures, as observed under an inverted light microscope (1-6) and a fluorescence confocal microscope (7-8) using DAPI staining. CTH-DB (3, 5, 6, 7) and CTH-BL (1, 2, 4, 8). c. Presence of giant cells, showing granular appearance and blastocyst-like shapes and displaying intense polyploidy, as observed under an inverted light microscope (1-6) and a fluorescence confocal microscope (7-8) using DAPI staining. CTH-DB (1, 5) and CTH-BL (2, 3, 4, 6, 7, 8). Inverted light microscope scale bar represents 100µm; Confocal microscope scale bar represents 10µm.
Fig 3
Figure 3
Myc, EZH2 and SUZ12 activation in CTH cells. a. Myc, EZH2, and SUZ12 expression in CTH cells and subpopulations, as measured by FACS. Histogram represents the mean ±SD of 3 independent experiments. PGCCs: polyploid giant cancer cells; LC: large cells; IC: intermediate cell; SC: small cells. b. Myc, EZH2 and SUZ12 expression in CTH cells as observed by fluorescence confocal microscope. Scale bar represents 10µm. c. Myc, EZH2, and SUZ12 expression in CTH cells as measured by western blot. Protein expression was measured by densitometry using ImageJ software; histogram represents the mean ±SD of 3 independent experiments. p-values were determined by Mann-Whitney U test.
Fig 4
Figure 4
Increased expression of embryonic markers in CTH cells compared to HMECs. a. Oct4 and Nanog expression in CTH cells and HMECs, observed by fluorescence confocal microscopy. b. Expression of Oct4, SSEA-4 synthase, Nanog, Tra-1-60 and SOX2 at mRNA levels in CTH cells and HMECs. Cellular DNA was used as positive control. Beta-globin was used as housekeeping control gene. RT: reverse transcriptase; NTC: non-treated control. c. Embryonic markers expression in CTH cells and HMECs, as measured by FACS. Histograms represent mean values ±SD of 3 independent experiments. p-values were determined by Mann-Whitney U test. d. EZH2 and embryonic markers expression for CTH cells subpopulations. Histograms represent mean ±SD of 3 independent experiments. PGCCs: polyploid giant cancer cells; LC: large cells; IC: intermediate cell; SC: small cells. e, f. Correlation between (e) EZH2 and (f) Myc expression and embryonic markers expression in subpopulations of CTH cells. p-values were determined by Spearman's correlation test.
Fig 5
Figure 5
Presence of HCMV in CTH cells and enhanced viral replication upon EZH2 inhibition. a. HCMV pp65 protein and HCMV late Ag expression in CTH-DB cells, observed in fluorescence confocal microscopy. HCMV-infected cells were used as positive control. DAPI was used for nuclear staining. b. RNA4.9 gene presence in CTH-DB cells, as detected by conventional PCR. HCMV-infected HMECs and HCMV-DB genomic DNA were used as positive controls; MRC5 genomic DNA was used as negative control. Histogram represents the ratio of RNA4.9 signal to beta-globin signal as mean ±SD of 3 independent experiments. c. RNA-Immunoprecipitation of lncRNA4.9 using EZH2 antibody. d. Viral titer in supernatant of CTH-DB cells untreated or treated with EZH2 inhibitors GSK343 and EPZ6438, as quantified by IE1 qPCR. Histogram represents mean ±SD of 3 independent experiments. p-values were determined by Mann-Whitney U test.
Fig 6
Figure 6
EZH2 inhibitors block CTH cell proliferation, colony formation in soft agar and enhance mammosphere formation. a. Ki-67 Ag expression in CTH untreated and treated with EZH2 inhibitors (GSK343 and EPZ6438), as measured by FACS. Histogram represents mean ±SD of 3 independent experiments. b. Soft-agar assay on CTH cells untreated and treated with EZH2 inhibitors (GSK343 and EPZ6438). Colony formation was assessed by inverted light microscope observation and quantified by MTT assay. Scale bar represents 100µm. Histogram represents mean ±SD of 3 independent experiments. c. Mammosphere formation assay on CTH cells untreated and treated with EZH2 inhibitors (GSK343 and EPZ6438). Mammospheres were observed under an inverted light microscope. Scale bar represents 100µm. p-values were determined by Mann-Whitney U test.
Fig 7
Figure 7
Detection of PGCCs in breast cancer biopsies and EZH2/Myc expression in healthy, tumor, luminal and basal biopsies. a. Presence of PGCCs in breast tumor biopsies (arrows). Tissue was stained using HES. Magnification: 80X. Scale bars are 25 µm. b. Comparison of histological characteristics of luminal and basal tumor biopsies. p-values were determined by Mann-Whitney U test. c, d. Scattered plots showing (c) EZH2 and (d) Myc expression in individual healthy, luminal, and basal HCMV-positive and negative biopsies. The cut-off for classifying high- and low-risk strains is represented by the horizontal red line. p-values were determined by Mann-Whitney U test. e, f, g. Correlation between the expression EZH2, Myc, and PGCC count in tumor biopsies in the presence or absence of HCMV. Correlation test between (e) EZH2 and Myc expression, (f) EZH2 expression and PGCC count, (g) Myc expression and PGCC count in all tumor, luminal and basal biopsies in the presence or absence of HCMV. *p-value≤0.05; ** p-value ≤0.01; p-values were determined by Pearson's correlation test.
Fig 8
Figure 8
The acute transformation of HMECs infected with two HCMV strains which were isolated from EZH2HighMycHigh basal breast tumors toward CTH cells. a. Left Panel. Upregulation of EZH2, SUZ12 and Myc expression in HMECs infected with HCMV-B544 and HCMV-B693 strains at day 1 post infection versus uninfected controls, as measured by FACS. Right Panel. Detection of lncRNA4.9 and IE1 transcripts in HMECs infected with HCMV-B544 and HCMV-B693 strains at day 1 post infection, as measured by RT-qPCR. b. Time-course of appearance of CTH cells in HMEC cultures acutely infected with B544 and B693 HCMV strains. c. PGCCs structures obtained in CTH cells following the acute infection of HMECs with the two HCMV strains B544 and B693. d. Colony formation in soft agar seeded with HMECs infected with HCMV-B544 and HCMV-B693 strains. After 14 days in soft agar (day 15 post infection), colonies were observed under an Olympus microscope (magnification 200×). Results are representative of three independent experiments. e. Left Panel. Expression of Myc, EZH2 and SUZ12 in CTH-B693 and CTH-B544 cells, as measured by FACS. Right Panel. Detection of the lncRNA4.9 transcript in CTH-B544 and CTH-693 cells, as measured by RT-qPCR. f. HCMV IE1 protein and HCMV late Ag expression in CTH-B544 and CTH-B693 cells observed by fluorescence confocal microscopy. DAPI was used for nuclear staining.

Similar articles

Cited by

References

    1. Schottstedt V., Blümel J., Burger R., et al. Human cytomegalovirus (HCMV) – revised*. Transfus Med Hemother. 2010;37:365–375. doi: 10.1159/000322141. - DOI - PMC - PubMed
    1. Hanahan D., Weinberg R.A. Hallmarks of cancer: the next generation. Cell. 2011;144:646–674. doi: 10.1016/j.cell.2011.02.013. - DOI - PubMed
    1. Herbein G. The human cytomegalovirus, from oncomodulation to oncogenesis. Viruses. 2018;10:408. doi: 10.3390/v10080408. - DOI - PMC - PubMed
    1. Michaelis M., Doerr H.W., Cinatl J. The story of human cytomegalovirus and cancer: increasing evidence and open questions. Neoplasia. 2009;11:1–9. doi: 10.1593/neo.81178. - DOI - PMC - PubMed
    1. Taher C., de Boniface J., Mohammad A.A., et al. High prevalence of human cytomegalovirus proteins and nucleic acids in primary breast cancer and metastatic sentinel lymph nodes. PLoS ONE. 2013;8:e56795. doi: 10.1371/journal.pone.0056795. - DOI - PMC - PubMed

MeSH terms

Substances