. 2022:35:103044.
doi: 10.1016/j.nicl.2022.103044. Epub 2022 May 12.

Semantic segmentation guided detector for segmentation, classification, and lesion mapping of acute ischemic stroke in MRI images

Affiliations

Semantic segmentation guided detector for segmentation, classification, and lesion mapping of acute ischemic stroke in MRI images

Yi-Chia Wei et al. Neuroimage Clin. 2022.

Abstract

Background and purpose: MRI images timely and accurately reflect ischemic injuries to the brain tissues and, therefore, can support clinical decision-making of acute ischemic stroke (AIS). To maximize the information provided by the MRI images, we leverage deep learning models to segment, classify, and map lesion distributions of AIS.

Methods: We evaluated brain MRI images of AIS patients from 2017 to 2020 at a tertiary teaching hospital and developed the Semantic Segmentation Guided Detector Network (SGD-Net), composed of the first U-shaped model for segmentation in diffusion-weighted imaging (DWI) and the second model for binary classification of lesion size (lacune vs. non-lacune) and circulatory territory of lesion location (anterior vs. posterior circulation). Next, we modified the two-stage deep learning model into SGD-Net Plus by automatically segmenting AIS lesions in DWI images and registering the lesion in T1-weighted images and the brain atlases.

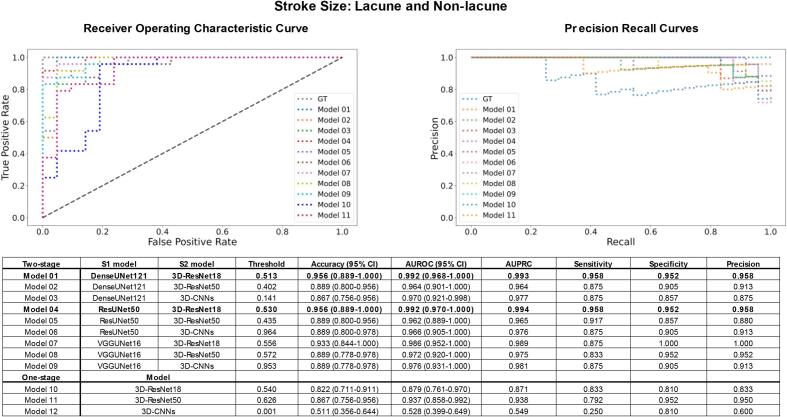
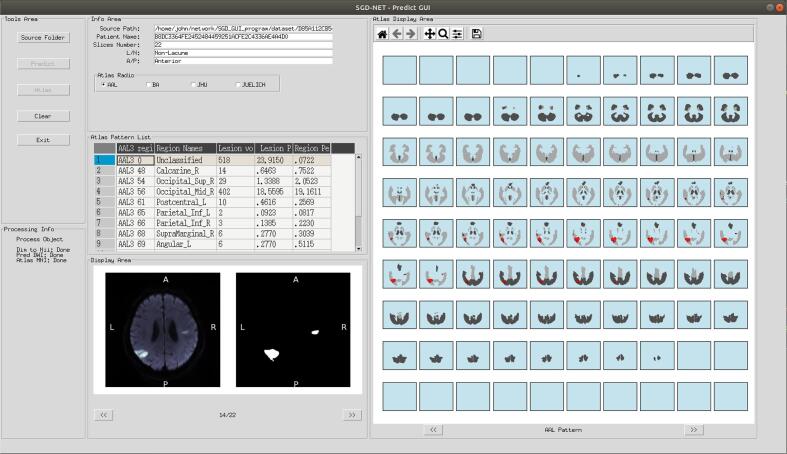
Results: The final enrollment (216 patients with 4606 slices) was divided into 80% for model development and 20% for testing. S1 model segmented AIS lesions in DWI images accurately with a pixel accuracy > 99% (Dice 0.806-0.828 and IoU 0.675-707). In comprehensive evaluation of classification performance, the two-stage SGD-Net outperformed the traditional one-stage models in classifying AIS lesion size (accuracy 0.867-0.956 vs. 0.511-0.867, AUROC 0.962-0.992 vs. 0.528-0.937, AUPRC 0.964-0.994 vs. 0.549-0.938) and location (accuracy 0.860-0.930 vs. 0.326-0.721, AUROC 0.936-0.988 vs. 0.493-0.833, AUPRC 0.883-0.978 vs. 0.365-0.695). The precise lesion segmentation at the first stage of the deep learning model was the basis for further application. After that, the modified two-stage model SGD-Net Plus accurately reported the volume, region percentage, and lesion percentage of each region on the selected brain atlas. Its reports provided clear descriptions and quantifications of the AIS-related brain injuries on white matter tracts, Brodmann areas, and cytoarchitectonic areas.

Conclusion: Domain knowledge-oriented design of artificial intelligence applications can deepen our understanding of patients' conditions and strengthen the use of MRI for patient care. SGD-Net precisely segments AIS lesions on DWI and accurately classifies the lesions. In addition, SGD-Net Plus maps the AIS lesions and quantifies their occupancy in each brain region. They are practical tools to meet the clinical needs and enrich educational resources of neuroimage.

Keywords: Acute ischemic stroke; Diffusion-weighted imaging; Joint segmentation and classification; Lesion distribution and mapping; SGD-net; SGD-net plus.


Conflict of interest statement

The authors declare that they have no known competing financial interests or personal relationships that could have appeared to influence the work reported in this paper.

Figures

None
Graphical abstract
Fig. 1
Fig. 1
The architecture of SGD-Net. The S1 architecture of the SGD-Net is a modification of U-Net from VGG, DenseNet, and ResNet to form VGGUNet, Dense-UNet, and Res-UNet. The DWI inputs passed through a hierarchical contraction path and a corresponding extraction path. The illustration describes the combination of DenseUNet121 in S1 and 3D-ResNet18 in S2. Along the paths, the convolution blocks are connected to the pooling of dense blocks. Every convolutional block contains convolution layers, a rectified linear unit (ReLu), and a batch normalizer as the basic unit. The hierarchical concatenation between contraction and extraction pathways is pooled into the output layer, and the images are exported in the same size as the input images. Finally, the extracted stroke area images are input to the fully connected (FC) convolutional neural networks S2 to classify AIS lesion size and location.
Fig. 2
Fig. 2
Design of SGD-Net Plus. SGD-Net Plus connected the S1 of SGD-Net and serial multimodal imaging processes. The AIS lesion SegMap was projected back to the DWI images and co-registered with T1W images and brain atlases on standard space of the Montreal Neurological Institute (MNI). The model calculated the percentage of each brain region affected by the AIS lesions and the percentage of AIS lesion volume in each brain region. The brain atlases used in SGD-Net Plus were Brodmann Area (BA) for functional cortical segmentation, Johns Hopkins University (JHU) white matter atlas for white matter tract distribution, Anatomical Automated Anatomical Labeling 3 (AAL3), and Julich Brain Cytoarchitectonic Atlas for anatomical brain segmentation.
Fig. 3
Fig. 3
Data enrollment. Datasets were created by retrospective enrollment of patients diagnosed with AIS from 2017 to 2020. The AIS patients with brain MRI images for AIS were screened for eligibility. The final enrollment was divided chronologically into the development dataset (80%) and the test dataset (20%). The development dataset was further separated for training (80%) and validation (20%). For the classifier of the vascular territory, the image sets containing lesions in both anterior and posterior circulatory territories were excluded (5.7%, 3.2%, and 4.4% in training, validation, and testing data).
Fig. 4
Fig. 4
Demonstrations of SGD-Net S1 for segmentation of AIS lesions in DWI images. The four samples demonstrated the four classes of different combinations of lesion size and location. The demonstration was yielded by the SGD-Net S1 model with DenseUNet121 backbone. Ground truth was labeled by the image review board. The SegMap was the prediction by the SGD-Net S1 model. Abbreviations: GT, ground truth. SegMap: predicted segmentation map of AIS lesion.
Fig. 5
Fig. 5
Model performance for classification of lacune and non-lacune stroke. Model performance was evaluated by accuracy, AUROC, and AUPRC. Two-stage models generally outperformed traditional one-stage models for classifying AIS lesion size as lacune and non-lacune (diameter ≤ and > 20 mm). The bold labeled the best-performed models. Model 1 (S1 DenseUNet121 + S2 3D-ResNet18) and Model 4 (S1 ResUNet50 + S2 3D-ResNet18) were the best performer. In contrast, Model 12 (one-stage 3D-CNNs) fell behind other models in classifying lesion size, and its curve was not shown in the subgraph.
Fig. 6
Fig. 6
Model performance for classification of the anterior and posterior circulation. The two-stage models outperformed the one-stage models in classifying AIS lesion location in anterior or posterior circulatory territories. In addition, Model 6 (S1 ResUNet50 + S2 3D-CNNs) outperformed other models, as marked in bold. Model 12 (one-stage 3D-CNNs) performed inferior to other models in classifying circulatory territory (curve not shown in the subgraph).
Fig. 7
Fig. 7
Reports of SGD-Net Plus for AIS lesion distribution. The example of the SGD-Net Plus report was a patient with acute right anterior cerebral artery territory infarction. The predicated SegMap (red) overlapped the AIS lesion on DWI images and registered on T1 MPRAGE images. The SGD-Net Plus yielded the distributions of AIS lesions on each brain atlas. The figure only showed a few lines of the report of each atlas. (For interpretation of the references to colour in this figure legend, the reader is referred to the web version of this article.)
Fig. 8
Fig. 8
SGD-Net and SGD-Net Plus for AIS lesion report. The user interface provided the results of SGD-Net classification for AIS lesion size (lacune and non-lacune) and lesion location (anterior and posterior circulatory territory) and the results of SGD-Net Plus for AIS lesion volume in each brain region, lesion percentage in that brain region, and region percentage occupied by the lesion. It also visualized the original DWI images, S1 segmentation, and serial cuts for the atlas with red-marked AIS lesions. (For interpretation of the references to colour in this figure legend, the reader is referred to the web version of this article.)

References

    1. Abraham, N., Khan, N.M., 2019. A novel focal tversky loss function with improved attention u-net for lesion segmentation. 2019 IEEE 16th International Symposium on Biomedical Imaging (ISBI 2019). IEEE, pp. 683–687.
    1. Adam, A., Dixon, A.K., Gillard, J.H., Schaefer-Prokop, C., 2020. Grainger & Allison's Diagnostic Radiology, 2 Volume Set E-Book. Elsevier Health Sciences.
    1. Akkus Z., Galimzianova A., Hoogi A., Rubin D.L., Erickson B.J. Deep learning for brain MRI segmentation: state of the art and future directions. J. Digit. Imaging. 2017;30(4):449–459. - PMC - PubMed
    1. Albers, G.W., 1998. Diffusion-weighted MRI for evaluation of acute stroke. Neurology 51, S47-49. - PubMed
    1. Amunts K., Mohlberg H., Bludau S., Zilles K. Julich-Brain: A 3D probabilistic atlas of the human brain's cytoarchitecture. Science. 2020;369(6506):988–992. - PubMed

Publication types

MeSH terms