. 2022 Aug 4;30(8):1157-1168.e3.
doi: 10.1016/j.str.2022.04.013. Epub 2022 May 20.

Modeling of protein conformational changes with Rosetta guided by limited experimental data

Affiliations

Modeling of protein conformational changes with Rosetta guided by limited experimental data

Davide Sala et al. Structure. .

Abstract

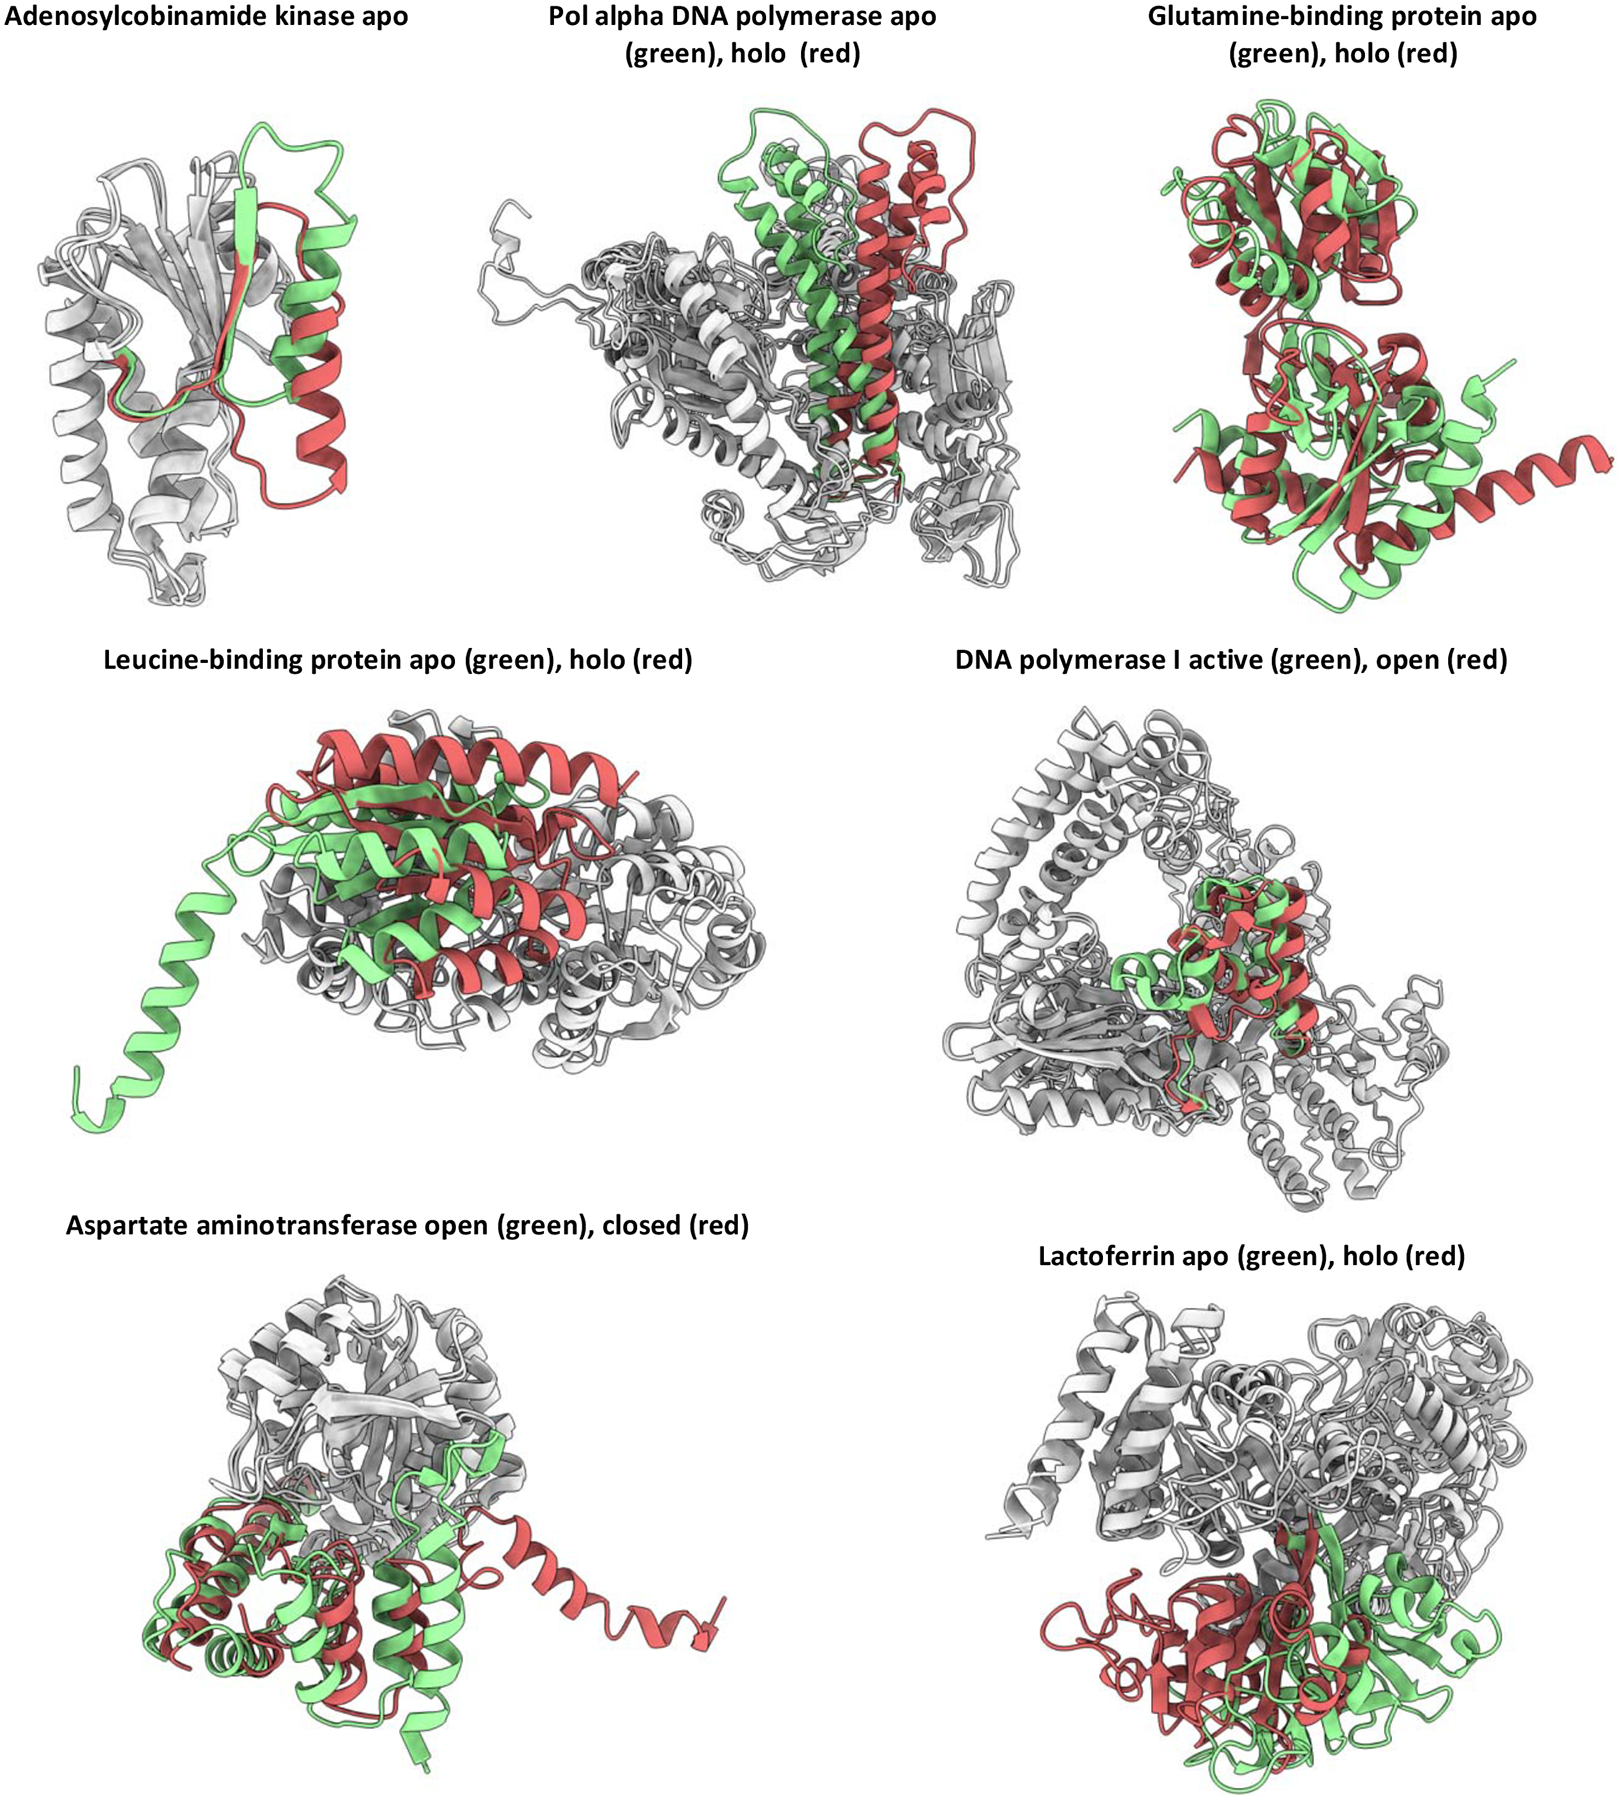
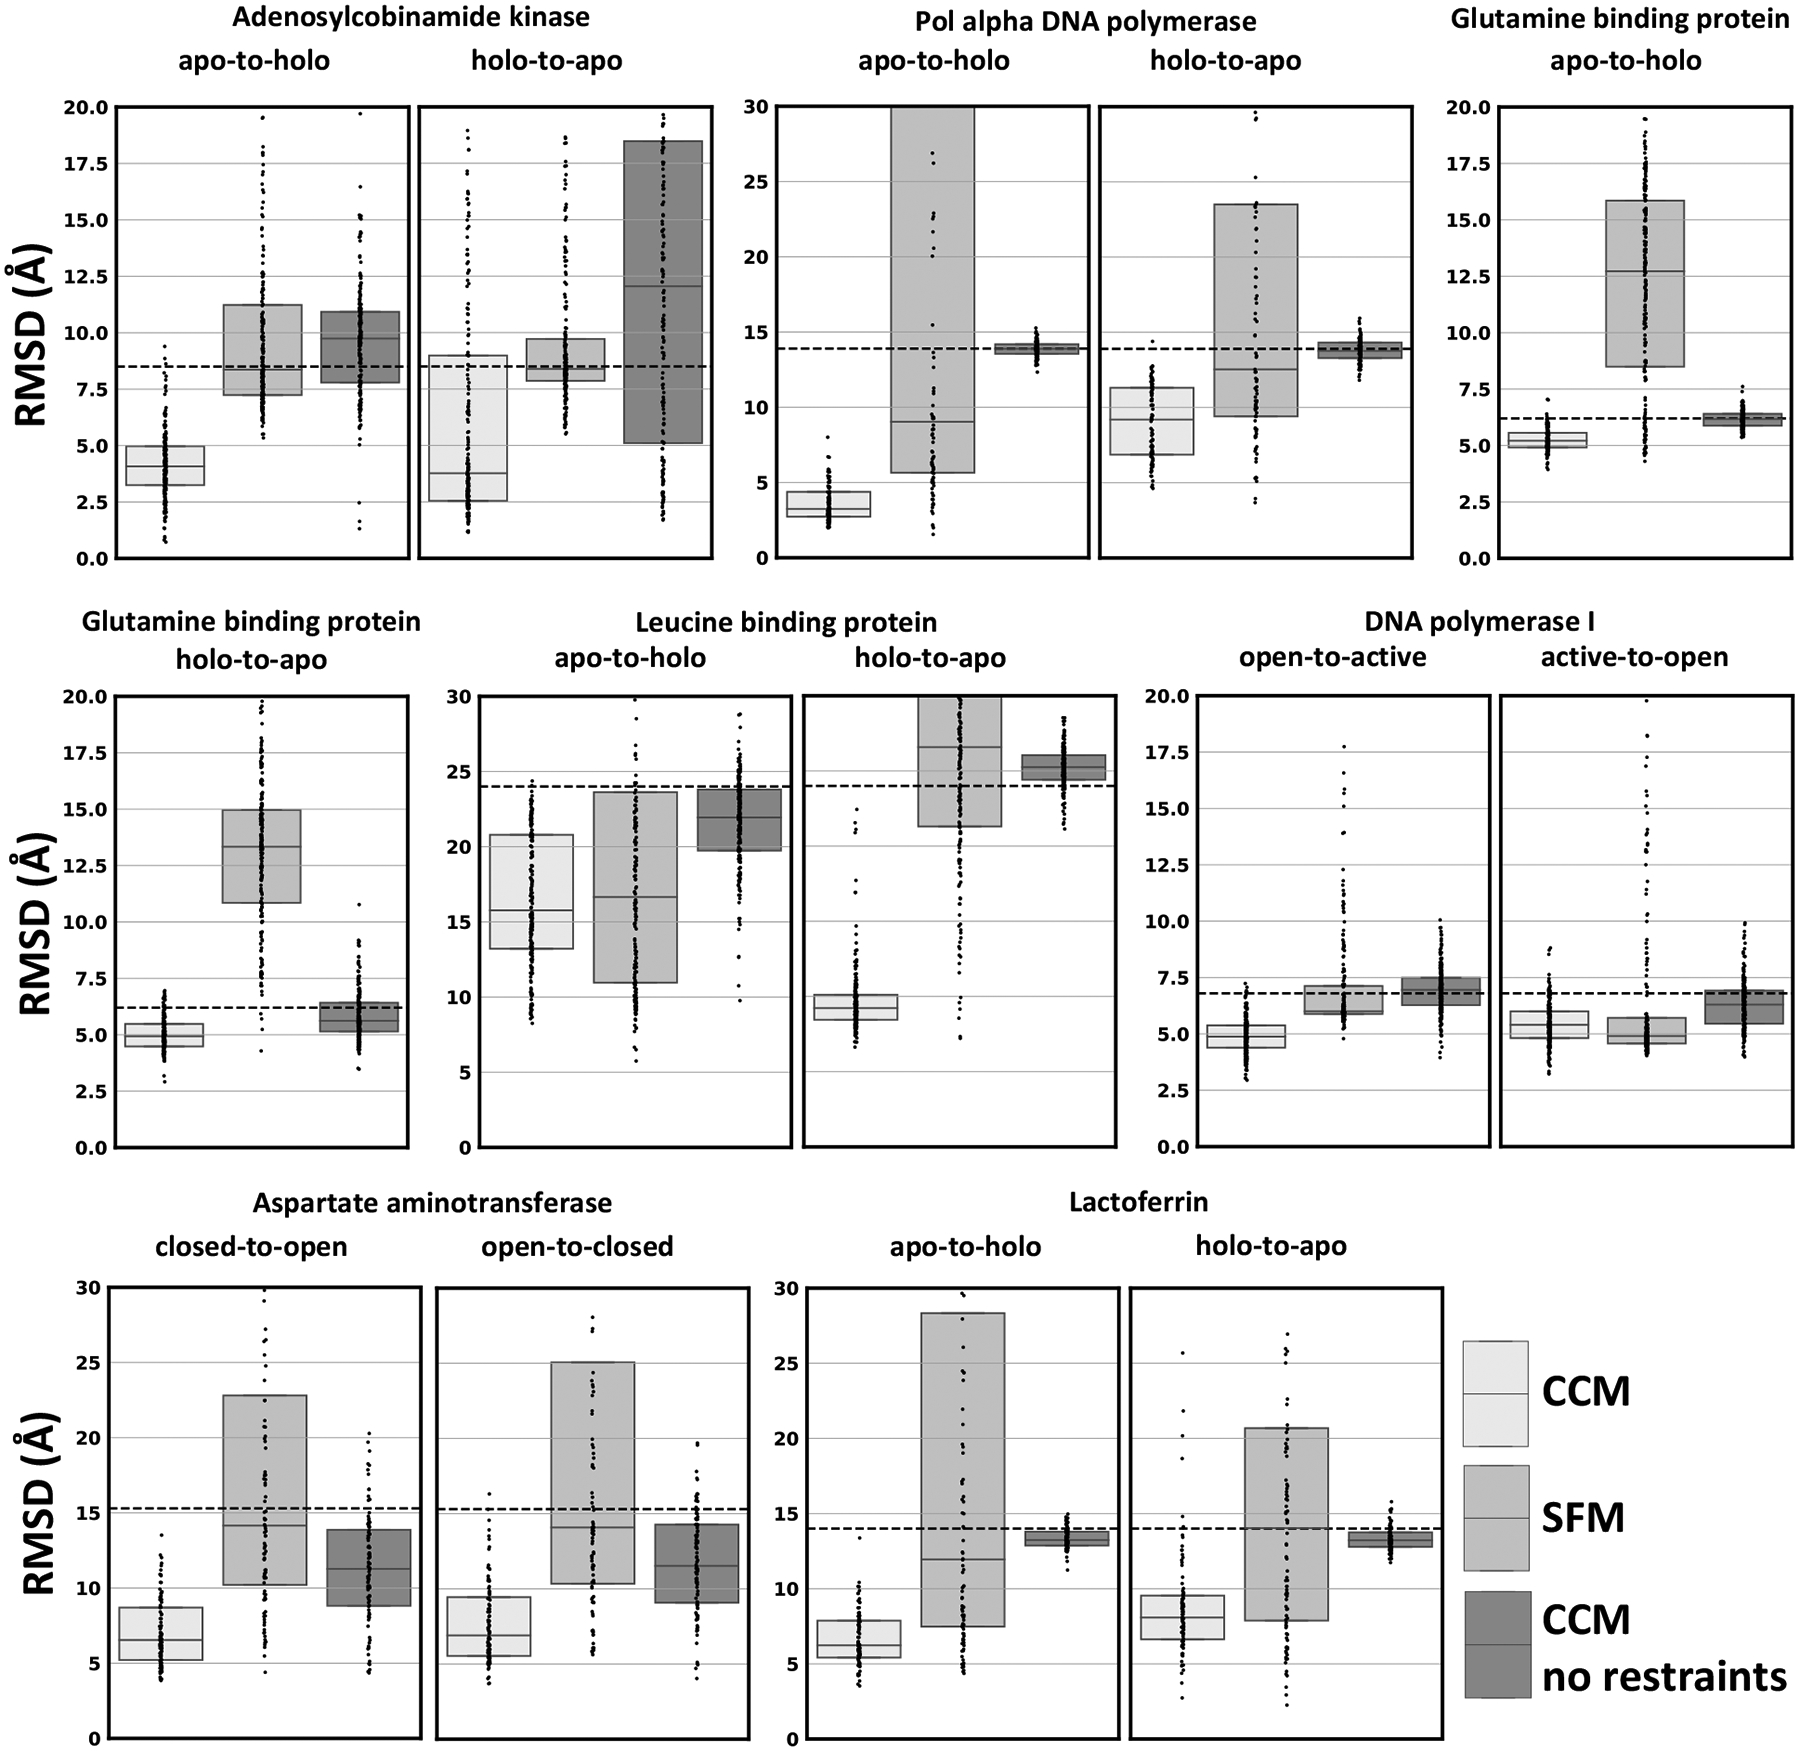
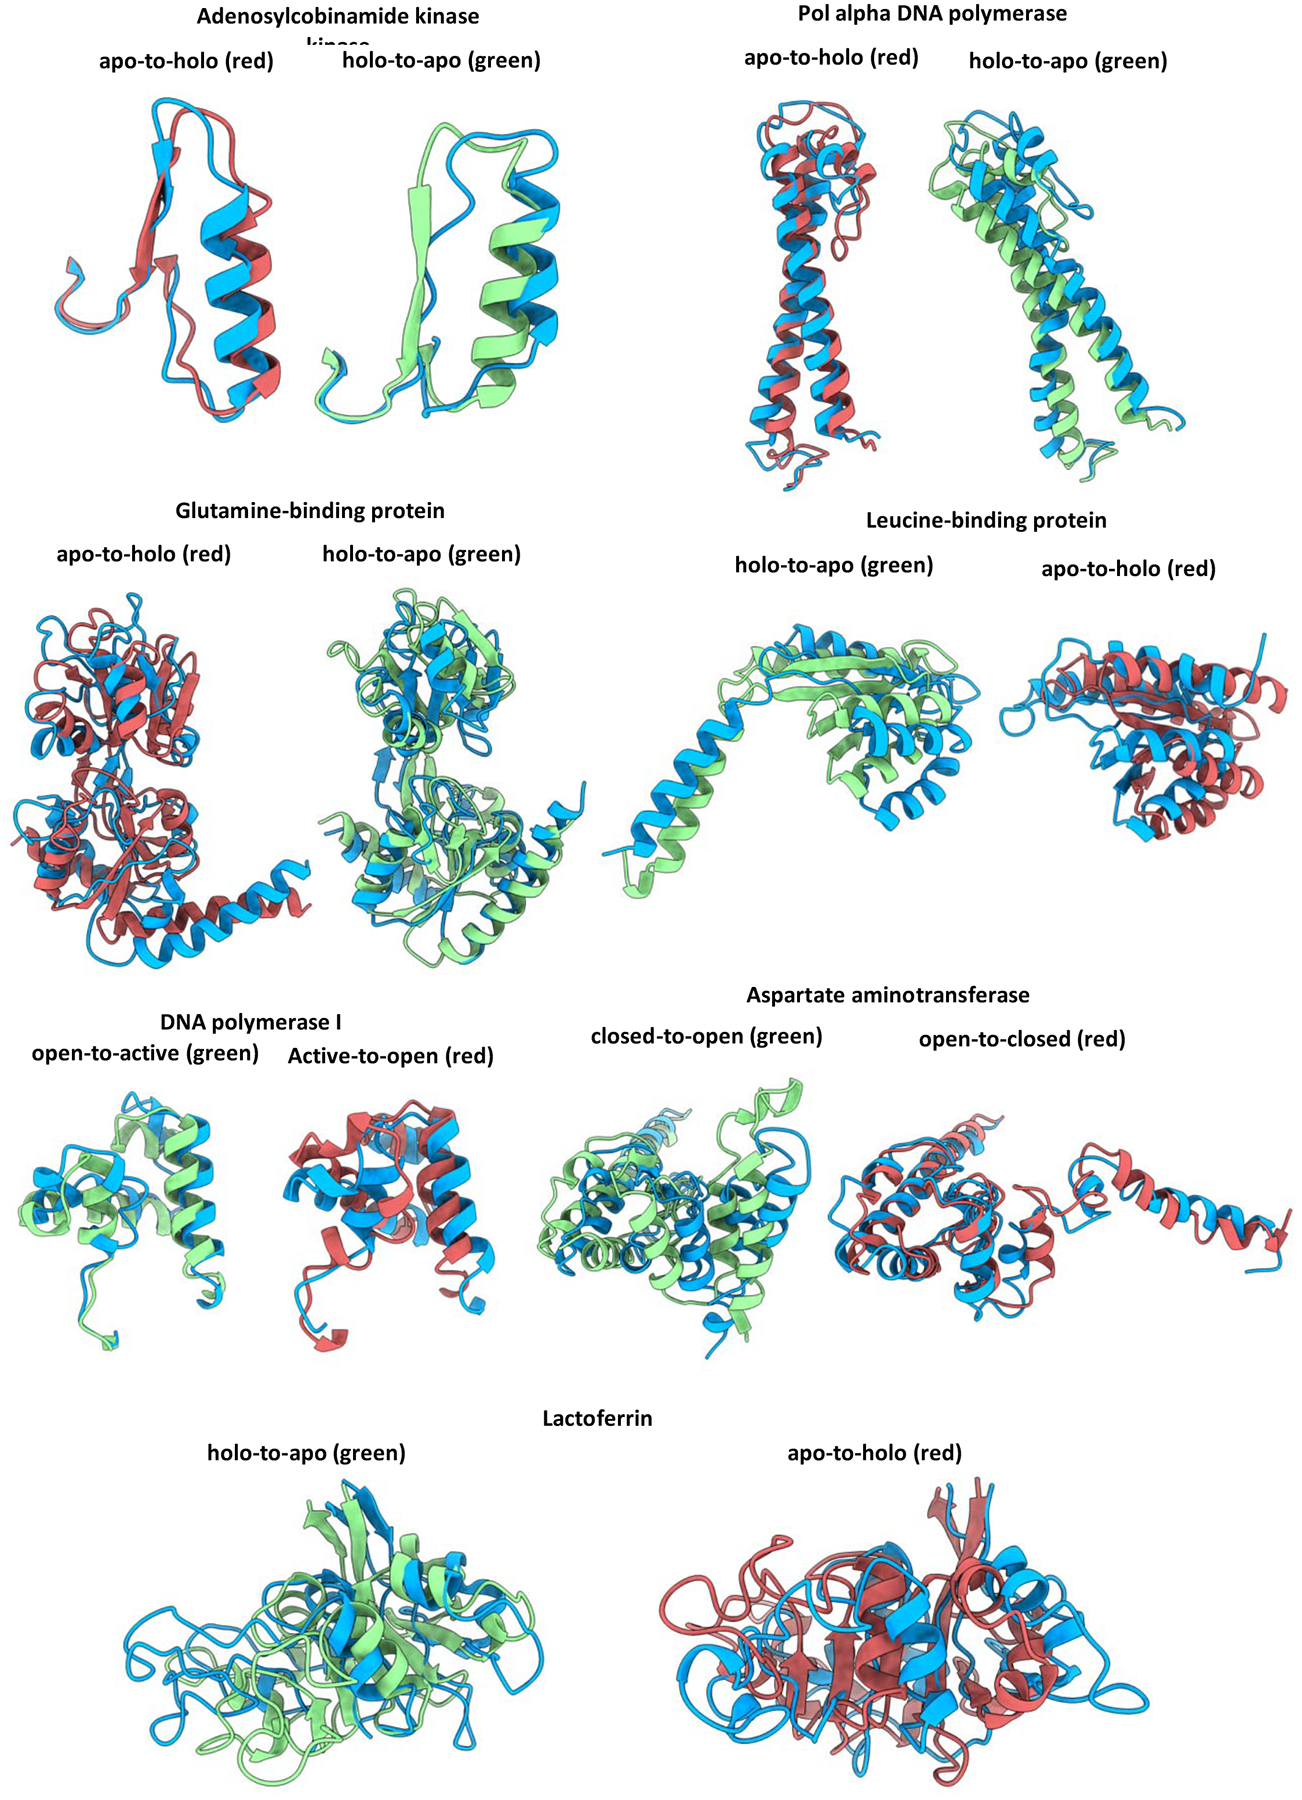
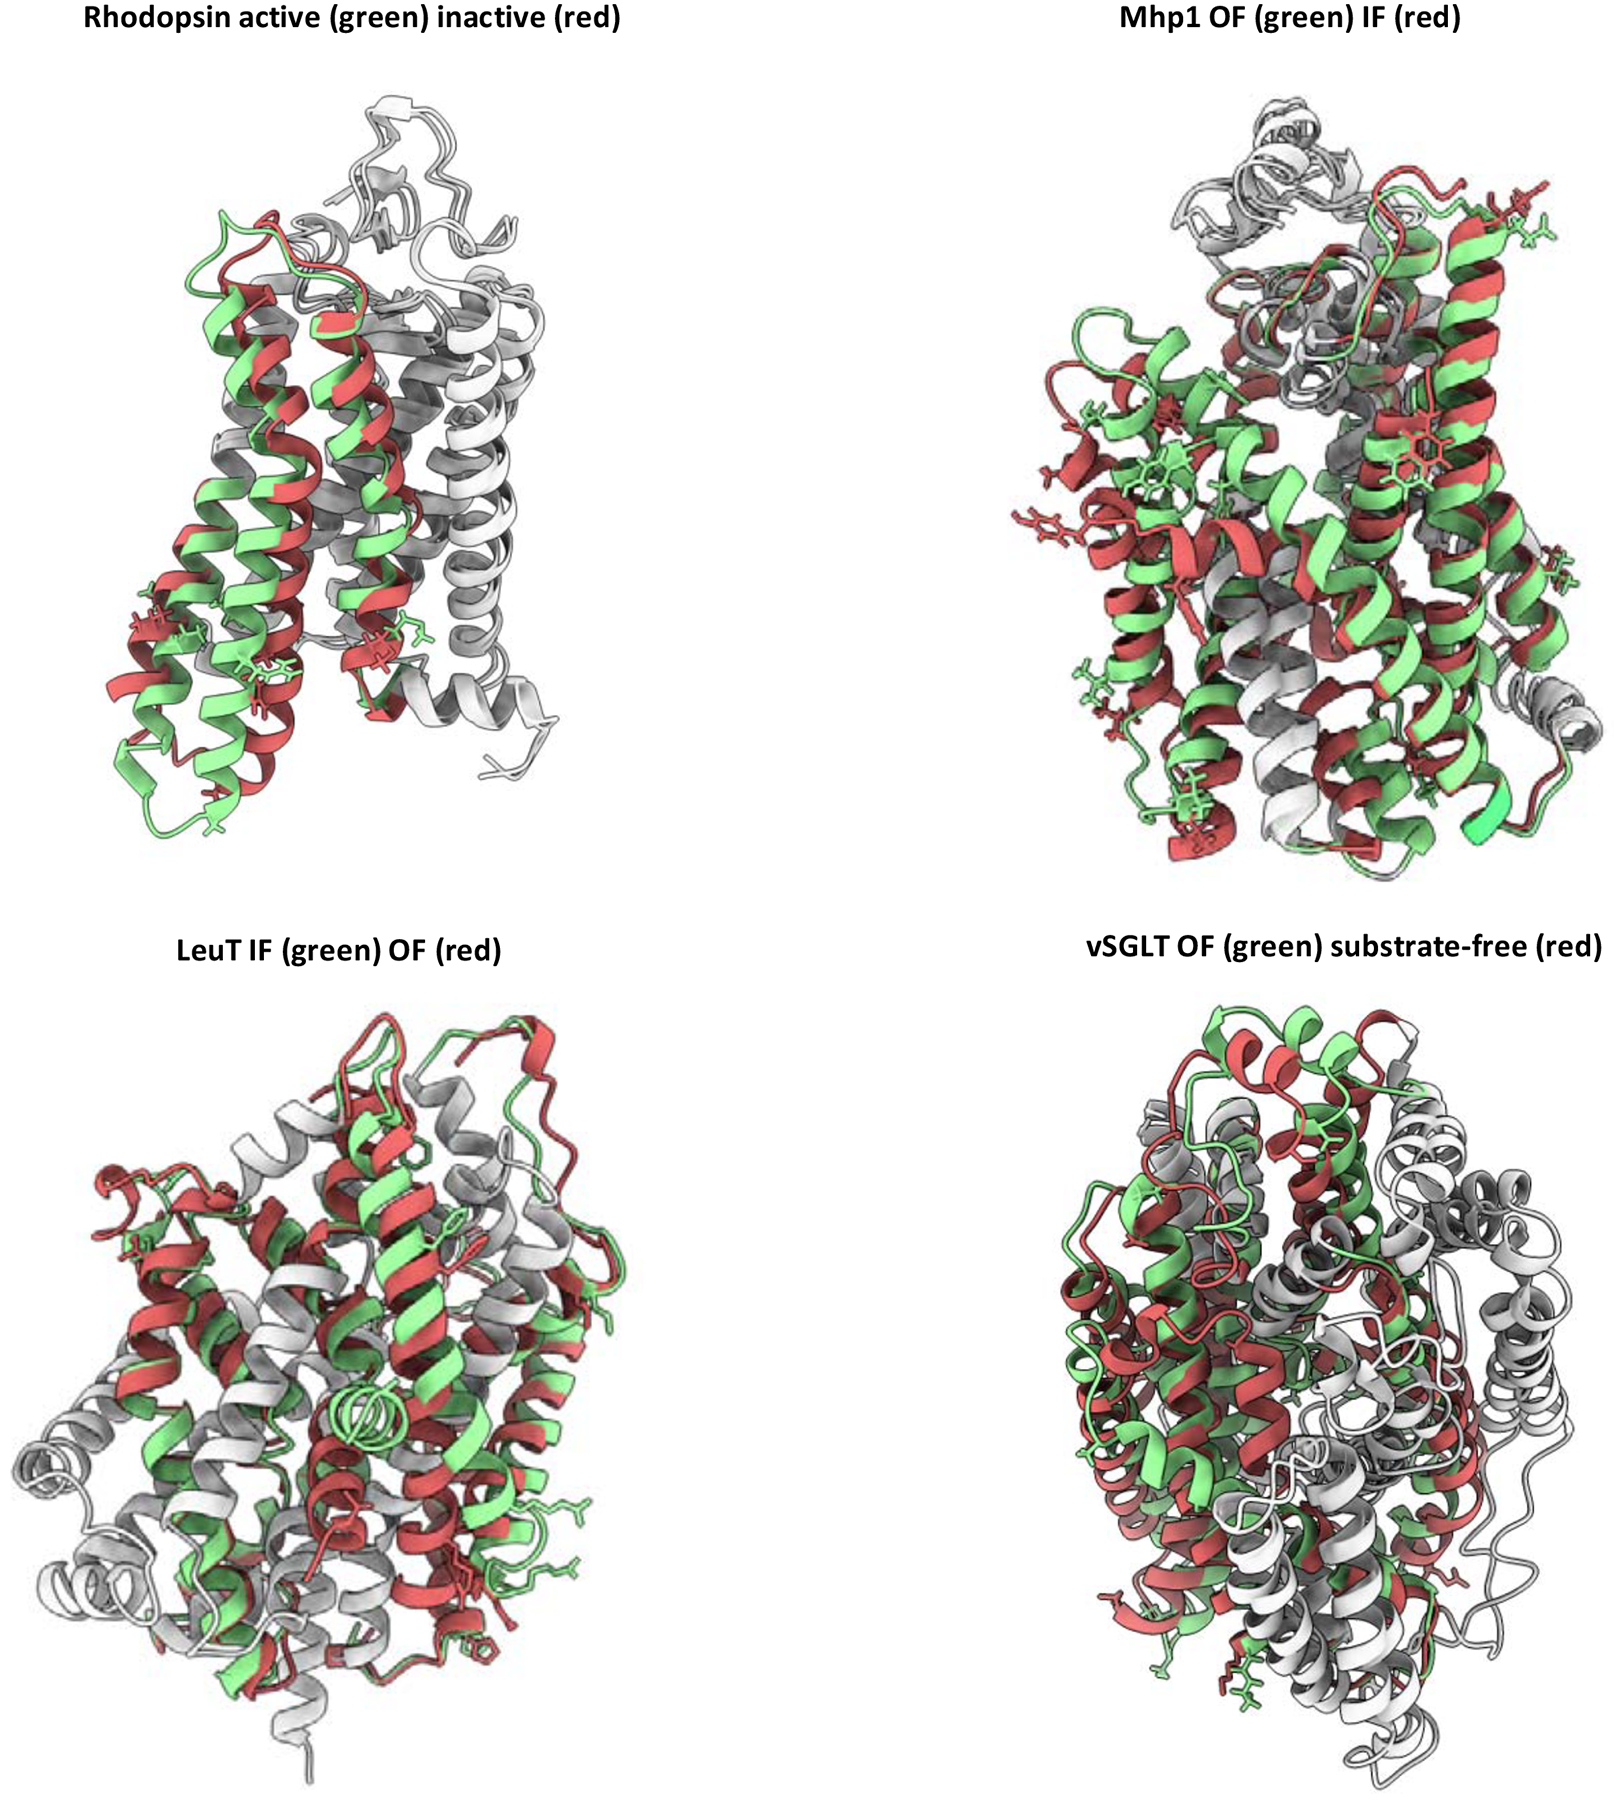
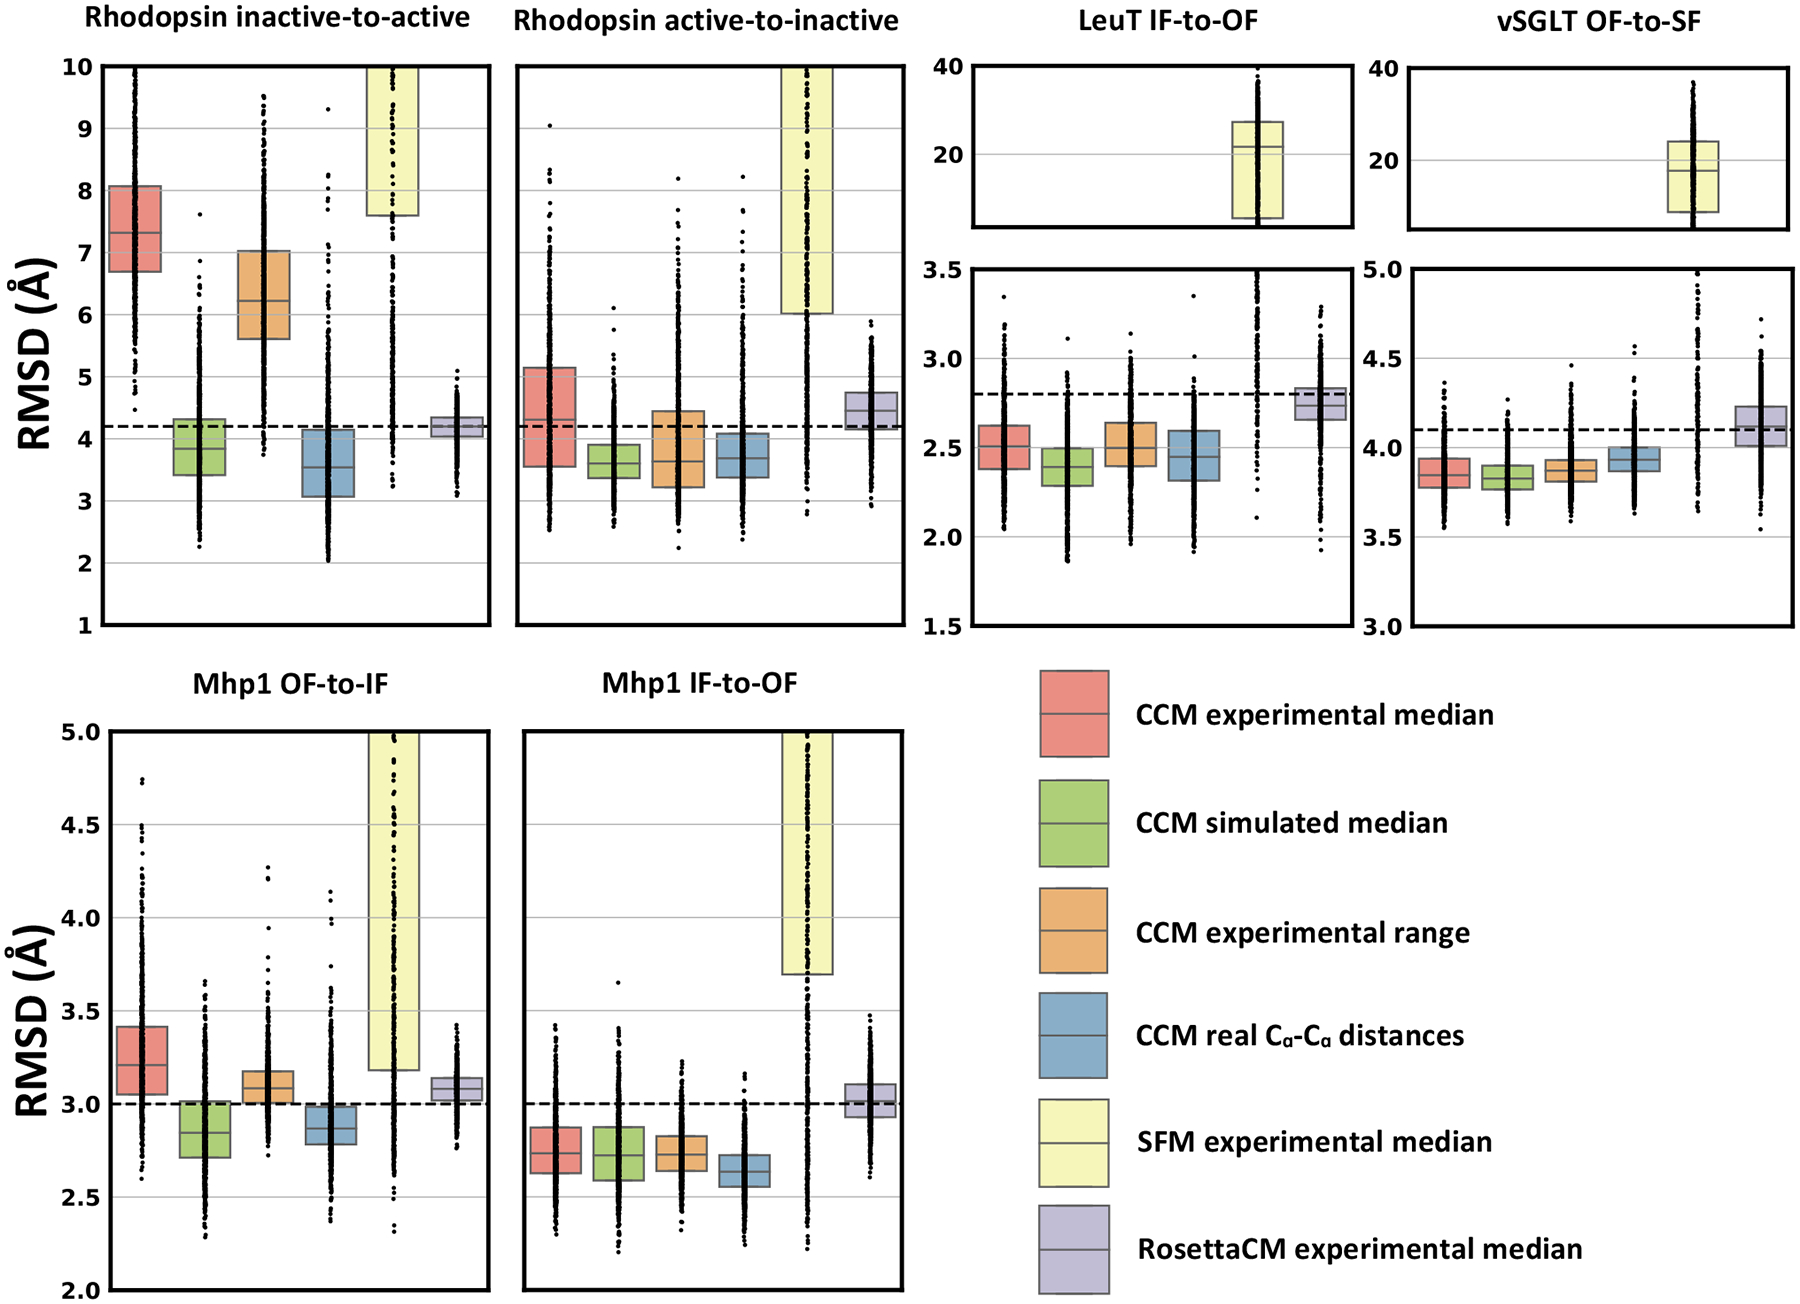
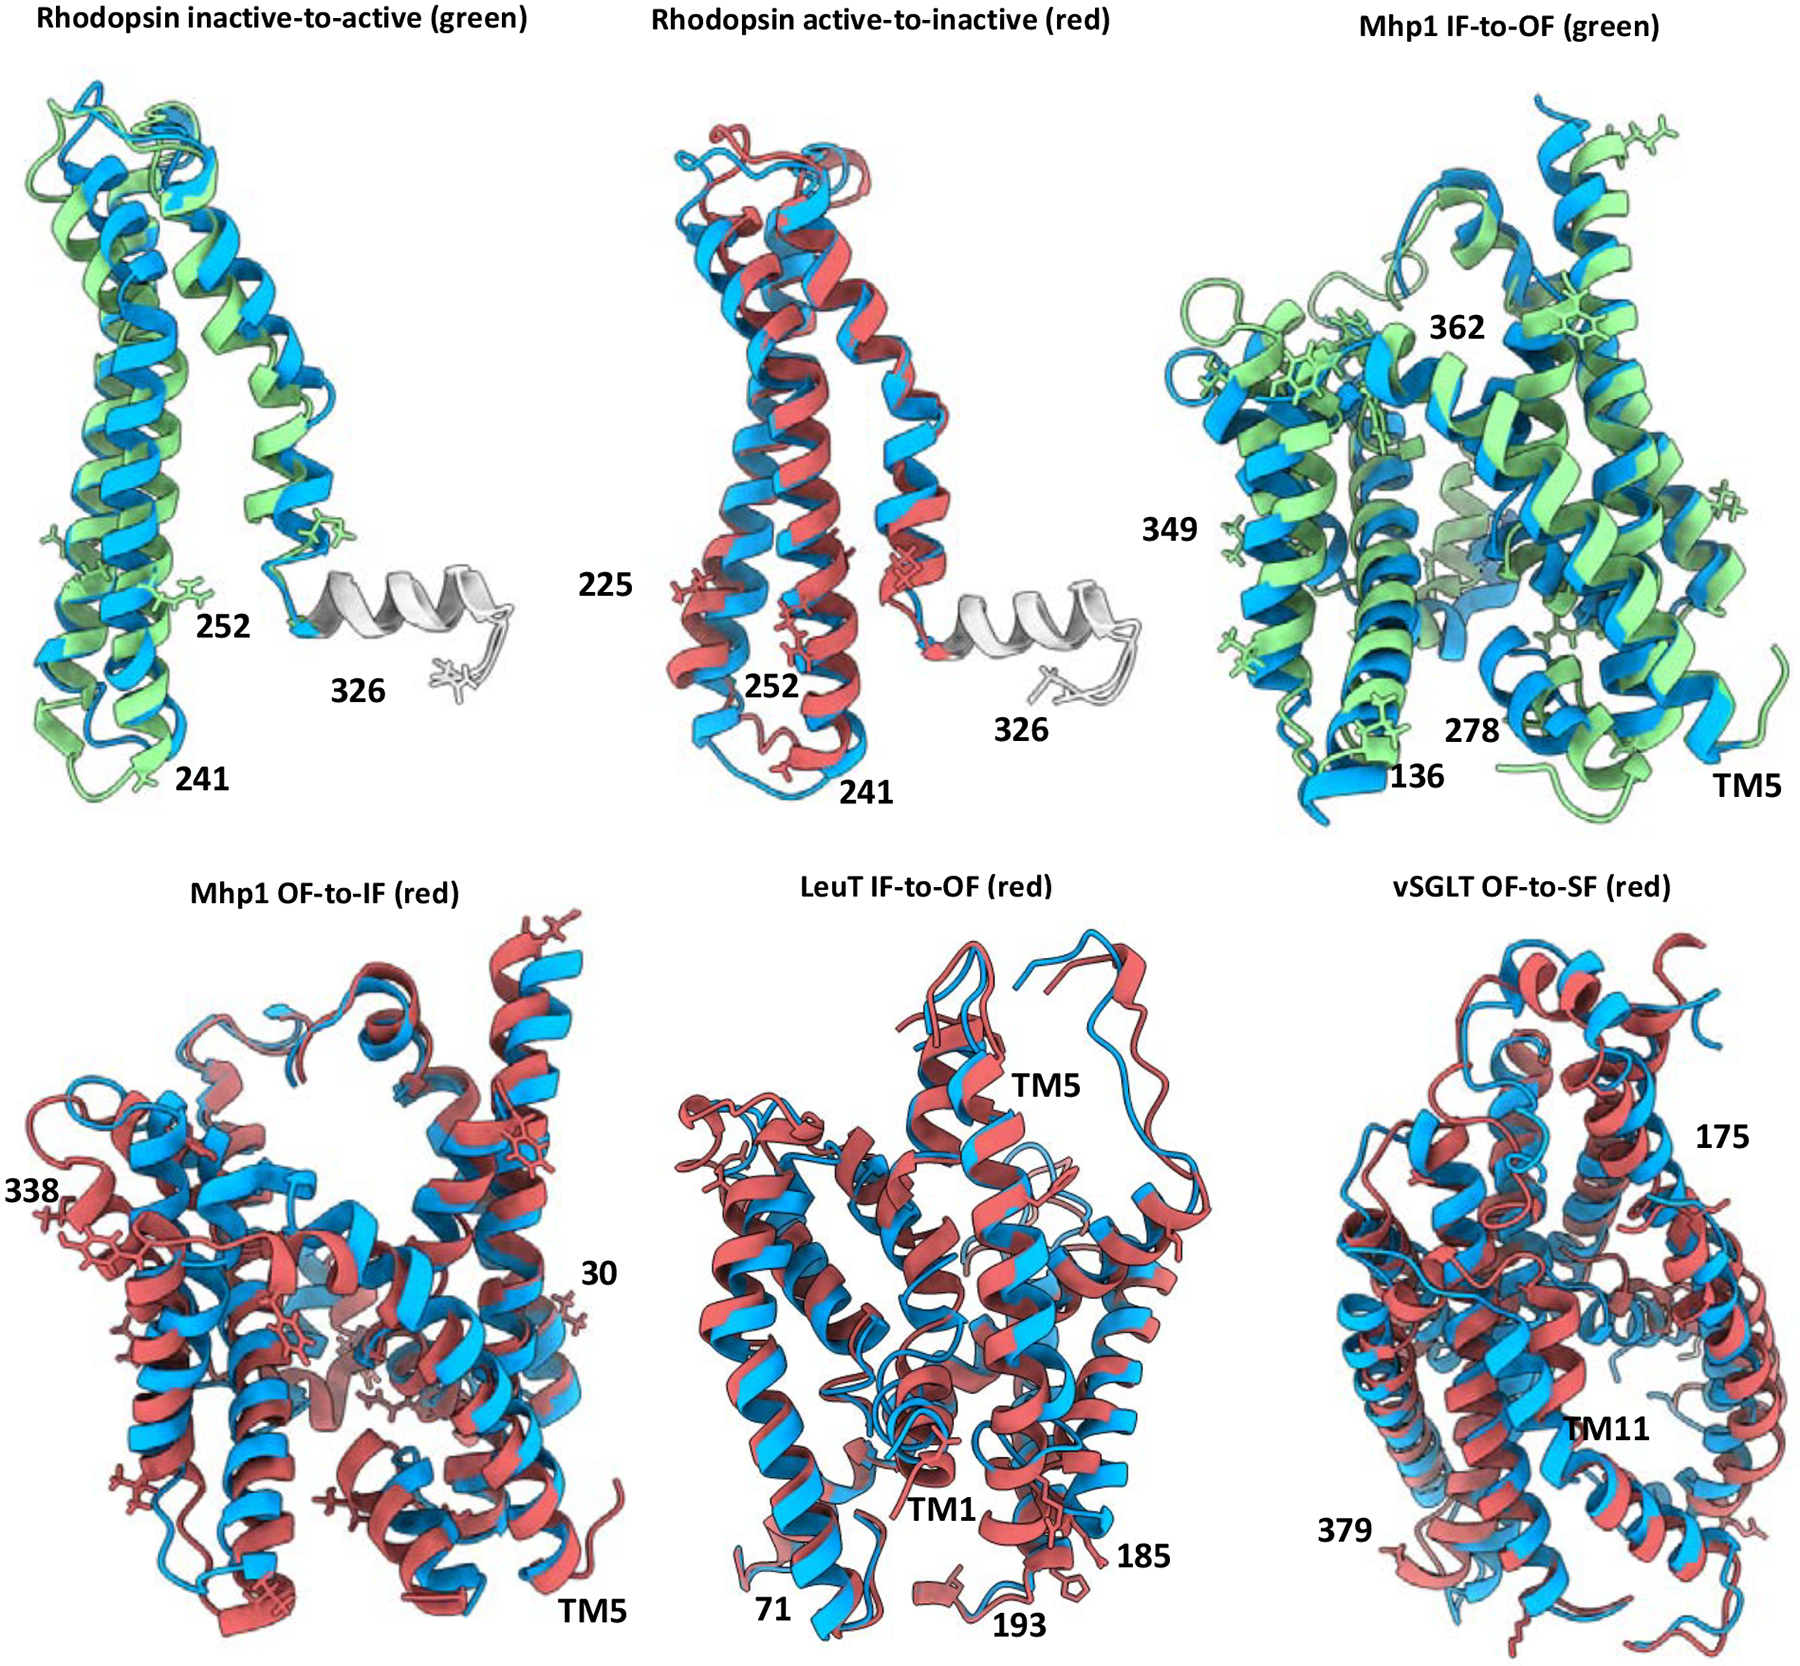
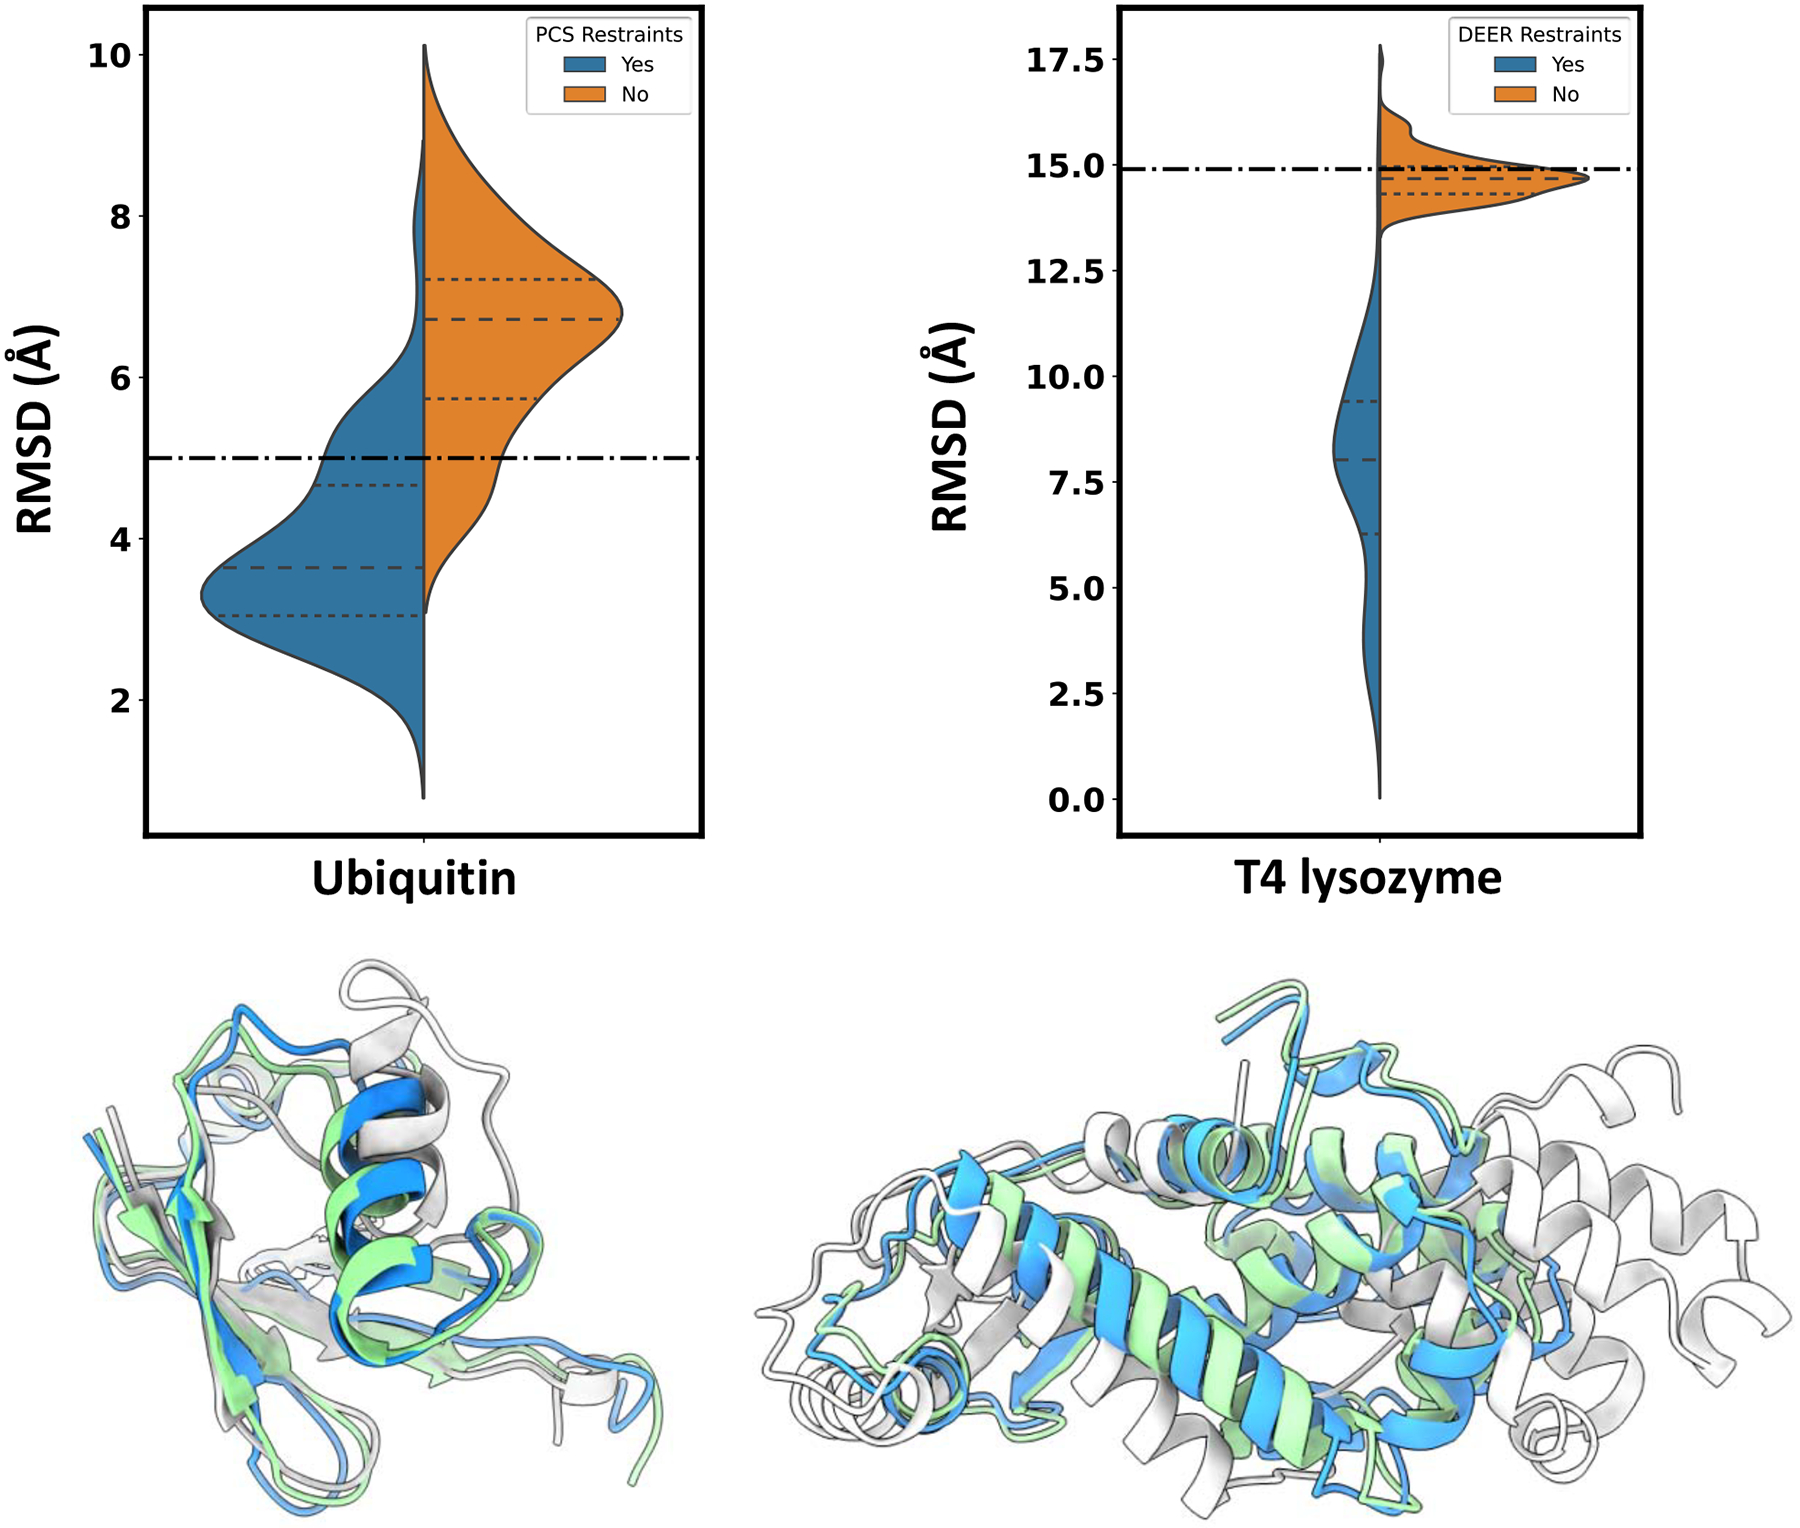
Conformational changes are an essential component of functional cycles of many proteins, but their characterization often requires an integrative structural biology approach. Here, we introduce and benchmark ConfChangeMover (CCM), a new method built into the widely used macromolecular modeling suite Rosetta that is tailored to model conformational changes in proteins using sparse experimental data. CCM can rotate and translate secondary structural elements and modify their backbone dihedral angles in regions of interest. We benchmarked CCM on soluble and membrane proteins with simulated Cα-Cα distance restraints and sparse experimental double electron-electron resonance (DEER) restraints, respectively. In both benchmarks, CCM outperformed state-of-the-art Rosetta methods, showing that it can model a diverse array of conformational changes. In addition, the Rosetta framework allows a wide variety of experimental data to be integrated with CCM, thus extending its capability beyond DEER restraints. This method will contribute to the biophysical characterization of protein dynamics.

Keywords: EPR spectroscopy; Rosetta; conformational changes; integrative structural biology; molecular modeling; protein dynamics; protein structure refinement.


Conflict of interest statement

Declaration of interests The authors declare no competing interests.

Figures

Figure 1.
Figure 1.
Conformational changes of soluble proteins in the benchmark. Regions modeled are in red or green. Regions not modeled are in gray.
Figure 2.
Figure 2.
CCM modeled SSEs conformational changes of soluble proteins using simulated Cα-Cα distance restraints. Dots represent the real distribution of RMSD values from the target structure. RMSD between the two native conformations is shown as a dashed line.
Figure 3.
Figure 3.
CCM with simulated Cα-Cα distances generated a high accuracy model for most of the benchmarked soluble proteins. The target conformation is in green or red, following the color code used in Fig 1. Models are in blue.
Figure 4.
Figure 4.
Benchmarked conformational changes of membrane proteins. Protein regions modeled are shown in red or green. Regions not modeled are in gray. Restrained residues are shown as sticks.
Figure 5.
Figure 5.
CCM outperformed other Rosetta methods in modeling conformational changes of membrane proteins. Restraints were provided as median values of the experimental distribution (experimental median) or as a range centered on the median value (experimental range). Dots represent the real distribution of RMSD values from the target conformation. RMSD between the two native conformations is shown as a dashed line.
Figure 6.
Figure 6.
Complexity of conformational changes and accuracy of experimental restraints affect the accuracy achieved in modeling specific protein regions, see also Figures S5 and S6. The target conformation is in green or red, following the color code used in Fig 4. Rhodopsin helix 8 is in gray. The model is shown in blue. Restrained residues are represented as sticks. Residues involved in restraints featuring a relevant difference between experimental and simulated DEER distances are labeled and mapped on structures.
Figure 7.
Figure 7.
CCM in combination with NMR or EPR data can potentially be used to refine distorted or misfolded conformations. Dot dashed line indicates RMSD between starting and target structure. In colored cartoon are represented the initial conformation (light gray), the target structure (green) and the best model in the ensemble (blue).

References

    1. del Alamo D, Tessmer MH, Stein RA, Feix JB, Mchaourab HS, and Meiler J (2020). Rapid Simulation of Unprocessed DEER Decay Data for Protein Fold Prediction. Biophys. J 118, 366–375. - PMC - PubMed
    1. del Alamo D, Jagessar KL, Meiler J, and McHaourab HS (2021a). Methodology for rigorous modeling of protein conformational changes by Rosetta using DEER distance restraints. PLoS Comput. Biol 17, 1–18. - PMC - PubMed
    1. del Alamo D, Fischer AW, Moretti R, Alexander NS, Mendenhall J, Hyman NJ, and Meiler J (2021b). Efficient Sampling of Protein Loop Regions Using Conformational Hashing Complemented with Random Coordinate Descent. J. Chem. Theory Comput 17, 560–570. - PubMed
    1. AlQuraishi M (2021). Machine learning in protein structure prediction. Curr. Opin. Chem. Biol 65, 1–8. - PubMed
    1. Aprahamian ML, Chea EE, Jones LM, and Lindert S (2018). Rosetta Protein Structure Prediction from Hydroxyl Radical Protein Footprinting Mass Spectrometry Data. Anal. Chem 90, 7721–7729. - PMC - PubMed

Publication types

MeSH terms

Substances

LinkOut - more resources