. 2022 May 21;12(1):8607.
doi: 10.1038/s41598-022-12504-x.

Indocyanine green fluorescence image processing techniques for breast cancer macroscopic demarcation

Affiliations

Indocyanine green fluorescence image processing techniques for breast cancer macroscopic demarcation

Maria Leiloglou et al. Sci Rep. .

Abstract

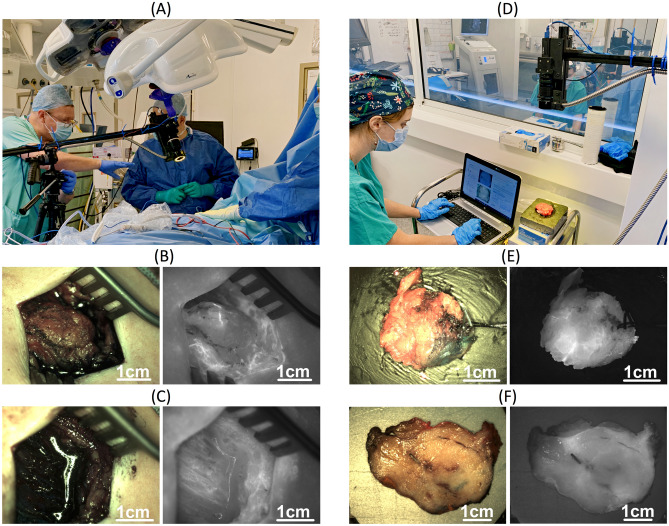
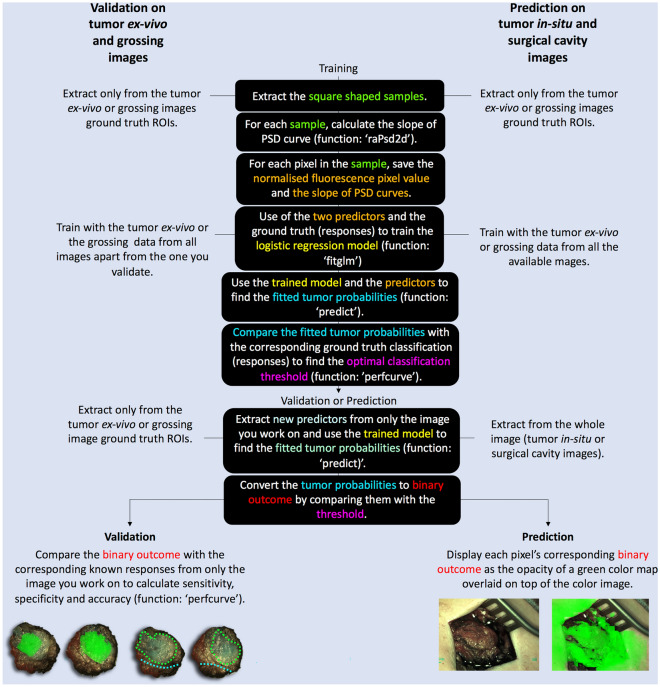
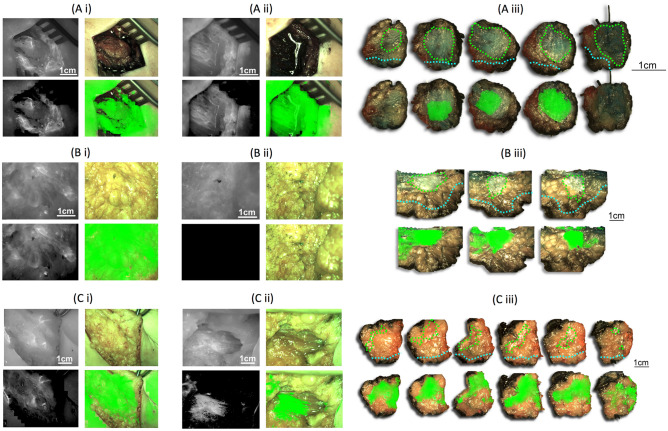
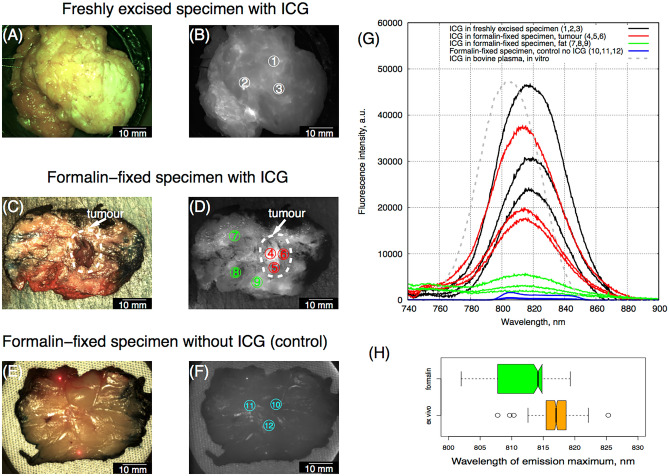
Re-operation due to disease being inadvertently close to the resection margin is a major challenge in breast conserving surgery (BCS). Indocyanine green (ICG) fluorescence imaging could be used to visualize the tumor boundaries and help surgeons resect disease more efficiently. In this work, ICG fluorescence and color images were acquired with a custom-built camera system from 40 patients treated with BCS. Images were acquired from the tumor in-situ, surgical cavity post-excision, freshly excised tumor and histopathology tumour grossing. Fluorescence image intensity and texture were used as individual or combined predictors in both logistic regression (LR) and support vector machine models to predict the tumor extent. ICG fluorescence spectra in formalin-fixed histopathology grossing tumor were acquired and analyzed. Our results showed that ICG remains in the tissue after formalin fixation. Therefore, tissue imaging could be validated in freshly excised and in formalin-fixed grossing tumor. The trained LR model with combined fluorescence intensity (pixel values) and texture (slope of power spectral density curve) identified the tumor's extent in the grossing images with pixel-level resolution and sensitivity, specificity of 0.75 ± 0.3, 0.89 ± 0.2.This model was applied on tumor in-situ and surgical cavity (post-excision) images to predict tumor presence.


Conflict of interest statement

The authors declare no competing interests.

Figures

Figure 1
Figure 1
Demonstration of imaging with the in-house dual camera system and image category examples that have been used for either training/validation or prediction without subsequent validation of the classification models. (A) In-vivo imaging (as presented in). (B) Tumor in-situ and (C) surgical cavity post-excision. These images were only used for trained model prediction (the trained models were applied to make predictions but could not be subsequently validated due to lack of ground truth). (D) Ex-vivo imaging. (E) Tumor ex-vivo and (F) tumor grossing in the histopathology lab, both used for model training and validation.
Figure 2
Figure 2
Image processing flow chart, demonstrating image scale extraction, dark frame subtraction, ground truth extraction and tumor probability map overlay of the fluorescence image pixel values and texture metrics separately. Areas which were true negatives were based on the histopathology report. True positives were taken from macroscopic identification of the tumor during grossing by a histopathologist. These areas were contoured by a clinical member of the team. In the tumor ex-vivo images, the specimen was oriented so that the fluorescence image was able to be compared with the corresponding radiography image. In this radiography image, the tumor core was indicated with a wire tip (WGL cases) and superior/lateral specimen views were shown with double and triple staples (demonstration in Fig. 3 of). In the histopathology grossing data, specimen orientation was retrieved from the specimen facets inked to encode anterior/posterior, lateral/medial, or superior/inferior views.
Figure 3
Figure 3
Hybrid model validation (with LOOCV approach) as well as prediction steps when both the normalized fluorescence pixel values and the slope of the PSD curves were used as predictors.
Figure 4
Figure 4
Overlay of the tumor probability maps on freshly excised tumor ex-vivo (A) and histopathology grossing (B) specimens from the angiography cohort. The whole ex-vivo tumor was imaged from two clinical cases (first: Ai-Aii and second: Aiii-Aiv) at the anterior (Ai, Aiii) and posterior (Aii, Aiv) views. Histopathology specimens are from four different clinical cases (Bi-Biv). First row: the raw fluorescence image marked for ground truth tumor (green contour) and healthy margin (blue contour). Second row: the corresponding raw color image. Third, fourth and fifth rows: overlay of the tumor probability maps on the color image when the logistic regression model was trained (in a LOOCV manner) with the angiography cohort ex-vivo tumor images (A) or the histopathology images (B) and the predictors were either only the normalized fluorescence pixel values (third row), or only the slope of the PSD curve values (fourth row) or the hybrid model (fifth row). Scale of each specimen (column) is indicated with a bar in the first row.
Figure 5
Figure 5
Examples of three individual clinical cases from the angiography cohort presented in three separate rows (A, B, C). (i) and (ii) panels demonstrate the raw fluorescence (top left) and color (top right) data and corresponding tumor probability map (bottom left) and its overlay (bottom right) for (i) the tumor in-situ, and (ii) tumor surgical cavity post-excision. Note that ground truth could not be marked for this data and therefore validation was not possible. Panel (iii) demonstrates the corresponding excised tumor histopathology grossing raw color image (top) with marked ground truth for tumor (green) and healthy margin (cyan) and the tumor probability map overlay (bottom). In all cases the tumor probability map was extracted with the logistic regression model, trained with both the normalized fluorescence pixel values and the slope value of the PSD curves in histopathology grossing images. Case A was found from the anterior (within 2 mm) and posterior sides (within 0.5 mm) with tumor (Sects. 1 to 5 from medial to lateral). Therefore both (Ai) and (Aii) were expected to fluoresce. Case B was found from the anterior side (within 2 mm) and from the posterior side (at > 10 mm) with tumor (10th to 12th sections in the medial to lateral direction). Therefore only (Bi) was expected to fluoresce. Case C was found from the anterior side (within 0.6 mm) and from the posterior side (within 4 mm) with tumor (Sects. 4 to 9 from medial to lateral). Therefore only (Ci) was expected to fluoresce. From panel iii it is evident that there is an agreement between the ground truth and the tumour probability map overlay apart from case A, where there are two false negative samples due to the presence of Methylene Blue whose excitation spectrum overlaps with that of ICG. Scale of each in-vivo image (Ai, Aii, Bi, Bii, Ci, Cii) is indicated with a bar in the raw fluorescence (top left) part. Scale of the grossing images (Aiii, Biii, Ciii) is indicated with a bar on the right side of each clinical case.
Figure 6
Figure 6
Examples of histopathology sample from formalin fixed grossed breast specimen. (A) Color image and (B) fluorescence image of a specimen from a patient (case 37) injected with 2.5 mg/kg immediately after resection (C) Color image and (D) fluorescence image of the formalin-fixed specimen from the same patient. (E) Color and (F) fluorescence image of a formalin-fixed specimen from a patient without ICG injection (control). (G) Examples of fluorescence spectra registered from the freshly excised specimen of the same patient (case 37) with ICG (black solid lines), from formalin-fixed tumor (red solid lines), surrounding fat tissues (green solid lines), from a formalin-fixed specimen of the control patient without ICG (blue solid lines), and the emission spectra of ICG in bovine plasma (grey dashed lines). The numbered circles indicate the approximate fluorescence spectra locations (referred to in (G)). (H) Variability of the ICG fluorescence maximum position in freshly excised specimens from four patients (orange, 563 spectra) and in the formalin fixed specimens (green, 261 spectra) is shown in (H). Boxes represent median, 2nd and 3rd quartile, whiskers represent maximum and minimum values.

References

    1. Sung H, et al. Global cancer statistics 2020: GLOBOCAN estimates of incidence and mortality worldwide for 36 cancers in 185 countries. CA Cancer J. Clin. 2021;71:209–249. doi: 10.3322/caac.21660. - DOI - PubMed
    1. Ye JC, Yan W, Christos PJ, Nori D, Ravi A. Equivalent survival with mastectomy or breast conserving surgery plus radiation in young women under the age of 40 with early-stage breast cancer: a national registry based stage-by-stage comparison. Clin. Breast Cancer. 2015;15:390–397. doi: 10.1016/j.clbc.2015.03.012. - DOI - PMC - PubMed
    1. Moyer, A. in Psychosocial outcomes of breast-conserving surgery versus mastectomy: A meta-analytic review 288 (American Psychological Association, Washington, DC, US, 1999). - PubMed
    1. MacNeill, F. & Irvine, T. Breast Surgery GIRFT Programme National Specialty Report, (2021).
    1. Chan BKY, Wiseberg-Firtell JA, Jois RHS, Jensen K, Audisio RA. Localization techniques for guided surgical excision of non-palpable breast lesions. Cochrane Database Syst. Rev. 2015 doi: 10.1002/14651858.CD009206.pub2. - DOI - PMC - PubMed

Publication types