. 2022 Sep;16(9):2065-2075.
doi: 10.1038/s41396-022-01252-5. Epub 2022 May 21.

Complex and unexpected outcomes of antibiotic therapy against a polymicrobial infection

Affiliations

Complex and unexpected outcomes of antibiotic therapy against a polymicrobial infection

Lydia-Ann J Ghuneim et al. ISME J. 2022 Sep.

Abstract

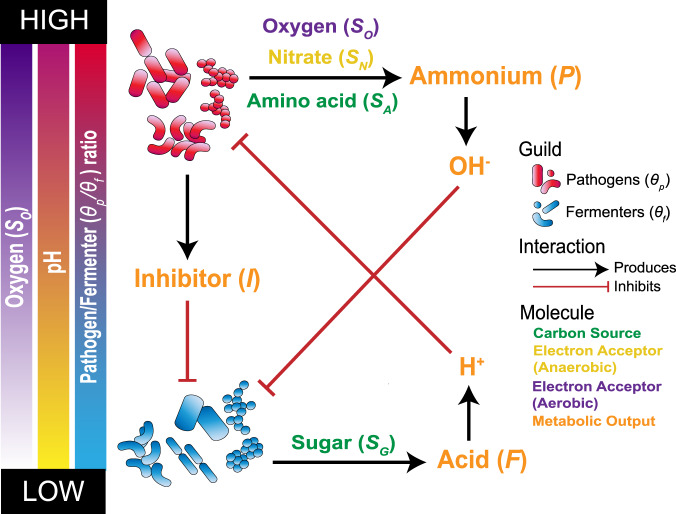
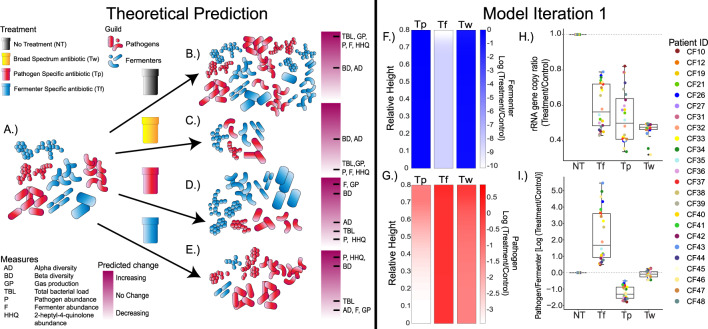
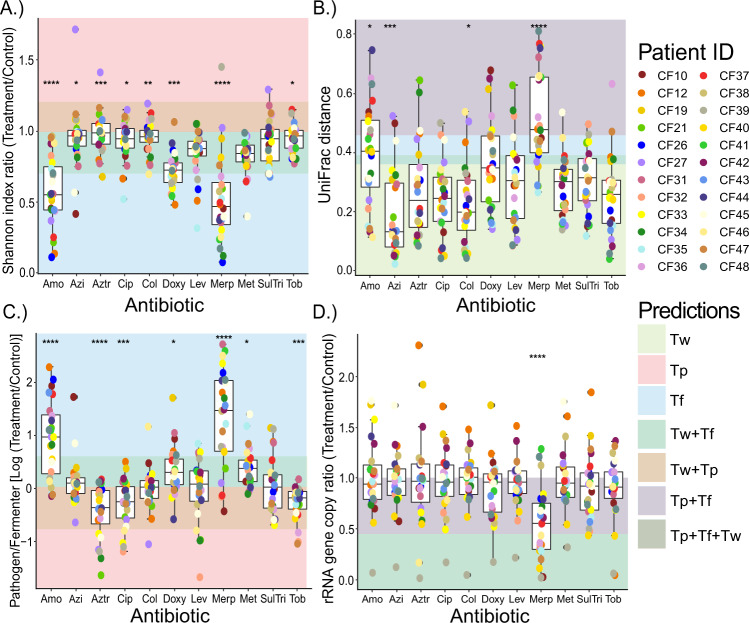
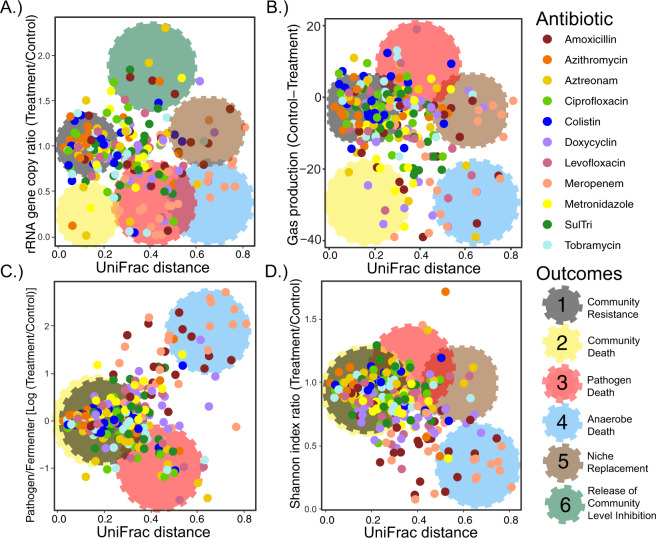
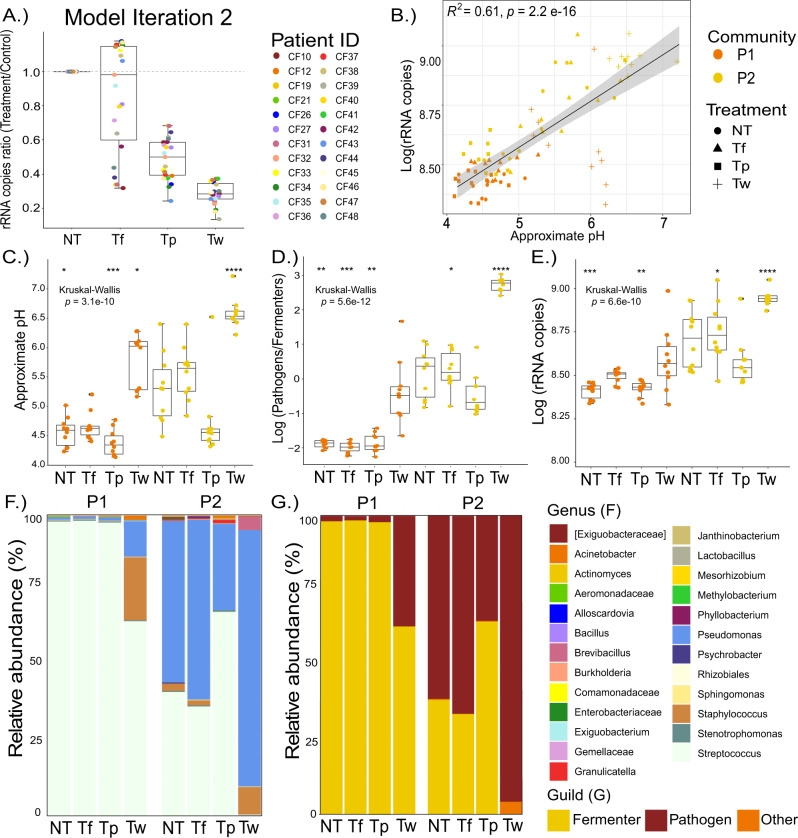
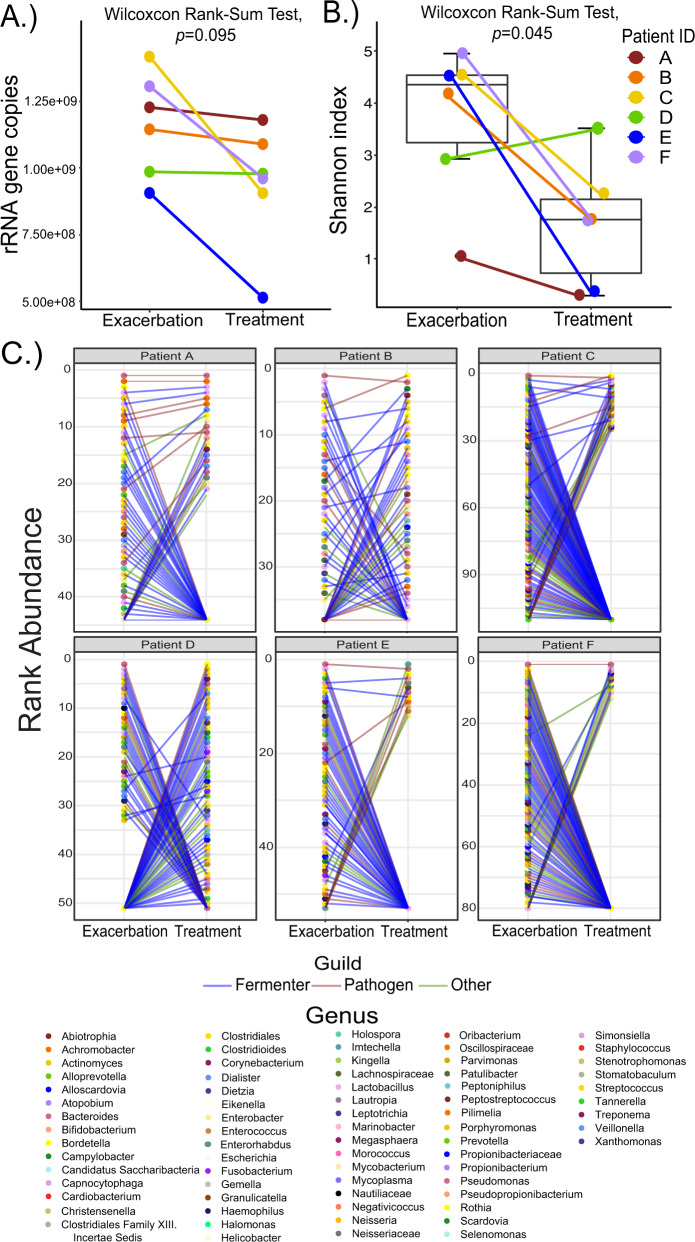
Antibiotics are our primary approach to treating complex infections, yet we have a poor understanding of how these drugs affect microbial communities. To better understand antimicrobial effects on host-associated microbial communities we treated cultured sputum microbiomes from people with cystic fibrosis (pwCF, n = 24) with 11 different antibiotics, supported by theoretical and mathematical modeling-based predictions in a mucus-plugged bronchiole microcosm. Treatment outcomes we identified in vitro that were predicted in silico were: 1) community death, 2) community resistance, 3) pathogen killing, and 4) fermenter killing. However, two outcomes that were not predicted when antibiotics were applied were 5) community profile shifts with little change in total bacterial load (TBL), and 6) increases in TBL. The latter outcome was observed in 17.8% of samples with a TBL increase of greater than 20% and 6.8% of samples with an increase greater than 40%, demonstrating significant increases in community carrying capacity in the presence of an antibiotic. An iteration of the mathematical model showed that TBL increase was due to antibiotic-mediated release of pH-dependent inhibition of pathogens by anaerobe fermentation. These dynamics were verified in vitro when killing of fermenters resulted in a higher community carrying capacity compared to a no antibiotic control. Metagenomic sequencing of sputum samples during antibiotic therapy revealed similar dynamics in clinical samples. This study shows that the complex microbial ecology dictates the outcomes of antibiotic therapy against a polymicrobial infection.


Conflict of interest statement

The authors declare no competing interests.

Figures

Fig. 1
Fig. 1. Schematic of principles and interacations defining the mathematical model.
All consitunents of the model are represented in illustrating basic assumptions and interactions. Fermenters (θf) metabolize (SG) as a carbon source, which produce acid (F) leading to an increase in hydrons (H+) (i.e. lowering the pH) under anaerobic conditions. This pH decrease inhibitis the growth of pathogens. Pathogens (θP) in the presence of oxygen (SO) (i.e., aerobic conditions) use amino acids (SA) as their primary carbon source. The byproduct of this metabolism is ammonium (P), which produces hydroxide (OH-) leading to an increase in pH, inhibiting fermenter growth. Under anaerobic conditions pathogens use nitrate (SN) as an electron acceptor. In addition to this pathogens produce a chemical inhibitor of fermenters (I).
Fig. 2
Fig. 2. Theoretical predictions and Model iteration 1.
The initial microbiome is composed of both pathogens and fermenters and is illustrated in (A), but the proportions of these are unique to each patient. Under pressure of the various treatments (B) NT, (C) Tw, (D) Tp, and (E) Tf the predicted community response is illustrated. The response i.e., (expected change) in common microbiome measures as indicated in the legend (yellow = increase, red = decrease). The measures are the following: Alpha diversity (AD), Beta diversity (BD), gas production (GP), total bacterial load (TBL), pathogen abundance (P), fermenter abundance (F), and 2-heptyl-4quinolone abundance (HHQ). The model output treatment-to-NT log-ratio of (F) fermenter population and (G) pathogen population of patient 12 as an example with spatial variation at t = 50 h. Boxplots showing model outcomes of the (H) 16S rRNA gene copy ratio and (I) Pathogen to Fermenter log-ratio compared to the control. Each patients’ actual sputum Pathogen/Fermenter ratio was used as input to the model (n = 24). The dotted grey line denotes no change from treatment.
Fig. 3
Fig. 3. Different microbiome community measure changes compared to the no-antibiotic control.
The impacts of antibiotics (n = 11, Amo = amoxicillin, Azi = azithromycin, Aztr = aztreonam, Cip = ciprofloxacin, Col = colistin, Doxy = doxycycline, Lev = levofloxacin, Merp = meropenem, Met = metronidazole, SulTri = bactrim and Tob = tobramycin) compared to untreated control samples on (A) Shannon index ratio, (B) Weighted UniFrac distance, (C) pathogen to fermenter log ratio, and (D) rRNA gene copy ratio. Individual points are colored by patient (n = 24). The shaded areas behind the boxplots are regions of the plot where the outcomes of our theoretical predictions and/or model iteration 1 would lie if correct, colored according to antibiotic treatment type (Tw, Tp, and Tf). Kruskal-Wallis statistics are reported in Table S8. Asterisks denote p-value significance where ****p ≥ 0.0001, ***p ≥ 0.001, **p ≥ 0.01, *p ≥ 0.05. Mann-Whitney post hoc tests are reported in the Supplementary material (Tables S10–S16).
Fig. 4
Fig. 4. Characterizing outcomes in the antibiotic experiment.
Weighted UniFrac distance compared to (A) rRNA gene copies, (B) Gas production, (C) Pathogen to fermenter log ratio, (D) Shannon index. Individual points are colored by antibiotic treatment (n = 11). Observed outcomes (Community resistance, community death, pathogen death, anaerobe death, niche replacement, and release of community level inhibition) are highlighted via large cogs on each of the panels colored by the outcome they represent. These highlighted regions are meant to aid in visualization of their presence in the overlying data. Cutoff values of for the outcomes are further described in Table S17.
Fig. 5
Fig. 5. Model alteration and verification.
(A) Model iteration 2 outcomes of 16S rRNA gene copy ratio of each patients’ actual sputum Pathogen/Fermenter ratio was used as input to the model (n = 24). Individual points are colored by antibiotic treatment (n = 11). The dotted grey line denotes no change from treatment. Subsequent experimental validation using two communities, P1 and P2 (n = 10), showing the (B) pH in relation to log rRNA gene copies, (C) Approximate pH, (D) Pathogen/Fermenter log ratio, (E) log rRNA gene copies, (F) Genera abundance, (G) Distribution based on genera-classification as classical pathogen or anaerobic fermenter. Asterisks denote p-value significance where ****p ≥ 0.0001, ***p ≥ 0.001, **p ≥ 0.01, *p ≥ 0.05.
Fig. 6
Fig. 6. In vivo changes across individuals.
qPCR and shotgun metagenomics were performed on sputum samples from individuals (n = 6) before and after exacerbation. We examined the following: (A) rRNA gene copies (B) Shannon Index, and (C) Rank abundance. Each point on the rank abundance represents an individual strain. The color of lines on the rank abundance represents type of bacterium based on our model definitions where blue equates to Fermenters, red to Pathogens, and green to other.

References

    1. Klein EY, Van Boeckel TP, Martinez EM, Pant S, Gandra S, Levin SA, et al. Global increase and geographic convergence in antibiotic consumption between 2000 and 2015. Proc Natl Acad Sci USA. 2018;115:E3463–70. - PMC - PubMed
    1. Bevivino A, Bacci G, Drevinek P, Nelson MT, Hoffman L, Mengoni A. Deciphering the ecology of cystic fibrosis bacterial communities: towards systems-level integration. Trends Mol Med. 2019;25:1110–22. doi: 10.1016/j.molmed.2019.07.008. - DOI - PubMed
    1. Bacci G, Paganin P, Lopez L, Vanni C, Dalmastri C, Cantale C, et al. Pyrosequencing unveils cystic fibrosis lung microbiome differences associated with a severe lung function decline. PLoS ONE. 2016;11:e0156807. doi: 10.1371/journal.pone.0156807. - DOI - PMC - PubMed
    1. Raghuvanshi R, Vasco K, Vázquez-Baeza Y, Jiang L, Morton JT, Li D, et al. High-resolution longitudinal dynamics of the cystic fibrosis sputum microbiome and metabolome through antibiotic therapy. mSystems. 2020;5:e00292–20. doi: 10.1128/mSystems.00292-20. - DOI - PMC - PubMed
    1. Sherrard LJ, Bell SC, Tunney MM. The role of anaerobic bacteria in the cystic fibrosis airway. Curr Opin Pulm Med. 2016;22:637–643. doi: 10.1097/MCP.0000000000000299. - DOI - PubMed

Publication types

Substances