

Quantifying human mixing patterns in Chinese provinces outside Hubei after the 2020 lockdown was lifted
- PMID: 35597895
- PMCID: PMC9123295
- DOI: 10.1186/s12879-022-07455-7
Quantifying human mixing patterns in Chinese provinces outside Hubei after the 2020 lockdown was lifted
Abstract
Background: Contact patterns play a key role in the spread of respiratory infectious diseases in human populations. During the COVID-19 pandemic, the regular contact patterns of the population have been disrupted due to social distancing both imposed by the authorities and individual choices. Many studies have focused on age-mixing patterns before the COVID-19 pandemic, but they provide very little information about the mixing patterns in the COVID-19 era. In this study, we aim at quantifying human heterogeneous mixing patterns immediately after lockdowns implemented to contain COVID-19 spread in China were lifted. We also provide an illustrative example of how the collected mixing patterns can be used in a simulation study of SARS-CoV-2 transmission.
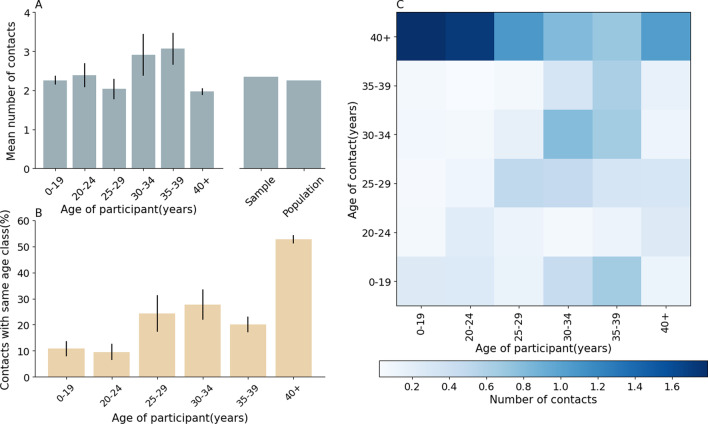
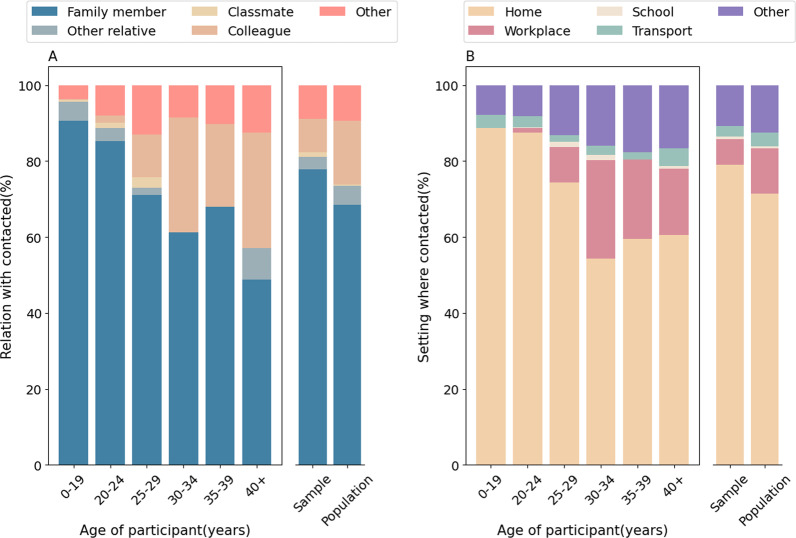
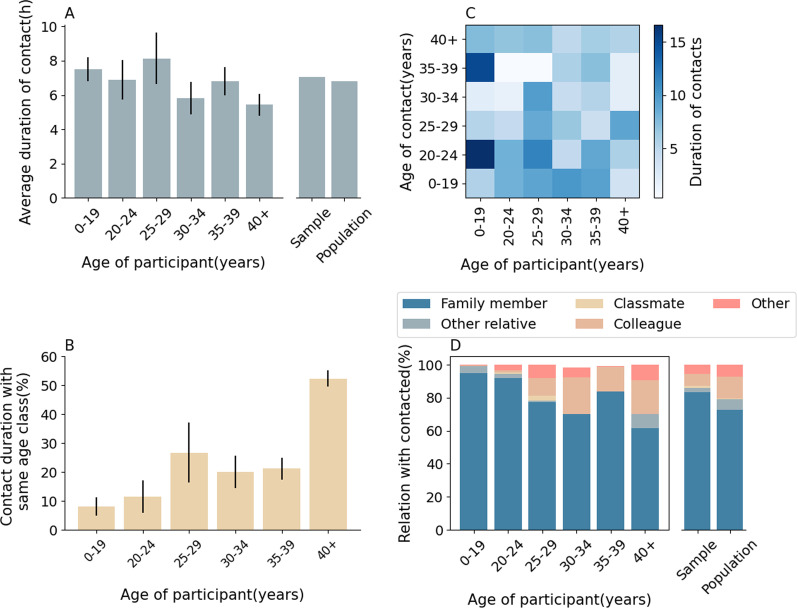
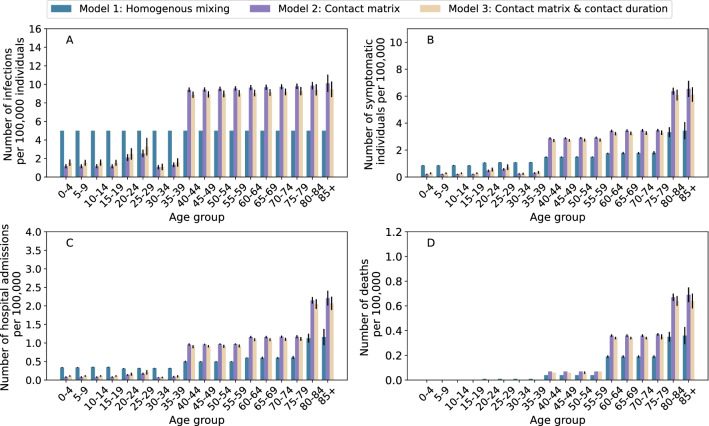
Methods and results: In this work, a contact survey was conducted in Chinese provinces outside Hubei in March 2020, right after lockdowns were lifted. We then leveraged the estimated mixing patterns to calibrate a mathematical model of SARS-CoV-2 transmission. Study participants reported 2.3 contacts per day (IQR: 1.0-3.0) and the mean per-contact duration was 7.0 h (IQR: 1.0-10.0). No significant differences in average contact number and contact duration were observed between provinces, the number of recorded contacts did not show a clear trend by age, and most of the recorded contacts occurred with family members (about 78%). The simulation study highlights the importance of considering age-specific contact patterns to estimate the COVID-19 burden.
Conclusions: Our findings suggest that, despite lockdowns were no longer in place at the time of the survey, people were still heavily limiting their contacts as compared to the pre-pandemic situation.
Keywords: Age; COVID-19; Contact patterns; Disease burden; Human behavior; Mathematical modeling.
© 2022. The Author(s).
Conflict of interest statement
M.A. has received research funding from Seqirus. The funding is not related to COVID-19. All other authors declare no competing interest.
Figures
Similar articles
-
Rapid Review of Social Contact Patterns During the COVID-19 Pandemic.Epidemiology. 2021 Nov 1;32(6):781-791. doi: 10.1097/EDE.0000000000001412. Epidemiology. 2021. PMID: 34392254 Free PMC article.
-
Social contact patterns during the early COVID-19 pandemic in Norway: insights from a panel study, April to September 2020.BMC Public Health. 2024 May 29;24(1):1438. doi: 10.1186/s12889-024-18853-8. BMC Public Health. 2024. PMID: 38811933 Free PMC article.
-
Investigating the relationship between interventions, contact patterns, and SARS-CoV-2 transmissibility.Epidemics. 2022 Sep;40:100601. doi: 10.1016/j.epidem.2022.100601. Epub 2022 Jun 17. Epidemics. 2022. PMID: 35772295 Free PMC article.
-
Social Contact Patterns and Age Mixing before and during COVID-19 Pandemic, Greece, January 2020-October 2021.Emerg Infect Dis. 2025 Jan;31(1):75-85. doi: 10.3201/eid3101.240737. Emerg Infect Dis. 2025. PMID: 39714284 Free PMC article.
-
Effect of national and local lockdowns on the control of COVID-19 pandemic: a rapid review.Epidemiol Prev. 2020 Sep-Dec;44(5-6 Suppl 2):60-68. doi: 10.19191/EP20.5-6.S2.104. Epidemiol Prev. 2020. PMID: 33412795 Review. English.
Cited by
-
Contact patterns between index patients and their close contacts and assessing risk for COVID-19 transmission during different exposure time windows: a large retrospective observational study of 450 770 close contacts in Shanghai.BMJ Public Health. 2024 Apr 16;2(1):e000154. doi: 10.1136/bmjph-2023-000154. eCollection 2024 Jun. BMJ Public Health. 2024. PMID: 40018114 Free PMC article.
-
Estimating Changes in Contact Patterns in China Over the First Year of the COVID-19 Pandemic: Implications for SARS-CoV-2 Spread - Four Cities, China, 2020.China CDC Wkly. 2023 Feb 3;5(5):113-119. doi: 10.46234/ccdcw2023.021. China CDC Wkly. 2023. PMID: 37006711 Free PMC article.
-
COVID-19 spreading patterns in family clusters reveal gender roles in China.J R Soc Interface. 2023 Dec;20(209):20230336. doi: 10.1098/rsif.2023.0336. Epub 2023 Dec 13. J R Soc Interface. 2023. PMID: 38086400 Free PMC article.
References
-
- Chinese Center for Disease Control and Prevention. Notice on the implementation of science-based and targeted measures in the prevention and control of novel coronavirus pneumonia. 2020. Available in Chinese at: http://www.chinacdc.cn/jkzt/crb/zl/szkb_11803/jszl_11815/202002/t2020022.... Accessed 25 Nov 2021.
-
- The State Council Information Office of the People's Republic of China. Fighting COVID-19: China in Action. 2020. Available in Chinese at: http://www.scio.gov.cn/ztk/dtzt/42313/43142/index.htm. Accessed 7 Jun 2022.
MeSH terms
Grants and funding
LinkOut - more resources
Full Text Sources
Medical
Miscellaneous
