

Digitizing ECG image: A new method and open-source software code
- PMID: 35598436
- PMCID: PMC9286778
- DOI: 10.1016/j.cmpb.2022.106890
Digitizing ECG image: A new method and open-source software code
Abstract
Background and objective: We aimed to develop and validate an open-source code ECG-digitizing tool and assess agreements of ECG measurements across three types of median beats, comprised of digitally recorded simultaneous and asynchronous ECG leads and digitized asynchronous ECG leads.
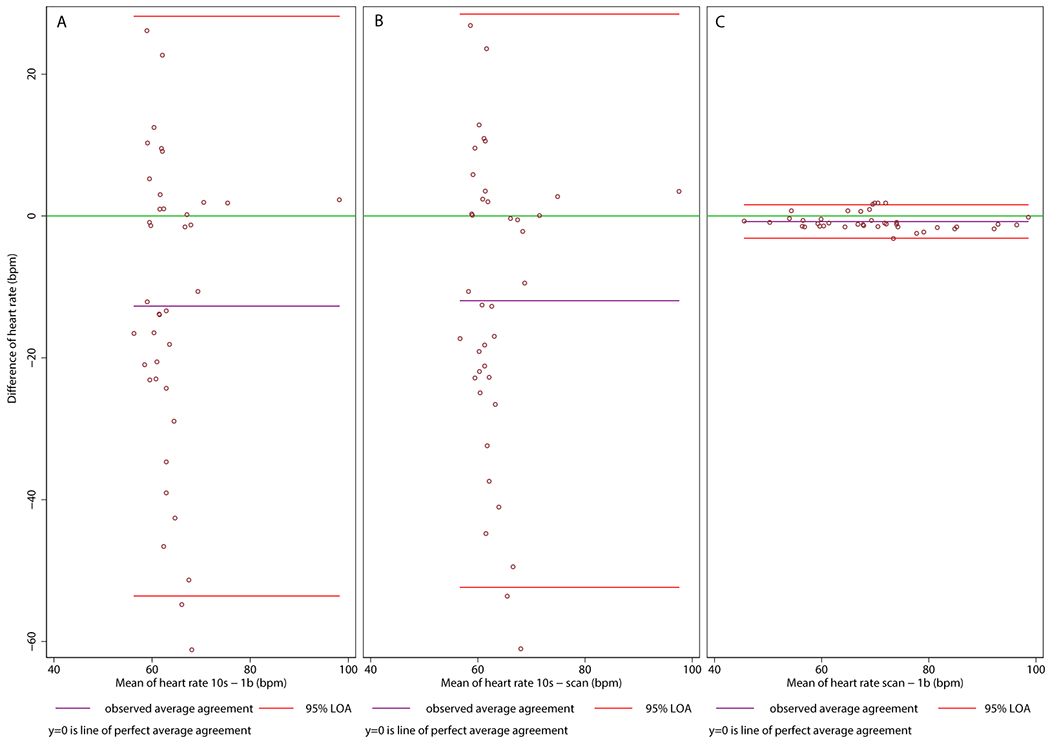
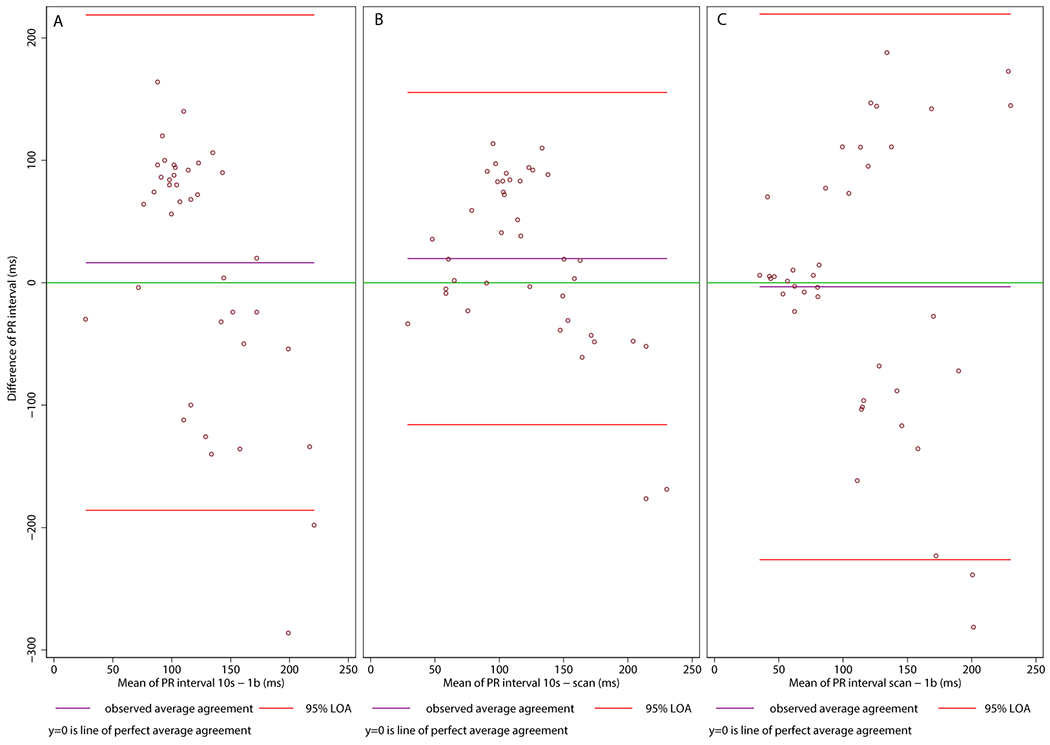
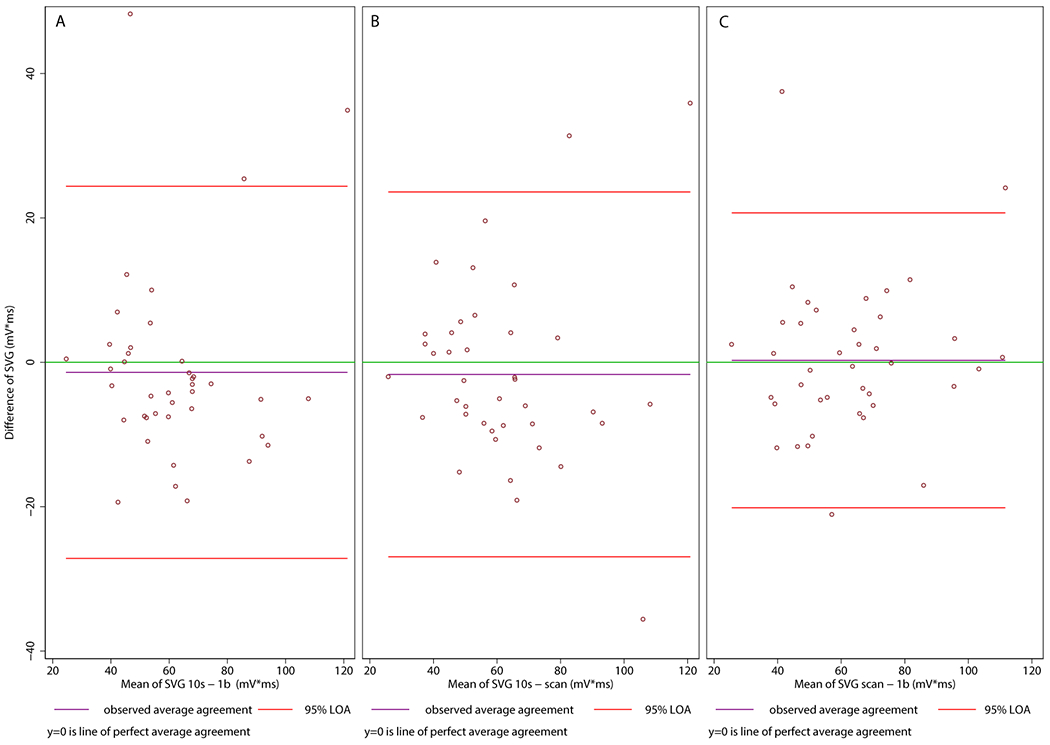
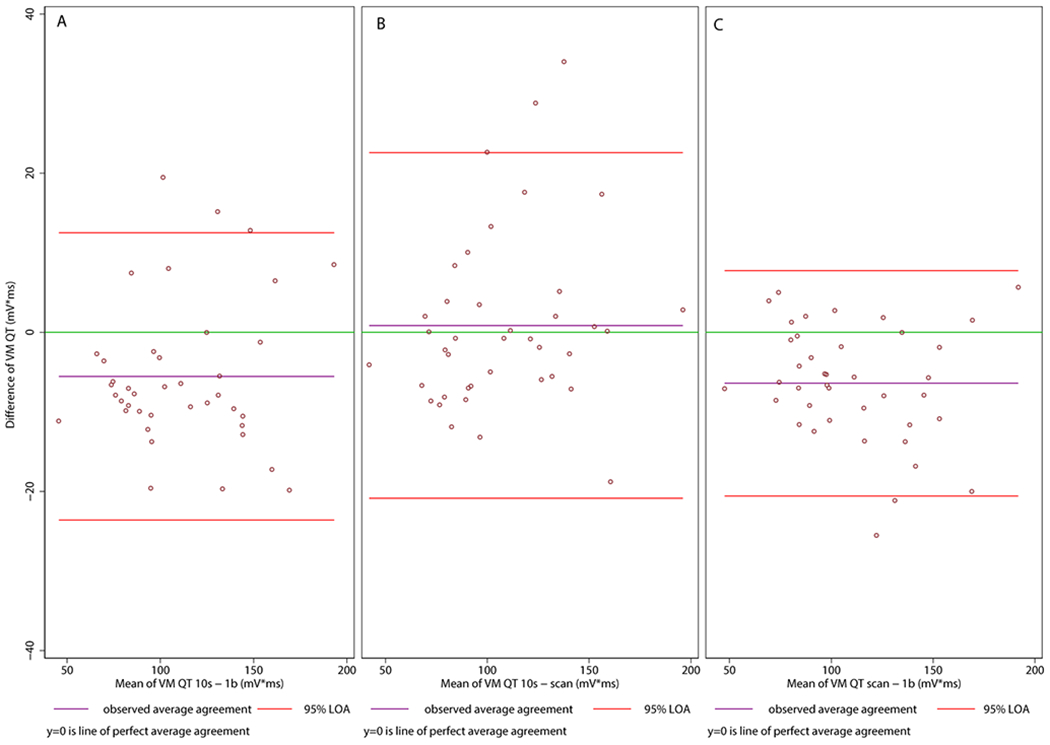
Methods: We used the data of clinical studies participants (n = 230; mean age 30±15 y; 25% female; 52% had the cardiovascular disease) with available both digitally recorded and printed on paper and then scanned ECGs, split into development (n = 150) and validation (n = 80) datasets. The agreement between ECG and VCG measurements on the digitally recorded time-coherent median beat, representative asynchronous digitized, and digitally recorded beats was assessed by Bland-Altman analysis.
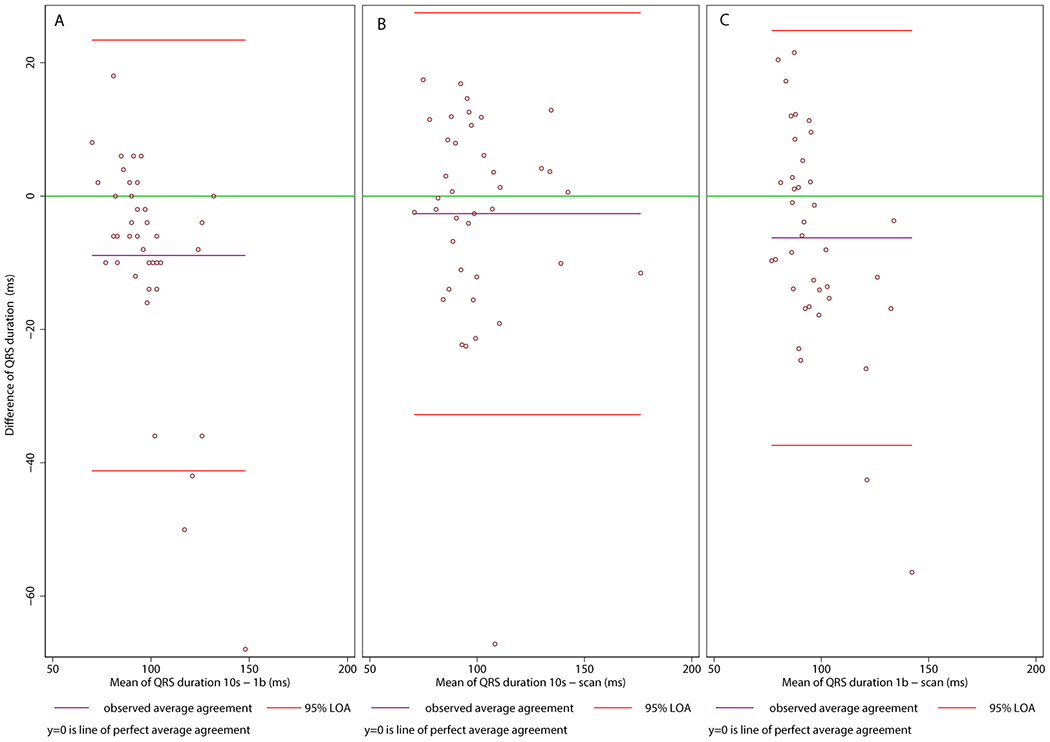
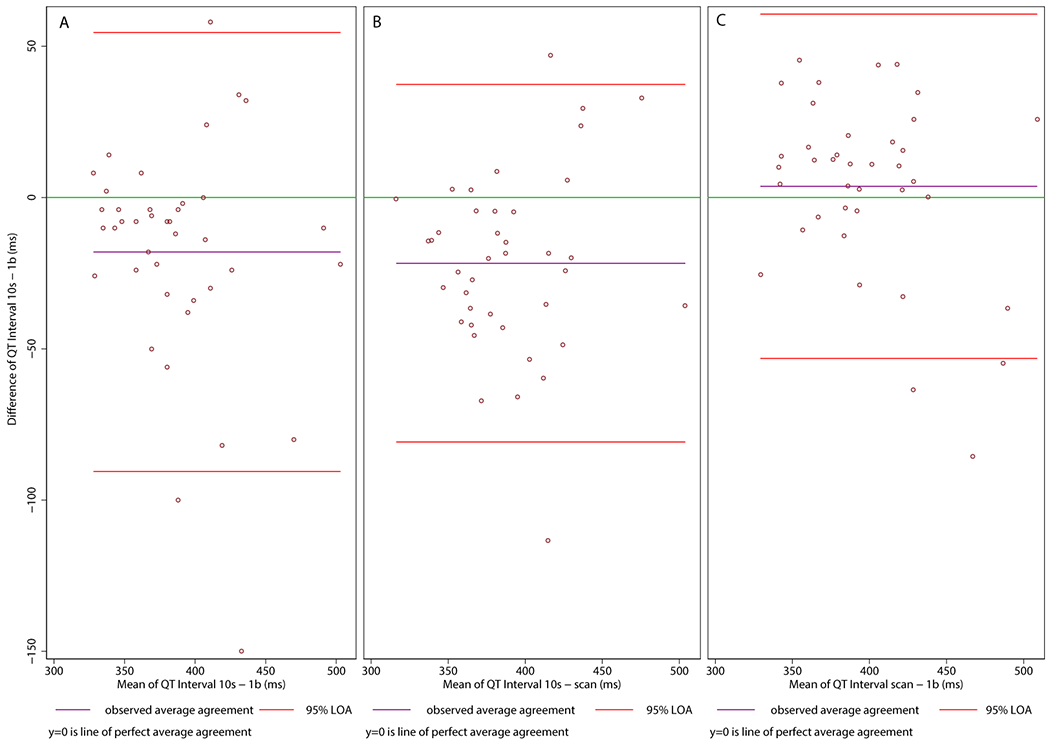
Results: The sample-per-sample comparison of digitally recorded and digitized signals showed a very high correlation (0.977), a small mean difference (9.3 µV), and root mean squared error (25.9 µV). Agreement between digitally recorded and digitized representative beat was high [area spatial ventricular gradient (SVG) elevation bias 2.5(95% limits of agreement [LOA] -7.9-13.0)°; precision 96.8%; inter-class correlation [ICC] 0.988; Lin's concordance coefficient ρc 0.97(95% confidence interval [CI] 0.95-0.98)]. Agreement between digitally recorded asynchronous and time-coherent median beats was moderate for area-based VCG metrics (spatial QRS-T angle bias 1.4(95%LOA -33.2-30.3)°; precision 94.8%; ICC 0.95; Lin's concordance coefficient ρc 0.90(95%CI 0.82-0.95)].
Conclusions: We developed and validated an open-source software tool for paper-ECG digitization. Asynchronous ECG leads are the primary source of disagreement in measurements on digitally recorded and digitized ECGs.
Keywords: Digitization; ECG; ECG paper digital conversion; Paper ECG digitizing; Paper-to-digital conversion.
Copyright © 2022 Elsevier B.V. All rights reserved.
Conflict of interest statement
Declaration of Competing Interest None declared.
Figures
References
-
- Kligfield P, Badilini F, Brown B, Helfenbein E, Kohls M, The ISCE ECG genome pilot challenge: A 2004 progress report, Journal of Electrocardiology, 37 (2004) 144–148. - PubMed
-
- Stockbridge N, Points to consider in electrocardiogram waveform extraction, Journal of Electrocardiology, 38 (2005) 319–320. - PubMed
-
- Badilini F, Erdem T, Zareba W, Moss AJ, ECGScan: a method for conversion of paper electrocardiographic printouts to digital electrocardiographic files, J Electrocardiol, 38 (2005) 310–318. - PubMed
-
- Tereshchenko LG, Sotoodehnia N, Sitlani CM, Ashar FN, Kabir M, Biggs ML, Morley MP, Waks JW, Soliman EZ, Buxton AE, Biering-Sorensen T, Solomon SD, Post WS, Cappola TP, Siscovick DS, Arking DE, Genome-Wide Associations of Global Electrical Heterogeneity ECG Phenotype: The ARIC (Atherosclerosis Risk in Communities) Study and CHS (Cardiovascular Health Study), J Am Heart Assoc, 7 (2018) e008160. - PMC - PubMed
MeSH terms
Grants and funding
LinkOut - more resources
Full Text Sources
Other Literature Sources
