

A multivariant recall-by-genotype study of the metabolomic signature of BMI
- PMID: 35598895
- PMCID: PMC9324973
- DOI: 10.1002/oby.23441
A multivariant recall-by-genotype study of the metabolomic signature of BMI
Erratum in
-
A multivariant recall-by-genotype study of the metabolomic signature of BMI.Obesity (Silver Spring). 2022 Oct;30(10):2089. doi: 10.1002/oby.23541. Epub 2022 Aug 4. Obesity (Silver Spring). 2022. PMID: 35927797 Free PMC article. No abstract available.
Abstract
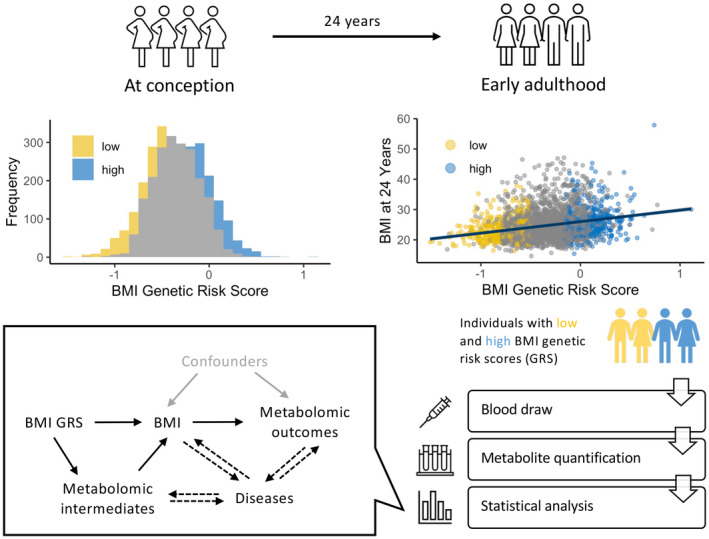
Objective: This study estimated the effect of BMI on circulating metabolites in young adults using a recall-by-genotype study design.
Methods: A recall-by-genotype study was implemented in the Avon Longitudinal Study of Parents and Children. Samples from 756 participants were selected for untargeted metabolomics analysis based on low versus high genetic liability for higher BMI defined by a genetic risk score (GRS). Regression analyses were performed to investigate associations between BMI GRS group and relative abundance of 973 metabolites.
Results: After correction for multiple testing, 29 metabolites were associated with BMI GRS group. Bilirubin was among the most strongly associated metabolites, with reduced levels measured in individuals in the high-BMI GRS group (β = -0.32, 95% CI: -0.46 to -0.18, Benjamini-Hochberg adjusted p = 0.005). This study observed associations between BMI GRS group and the levels of several potentially diet-related metabolites, including hippurate, which had lower mean abundance in individuals in the high-BMI GRS group (β = -0.29, 95% CI: -0.44 to -0.15, Benjamini-Hochberg adjusted p = 0.008).
Conclusions: Together with existing literature, these results suggest that a genetic predisposition to higher BMI captures differences in metabolism leading to adiposity gain. In the absence of prospective data, separating these effects from the downstream consequences of weight gain is challenging.
© 2022 The Authors. Obesity published by Wiley Periodicals LLC on behalf of The Obesity Society (TOS).
Conflict of interest statement
The authors declared no conflict of interest.
Figures


Similar articles
-
Associations between body mass index-related genetic variants and adult body composition: The Fenland cohort study.Int J Obes (Lond). 2017 Apr;41(4):613-619. doi: 10.1038/ijo.2017.11. Epub 2017 Jan 18. Int J Obes (Lond). 2017. PMID: 28096530 Free PMC article.
-
Parental and child genetic contributions to obesity traits in early life based on 83 loci validated in adults: the FAMILY study.Pediatr Obes. 2018 Mar;13(3):133-140. doi: 10.1111/ijpo.12205. Epub 2016 Dec 23. Pediatr Obes. 2018. PMID: 28008729
-
Associations of genetic risk score with obesity and related traits and the modifying effect of physical activity in a Chinese Han population.PLoS One. 2014 Mar 13;9(3):e91442. doi: 10.1371/journal.pone.0091442. eCollection 2014. PLoS One. 2014. PMID: 24626232 Free PMC article.
-
Association of a Genetic Risk Score With Body Mass Index Across Different Birth Cohorts.JAMA. 2016 Jul 5;316(1):63-9. doi: 10.1001/jama.2016.8729. JAMA. 2016. PMID: 27380344
-
Folic acid supplementation and malaria susceptibility and severity among people taking antifolate antimalarial drugs in endemic areas.Cochrane Database Syst Rev. 2022 Feb 1;2(2022):CD014217. doi: 10.1002/14651858.CD014217. Cochrane Database Syst Rev. 2022. PMID: 36321557 Free PMC article.
Cited by
-
The metabolomic profiling of total fat and fat distribution in a multi-cohort study of women and men.Sci Rep. 2023 Jul 10;13(1):11129. doi: 10.1038/s41598-023-38318-z. Sci Rep. 2023. PMID: 37429905 Free PMC article.
-
A multivariant recall-by-genotype study of the metabolomic signature of BMI.Obesity (Silver Spring). 2022 Oct;30(10):2089. doi: 10.1002/oby.23541. Epub 2022 Aug 4. Obesity (Silver Spring). 2022. PMID: 35927797 Free PMC article. No abstract available.
-
Targeted metabolomics-based understanding of the sleep disturbances in drug-naïve patients with schizophrenia.BMC Psychiatry. 2024 May 13;24(1):355. doi: 10.1186/s12888-024-05805-0. BMC Psychiatry. 2024. PMID: 38741058 Free PMC article.
-
Variant-to-function approaches for adipose tissue: Insights into cardiometabolic disorders.Cell Genom. 2025 May 14;5(5):100844. doi: 10.1016/j.xgen.2025.100844. Epub 2025 Apr 3. Cell Genom. 2025. PMID: 40185091 Free PMC article. Review.
-
Metabolic liability for weight gain in early adulthood.Cell Rep Med. 2024 May 21;5(5):101548. doi: 10.1016/j.xcrm.2024.101548. Epub 2024 May 3. Cell Rep Med. 2024. PMID: 38703763 Free PMC article.
References
-
- Gómez‐Ambrosi J, Silva C, Galofré JC, et al. Body adiposity and type 2 diabetes: increased risk with a high body fat percentage even having a normal BMI. Obesity (Silver Spring). 2011;19:1439‐1444. - PubMed
-
- Ortega Francisco B, Lavie Carl J, Blair SN. Obesity and cardiovascular disease. Circ Res. 2016;118:1752‐1770. - PubMed
-
- Avgerinos KI, Spyrou N, Mantzoros CS, Dalamaga M. Obesity and cancer risk: emerging biological mechanisms and perspectives. Metabolism 2019;92:121‐135. - PubMed
-
- Davey Smith G, Ebrahim S. “Mendelian randomization”: can genetic epidemiology contribute to understanding environmental determinants of disease? Int J Epidemiol. 2003;32:1‐22. - PubMed
Publication types
MeSH terms
Grants and funding
LinkOut - more resources
Full Text Sources
