

Emergence of protective behaviour under different risk perceptions to disease spreading
- PMID: 35599564
- PMCID: PMC9125227
- DOI: 10.1098/rsta.2020.0412
Emergence of protective behaviour under different risk perceptions to disease spreading
Abstract
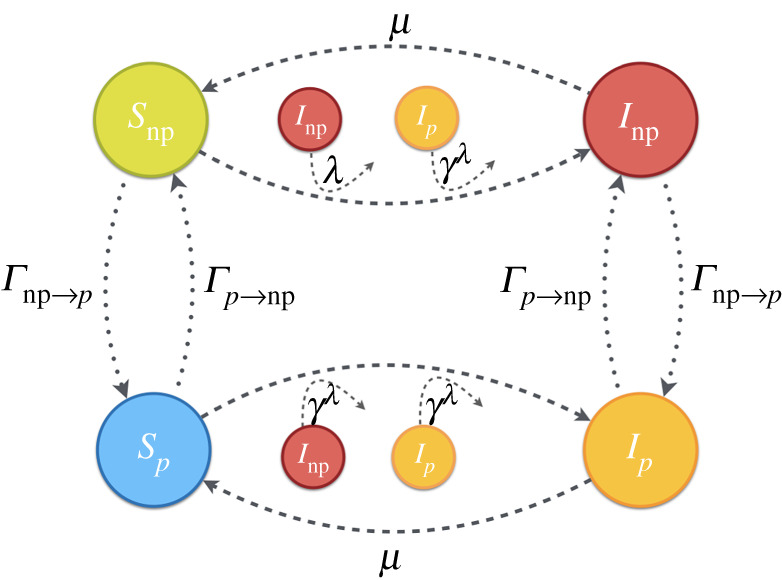
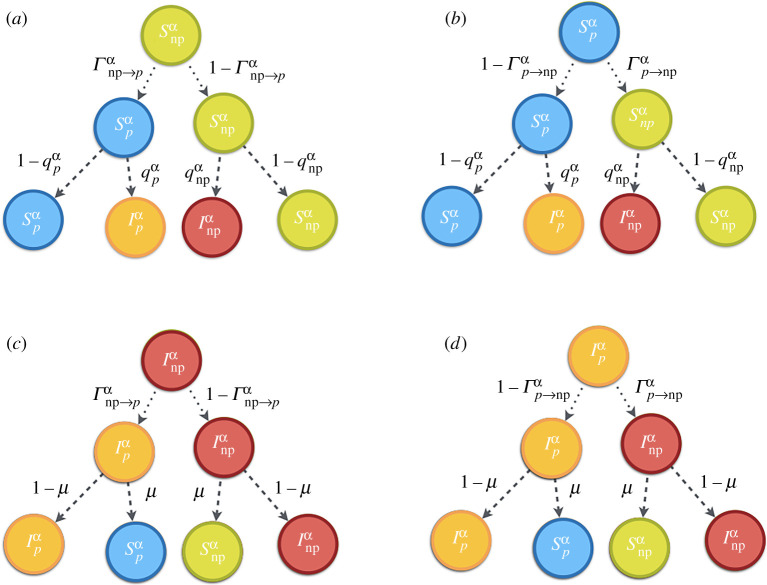
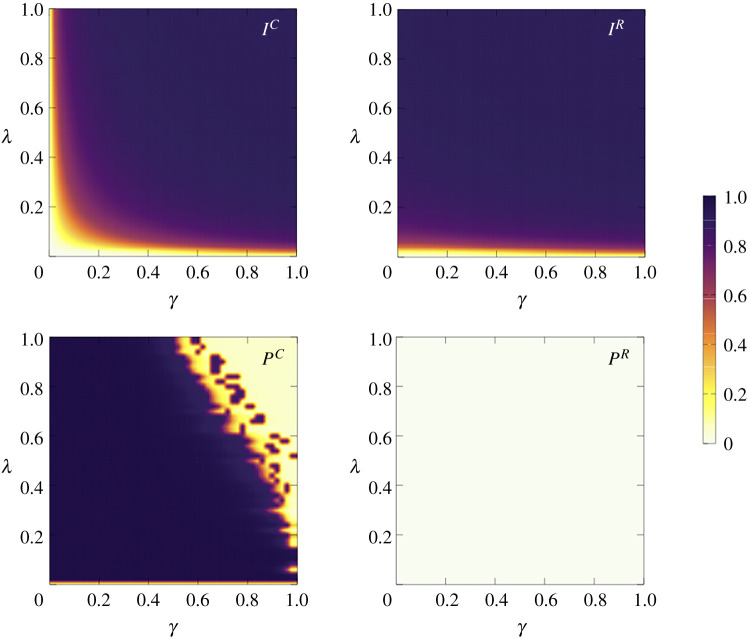
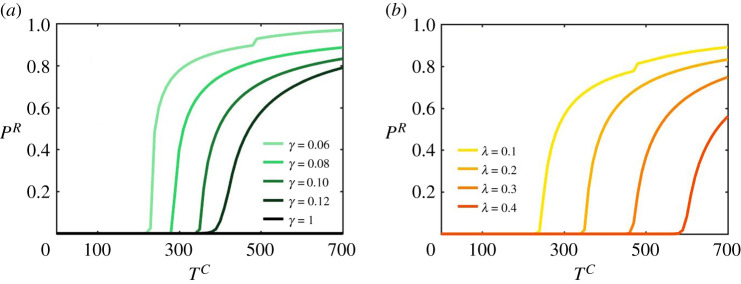
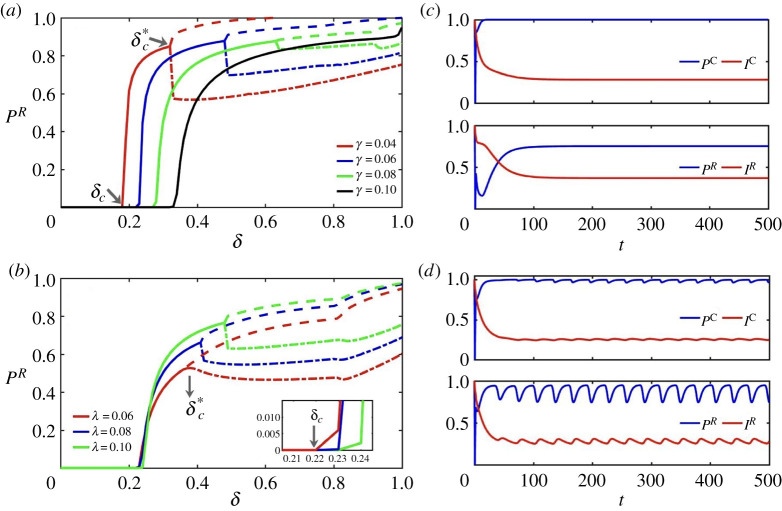
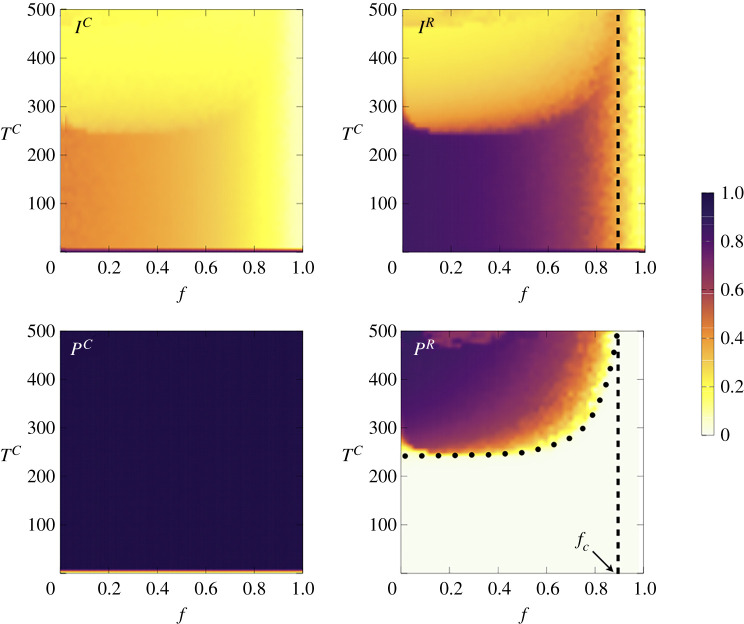
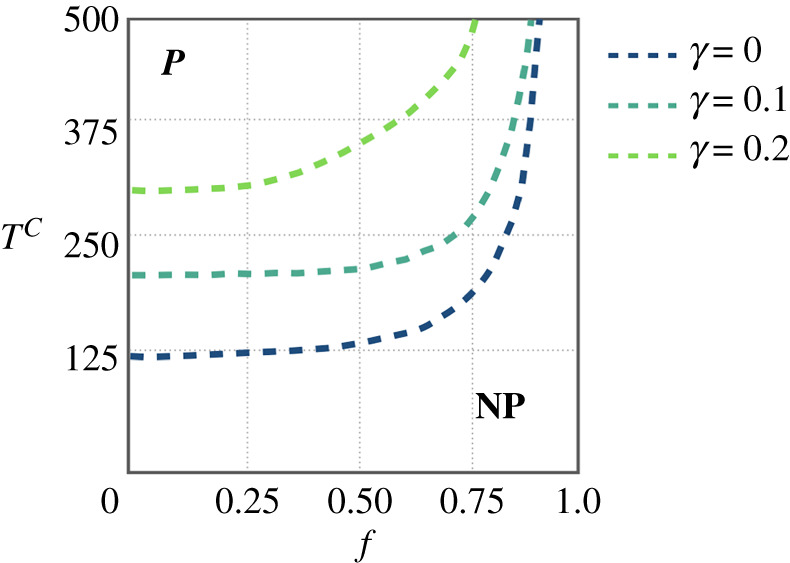
The behaviour of individuals is a main actor in the control of the spread of a communicable disease and, in turn, the spread of an infectious disease can trigger behavioural changes in a population. Here, we study the emergence of individuals' protective behaviours in response to the spread of a disease by considering two different social attitudes within the same population: concerned and risky. Generally speaking, concerned individuals have a larger risk aversion than risky individuals. To study the emergence of protective behaviours, we couple, to the epidemic evolution of a susceptible-infected-susceptible model, a decision game based on the perceived risk of infection. Using this framework, we find the effect of the protection strategy on the epidemic threshold for each of the two subpopulations (concerned and risky), and study under which conditions risky individuals are persuaded to protect themselves or, on the contrary, can take advantage of a herd immunity by remaining healthy without protecting themselves, thanks to the shield provided by concerned individuals. This article is part of the theme issue 'Emergent phenomena in complex physical and socio-technical systems: from cells to societies'.
Keywords: COVID-19; disease spreading; emergence; human behaviour.
Conflict of interest statement
We declare we have no competing interests.
Figures
Similar articles
-
From the origin of life to pandemics: emergent phenomena in complex systems.Philos Trans A Math Phys Eng Sci. 2022 Jul 11;380(2227):20200410. doi: 10.1098/rsta.2020.0410. Epub 2022 May 23. Philos Trans A Math Phys Eng Sci. 2022. PMID: 35599559 Free PMC article.
-
Human prophylaxis-driven cooperative spreading between information and epidemics in duplex networks.Chaos. 2025 Mar 1;35(3):033152. doi: 10.1063/5.0254726. Chaos. 2025. PMID: 40126897
-
Disease dynamics in a stochastic network game: a little empathy goes a long way in averting outbreaks.Sci Rep. 2017 Mar 14;7:44122. doi: 10.1038/srep44122. Sci Rep. 2017. PMID: 28290504 Free PMC article.
-
Greater than the parts: a review of the information decomposition approach to causal emergence.Philos Trans A Math Phys Eng Sci. 2022 Jul 11;380(2227):20210246. doi: 10.1098/rsta.2021.0246. Epub 2022 May 23. Philos Trans A Math Phys Eng Sci. 2022. PMID: 35599558 Free PMC article. Review.
-
Infection prevention behaviour and infectious disease modelling: a review of the literature and recommendations for the future.BMC Public Health. 2018 Mar 9;18(1):336. doi: 10.1186/s12889-018-5223-1. BMC Public Health. 2018. PMID: 29523125 Free PMC article. Review.
Cited by
-
From the origin of life to pandemics: emergent phenomena in complex systems.Philos Trans A Math Phys Eng Sci. 2022 Jul 11;380(2227):20200410. doi: 10.1098/rsta.2020.0410. Epub 2022 May 23. Philos Trans A Math Phys Eng Sci. 2022. PMID: 35599559 Free PMC article.
References
-
- Anderson R, May R. 1992. Infectious diseases of humans. Dynamics and control. Oxford, UK: Oxford University Press.
-
- Hethcote HW. 2000. The mathematics of infectious diseases. SIAM Rev. 42, 599-653. (10.1137/S0036144500371907) - DOI
-
- Keeling M, Rohani P. 2007. Modeling infectious diseases in humans and animals. Princeton, NJ: Princeton University Press.
MeSH terms
LinkOut - more resources
Full Text Sources
