

Age-related topographic map of magnetic resonance diffusion metrics in neonatal brains
- PMID: 35599634
- PMCID: PMC9435001
- DOI: 10.1002/hbm.25956
Age-related topographic map of magnetic resonance diffusion metrics in neonatal brains
Abstract
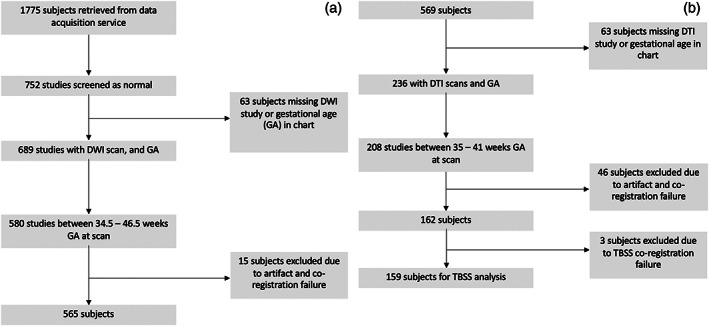
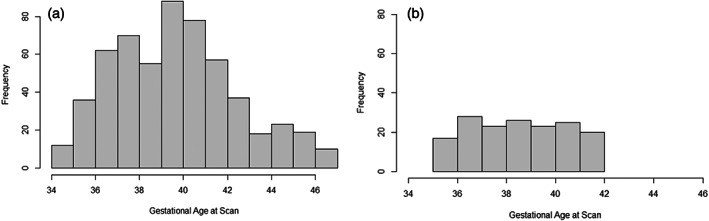
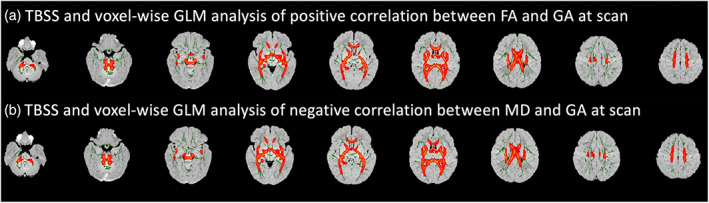
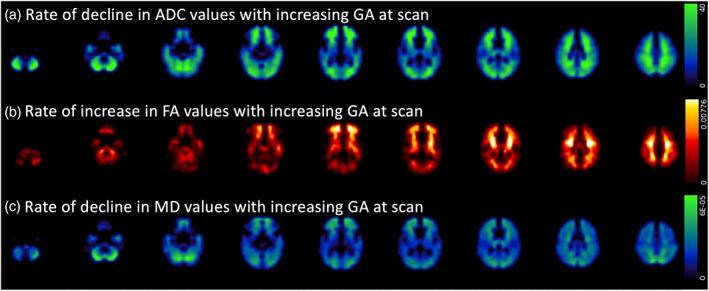
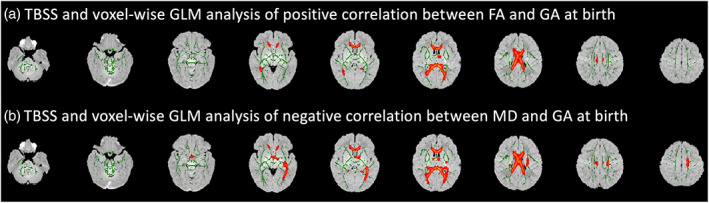
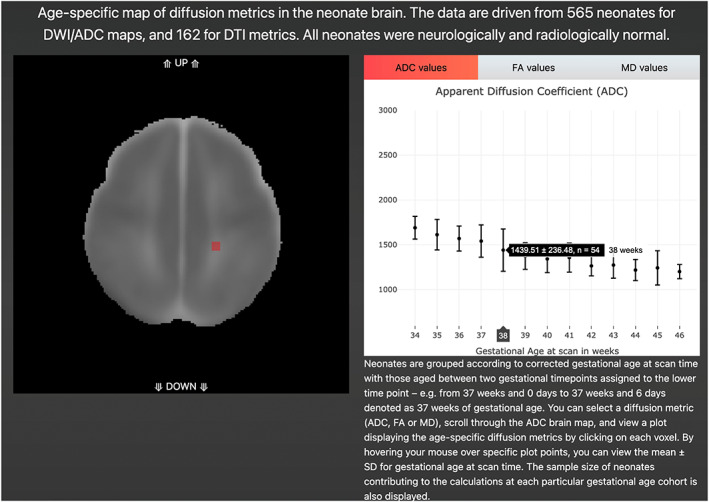
Accelerated maturation of brain parenchyma close to term-equivalent age leads to rapid changes in diffusion-weighted imaging (DWI) and diffusion tensor imaging (DTI) metrics of neonatal brains, which can complicate the evaluation and interpretation of these scans. In this study, we characterized the topography of age-related evolution of diffusion metrics in neonatal brains. We included 565 neonates who had MRI between 0 and 3 months of age, with no structural or signal abnormality-including 162 who had DTI scans. We analyzed the age-related changes of apparent diffusion coefficient (ADC) values throughout brain and DTI metrics (fractional anisotropy [FA] and mean diffusivity [MD]) along white matter (WM) tracts. Rate of change in ADC, FA, and MD values across 5 mm cubic voxels was calculated. There was significant reduction of ADC and MD values and increase of FA with increasing gestational age (GA) throughout neonates' brain, with the highest temporal rates in subcortical WM, corticospinal tract, cerebellar WM, and vermis. GA at birth had significant effect on ADC values in convexity cortex and corpus callosum as well as FA/MD values in corpus callosum, after correcting for GA at scan. We developed online interactive atlases depicting age-specific normative values of ADC (ages 34-46 weeks), and FA/MD (35-41 weeks). Our results show a rapid decrease in diffusivity metrics of cerebral/cerebellar WM and vermis in the first few weeks of neonatal age, likely attributable to myelination. In addition, prematurity and low GA at birth may result in lasting delay in corpus callosum myelination and cerebral cortex cellularity.
Keywords: diffusion tensor imaging; diffusion-weighted imaging; magnetic resonance imaging; neonates.
© 2022 The Authors. Human Brain Mapping published by Wiley Periodicals LLC.
Conflict of interest statement
The authors declare no conflicts of interest.
Figures
Similar articles
-
Brain microstructural development at near-term age in very-low-birth-weight preterm infants: an atlas-based diffusion imaging study.Neuroimage. 2014 Feb 1;86:244-56. doi: 10.1016/j.neuroimage.2013.09.053. Epub 2013 Oct 1. Neuroimage. 2014. PMID: 24091089 Free PMC article.
-
The effects of mild germinal matrix-intraventricular haemorrhage on the developmental white matter microstructure of preterm neonates: a DTI study.Eur Radiol. 2018 Mar;28(3):1157-1166. doi: 10.1007/s00330-017-5060-0. Epub 2017 Sep 27. Eur Radiol. 2018. PMID: 28956133
-
Neonatal physiological correlates of near-term brain development on MRI and DTI in very-low-birth-weight preterm infants.Neuroimage Clin. 2014 Jun 2;5:169-77. doi: 10.1016/j.nicl.2014.05.013. eCollection 2014. Neuroimage Clin. 2014. PMID: 25068107 Free PMC article.
-
The role of diffusion tensor imaging and fractional anisotropy in the evaluation of patients with idiopathic normal pressure hydrocephalus: a literature review.Neurosurg Focus. 2016 Sep;41(3):E12. doi: 10.3171/2016.6.FOCUS16192. Neurosurg Focus. 2016. PMID: 27581308 Review.
-
The role of diffusion tensor imaging in the evaluation of ischemic brain injury - a review.NMR Biomed. 2002 Nov-Dec;15(7-8):561-9. doi: 10.1002/nbm.786. NMR Biomed. 2002. PMID: 12489102 Review.
Cited by
-
Skin-to-skin holding in relation to white matter connectivity in infants born preterm.medRxiv [Preprint]. 2025 Mar 23:2025.03.21.25324424. doi: 10.1101/2025.03.21.25324424. medRxiv. 2025. PMID: 40166583 Free PMC article. Preprint.
-
Neurocognitive Dysfunction After Treatment for Pediatric Brain Tumors: Subtype-Specific Findings and Proposal for Brain Network-Informed Evaluations.Neurosci Bull. 2023 Dec;39(12):1873-1886. doi: 10.1007/s12264-023-01096-9. Epub 2023 Aug 24. Neurosci Bull. 2023. PMID: 37615933 Free PMC article. Review.
-
Development of Myelin Growth Charts of the White Matter Using T1 Relaxometry.AJNR Am J Neuroradiol. 2024 Sep 9;45(9):1335-1345. doi: 10.3174/ajnr.A8306. AJNR Am J Neuroradiol. 2024. PMID: 39025639
-
Early brain microstructural development among preterm infants requiring caesarean section versus those delivered vaginally.Sci Rep. 2023 Dec 6;13(1):21514. doi: 10.1038/s41598-023-48963-z. Sci Rep. 2023. PMID: 38057452 Free PMC article.
-
Diagnostic MR imaging features of hypomyelination of early myelinating structures: A case report.Neuroradiol J. 2024 Dec;37(6):758-760. doi: 10.1177/19714009231224419. Epub 2023 Dec 25. Neuroradiol J. 2024. PMID: 38146229
References
-
- Barkovich, A. J. , Miller, S. , Bartha, A. , Newton, N. , Hamrick, S. , Mukherjee, P. , Glenn, O. , Xu, D. , Partridge, J. , & Ferriero, D. (2006). MR imaging, MR spectroscopy, and diffusion tensor imaging of sequential studies in neonates with encephalopathy. American Journal of Neuroradiology, 27(3), 533–547. - PMC - PubMed
-
- Belli, G. , Busoni, S. , Ciccarone, A. , Coniglio, A. , Esposito, M. , Giannelli, M. , Mazzoni, L. N. , Nocetti, L. , Sghedoni, R. , & Tarducci, R. (2016). Quality assurance multicenter comparison of different MR scanners for quantitative diffusion‐weighted imaging. Journal of Magnetic Resonance Imaging, 43(1), 213–219. - PubMed
-
- Brissaud, O. , Amirault, M. , Villega, F. , Periot, O. , Chateil, J. , & Allard, M. (2010). Efficiency of fractional anisotropy and apparent diffusion coefficient on diffusion tensor imaging in prognosis of neonates with hypoxic‐ischemic encephalopathy: A methodologic prospective pilot study. American Journal of Neuroradiology, 31(2), 282–287. - PMC - PubMed
-
- Cauley, K. A. , & Filippi, C. G. (2014). Apparent diffusion coefficient histogram analysis of neonatal hypoxic‐ischemic encephalopathy. Pediatric Radiology, 44(6), 738–746. - PubMed
Publication types
MeSH terms
Grants and funding
LinkOut - more resources
Full Text Sources
