

Investigation of functional near-infrared spectroscopy signal quality and development of the hemodynamic phase correlation signal
- PMID: 35599691
- PMCID: PMC9116886
- DOI: 10.1117/1.NPh.9.2.025001
Investigation of functional near-infrared spectroscopy signal quality and development of the hemodynamic phase correlation signal
Abstract
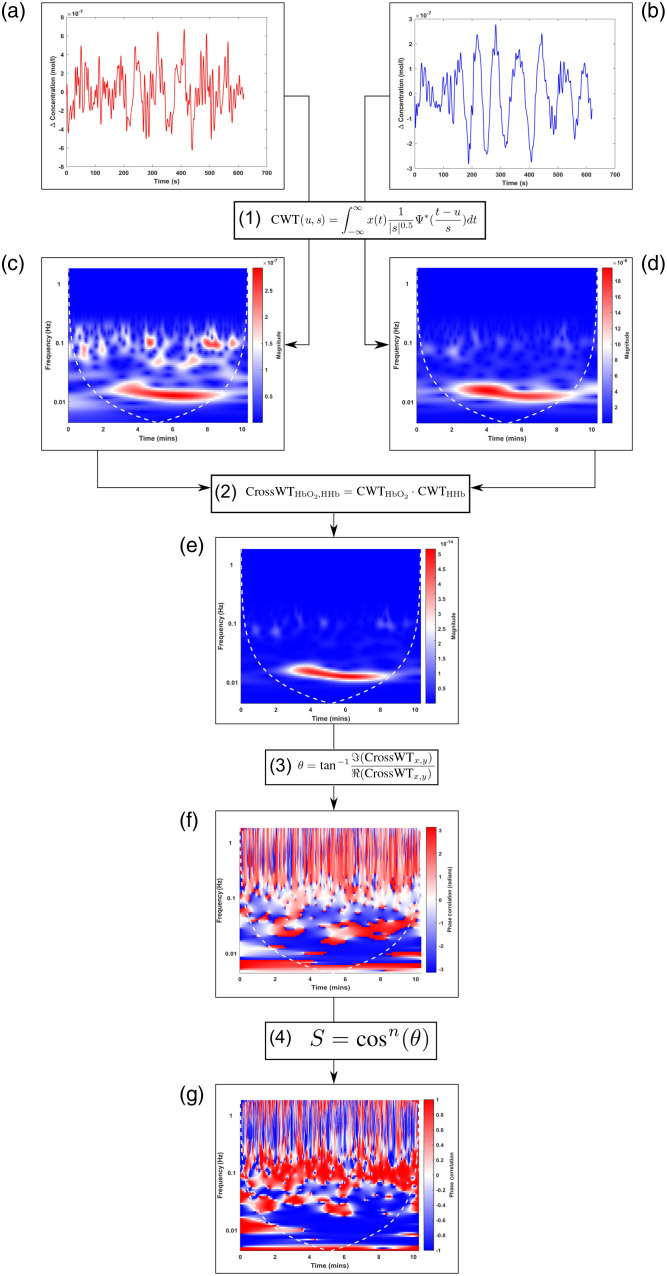
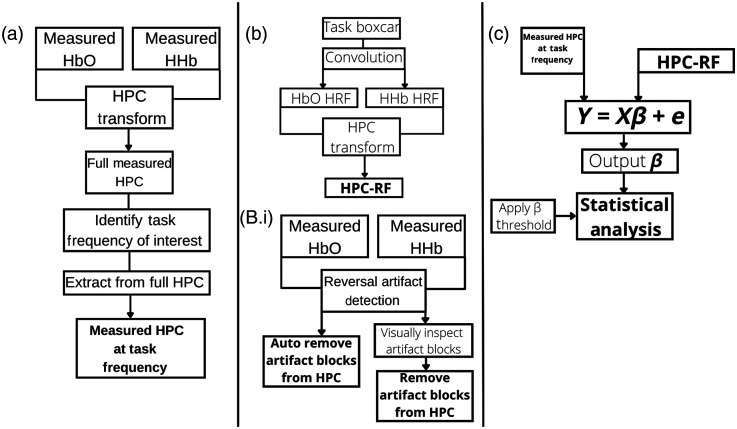
Significance: There is a longstanding recommendation within the field of fNIRS to use oxygenated ( ) and deoxygenated (HHb) hemoglobin when analyzing and interpreting results. Despite this, many fNIRS studies do focus on only. Previous work has shown that on its own is susceptible to systemic interference and results may mostly reflect that rather than functional activation. Studies using both and HHb to draw their conclusions do so with varying methods and can lead to discrepancies between studies. The combination of and HHb has been recommended as a method to utilize both signals in analysis. Aim: We present the development of the hemodynamic phase correlation (HPC) signal to combine and HHb as recommended to utilize both signals in the analysis. We use synthetic and experimental data to evaluate how the HPC and current signals used for fNIRS analysis compare. Approach: About 18 synthetic datasets were formed using resting-state fNIRS data acquired from 16 channels over the frontal lobe. To simulate fNIRS data for a block-design task, we superimposed a synthetic task-related hemodynamic response to the resting state data. This data was used to develop an HPC-general linear model (GLM) framework. Experiments were conducted to investigate the performance of each signal at different SNR and to investigate the effect of false positives on the data. Performance was based on each signal's mean -value across channels. Experimental data recorded from 128 participants across 134 channels during a finger-tapping task were used to investigate the performance of multiple signals [ , HHb, HbT, HbD, correlation-based signal improvement (CBSI), and HPC] on real data. Signal performance was evaluated on its ability to localize activation to a specific region of interest. Results: Results from varying the SNR show that the HPC signal has the highest performance for high SNRs. The CBSI performed the best for medium-low SNR. The next analysis evaluated how false positives affect the signals. The analyses evaluating the effect of false positives showed that the HPC and CBSI signals reflect the effect of false positives on and HHb. The analysis of real experimental data revealed that the HPC and HHb signals provide localization to the primary motor cortex with the highest accuracy. Conclusions: We developed a new hemodynamic signal (HPC) with the potential to overcome the current limitations of using and HHb separately. Our results suggest that the HPC signal provides comparable accuracy to HHb to localize functional activation while at the same time being more robust against false positives.
Keywords: functional near-infrared spectroscopy; hemodynamic response; neuroscience.
© 2022 The Authors.
Figures


Similar articles
-
FNIRS activity in the prefrontal cortex and motivational intensity: impact of working memory load, financial reward, and correlation-based signal improvement.Neurophotonics. 2018 Jul;5(3):035001. doi: 10.1117/1.NPh.5.3.035001. Epub 2018 Jul 12. Neurophotonics. 2018. PMID: 30035151 Free PMC article.
-
Investigation of the Pattern of the Hemodynamic Response as Measured by Functional Near-Infrared Spectroscopy (fNIRS) Studies in Newborns, Less Than a Month Old: A Systematic Review.Front Hum Neurosci. 2018 Oct 2;12:371. doi: 10.3389/fnhum.2018.00371. eCollection 2018. Front Hum Neurosci. 2018. PMID: 30333736 Free PMC article.
-
The Temporal Confounding Effects of Extra-cerebral Contamination Factors on the Hemodynamic Signal Measured by Functional Near-Infrared Spectroscopy.J Lasers Med Sci. 2019 Fall;10(Suppl 1):S73-S81. doi: 10.15171/jlms.2019.S14. Epub 2019 Dec 1. J Lasers Med Sci. 2019. PMID: 32021678 Free PMC article.
-
Systematic review of fNIRS studies reveals inconsistent chromophore data reporting practices.Neurophotonics. 2022 Oct;9(4):040601. doi: 10.1117/1.NPh.9.4.040601. Epub 2022 Dec 23. Neurophotonics. 2022. PMID: 36578778 Free PMC article. Review.
-
Cortical Signal Analysis and Advances in Functional Near-Infrared Spectroscopy Signal: A Review.Front Hum Neurosci. 2016 Jun 9;10:261. doi: 10.3389/fnhum.2016.00261. eCollection 2016. Front Hum Neurosci. 2016. PMID: 27375458 Free PMC article. Review.
Cited by
-
Optimizing spatial specificity and signal quality in fNIRS: an overview of potential challenges and possible options for improving the reliability of real-time applications.Front Neuroergon. 2024 Jun 5;5:1286586. doi: 10.3389/fnrgo.2024.1286586. eCollection 2024. Front Neuroergon. 2024. PMID: 38903906 Free PMC article. Review.
-
Using functional near-infrared spectroscopy to measure prefrontal cortex activity during dual-task walking and navigated walking: A feasibility study.Brain Behav. 2023 Apr;13(4):e2948. doi: 10.1002/brb3.2948. Epub 2023 Mar 14. Brain Behav. 2023. PMID: 36917560 Free PMC article.
-
Using cross-correlation analysis of multi-channel near infrared spectroscopy to assess the hemodynamic response to cupping therapy.Biomed Opt Express. 2023 Aug 3;14(9):4455-4467. doi: 10.1364/BOE.493897. eCollection 2023 Sep 1. Biomed Opt Express. 2023. PMID: 37791272 Free PMC article.
-
From lab to life: challenges and perspectives of fNIRS for haemodynamic-based neurofeedback in real-world environments.Philos Trans R Soc Lond B Biol Sci. 2024 Dec 2;379(1915):20230087. doi: 10.1098/rstb.2023.0087. Epub 2024 Oct 21. Philos Trans R Soc Lond B Biol Sci. 2024. PMID: 39428887 Free PMC article. Review.
