FAR1/FHY3 Transcription Factors Positively Regulate the Salt and Temperature Stress Responses in Eucalyptus grandis
- PMID: 35599891
- PMCID: PMC9115564
- DOI: 10.3389/fpls.2022.883654
FAR1/FHY3 Transcription Factors Positively Regulate the Salt and Temperature Stress Responses in Eucalyptus grandis
Abstract
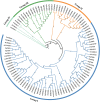
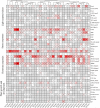
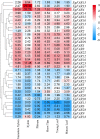
FAR-RED ELONGATED HYPOCOTYLS3 (FHY3) and its homolog FAR-RED IMPAIRED RESPONSE1 (FAR1), which play pivotal roles in plant growth and development, are essential for the photo-induced phyA nuclear accumulation and subsequent photoreaction. The FAR1/FHY3 family has been systematically characterized in some plants, but not in Eucalyptus grandis. In this study, genome-wide identification of FAR1/FHY3 genes in E. grandis was performed using bioinformatic methods. The gene structures, chromosomal locations, the encoded protein characteristics, 3D models, phylogenetic relationships, and promoter cis-elements were analyzed with this gene family. A total of 33 FAR1/FHY3 genes were identified in E. grandis, which were divided into three groups based on their phylogenetic relationships. A total of 21 pairs of duplicated repeats were identified by homology analysis. Gene expression analysis showed that most FAR1/FHY3 genes were differentially expressed in a spatial-specific manner. Gene expression analysis also showed that FAR1/FHY3 genes responded to salt and temperature stresses. These results and observation will enhance our understanding of the evolution and function of the FAR1/FHY3 genes in E. grandis and facilitate further studies on the molecular mechanism of the FAR1/FHY3 gene family in growth and development regulations, especially in response to salt and temperature.
Keywords: Eucalyptus grandis; FAR1/FHY3; salt stress; temperature stress; transcription factors.
Copyright © 2022 Dai, Sun, Peng, Liao, Zhou, Zhou, Qin, Cheng and Cao.
Conflict of interest statement
The authors declare that the research was conducted in the absence of any commercial or financial relationships that could be construed as a potential conflict of interest.
Figures


Similar articles
-
Arabidopsis thaliana FAR-RED ELONGATED HYPOCOTYLS3 (FHY3) and FAR-RED-IMPAIRED RESPONSE1 (FAR1) modulate starch synthesis in response to light and sugar.New Phytol. 2017 Mar;213(4):1682-1696. doi: 10.1111/nph.14300. Epub 2016 Nov 15. New Phytol. 2017. PMID: 27859295
-
Genome-wide identification and molecular expression profile analysis of FHY3/FAR1 gene family in walnut (Juglans sigillata L.) development.BMC Genomics. 2023 Nov 8;24(1):673. doi: 10.1186/s12864-023-09629-2. BMC Genomics. 2023. PMID: 37940838 Free PMC article.
-
Arabidopsis FHY3 and FAR1 Regulate Light-Induced myo-Inositol Biosynthesis and Oxidative Stress Responses by Transcriptional Activation of MIPS1.Mol Plant. 2016 Apr 4;9(4):541-57. doi: 10.1016/j.molp.2015.12.013. Epub 2015 Dec 20. Mol Plant. 2016. PMID: 26714049
-
Emerging Roles of FHY3 and FAR1 as System Integrators in Plant Development.Plant Cell Physiol. 2023 Oct 16;64(10):1139-1145. doi: 10.1093/pcp/pcad068. Plant Cell Physiol. 2023. PMID: 37384577 Review.
-
A critical review of the importance of Far-Related Sequence (FRS)- FRS-Related Factor (FRF) transcription factors in plants.Plant Sci. 2025 Apr;353:112410. doi: 10.1016/j.plantsci.2025.112410. Epub 2025 Feb 1. Plant Sci. 2025. PMID: 39900189 Review.
Cited by
-
Genome-Wide Identification and Functional Characterization of FAR1-RELATED SEQUENCE (FRS) Family Members in Potato (Solanum tuberosum).Plants (Basel). 2023 Jul 7;12(13):2575. doi: 10.3390/plants12132575. Plants (Basel). 2023. PMID: 37447143 Free PMC article.
-
QTL mapping and underlying genes for heat tolerance in grapevine (Rhine Riesling × Cabernet Sauvignon) under field conditions.Theor Appl Genet. 2025 Jul 21;138(8):189. doi: 10.1007/s00122-025-04972-2. Theor Appl Genet. 2025. PMID: 40691321 Free PMC article.
-
The genome of Haberlea rhodopensis provides insights into the mechanisms for tolerance to multiple extreme environments.Cell Mol Life Sci. 2024 Mar 5;81(1):117. doi: 10.1007/s00018-024-05140-3. Cell Mol Life Sci. 2024. PMID: 38443747 Free PMC article.
-
Pan-transcriptomic Profiling Demarcates Serendipita Indica-Phosphorus Mediated Tolerance Mechanisms in Rice Exposed to Arsenic Toxicity.Rice (N Y). 2023 Jun 24;16(1):28. doi: 10.1186/s12284-023-00645-0. Rice (N Y). 2023. PMID: 37354226 Free PMC article.
-
Molecular characteristics and expression pattern of the FAR1 gene during spike sprouting in quinoa.Sci Rep. 2024 Nov 18;14(1):28485. doi: 10.1038/s41598-024-79474-0. Sci Rep. 2024. PMID: 39557968 Free PMC article.
References
-
- Abdullah Faraji S., Mehmood F., Malik H. M. T., Ahmed I., Heidari P., Poczai P. (2021). The GASA gene family in cacao (Theobroma cacao, Malvaceae): genome wide identification and expression analysis. Agronomy Basel 11, 1425. 10.3390/agronomy11071425 - DOI
LinkOut - more resources
Full Text Sources

