. 2022 May 18;9(5):220129.
doi: 10.1098/rsos.220129. eCollection 2022 May.

Heterogeneity in testing for infectious diseases

Affiliations

Heterogeneity in testing for infectious diseases

Christian Berrig et al. R Soc Open Sci. .

Abstract

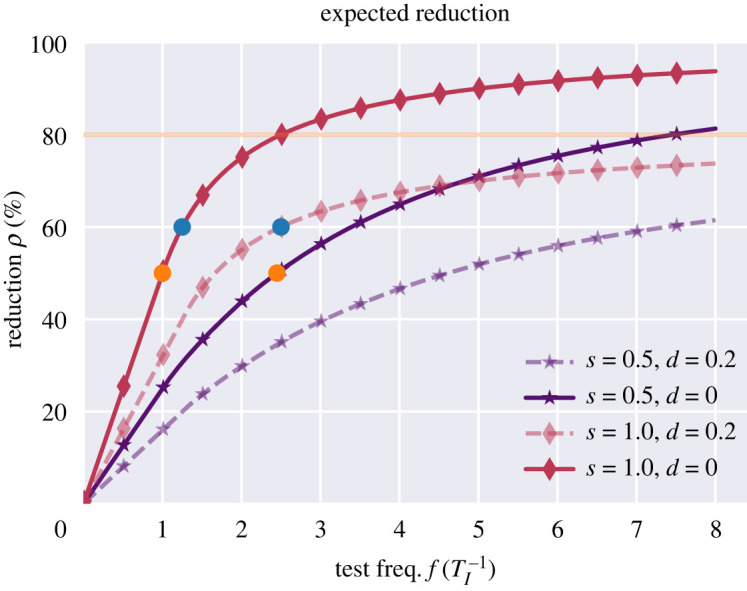
Testing strategies have varied widely between nation states during the COVID-19 pandemic, in intensity as well as methodology. Some countries have mainly performed diagnostic testing while others have opted for mass-screening for the presence of SARS-CoV-2 as well. COVID passport solutions have been introduced, in which access to several aspects of public life requires either testing, proof of vaccination or a combination thereof. This creates a coupling between personal activity levels and testing behaviour which, as we show in a mathematical model, leverages heterogeneous behaviours in a population and turns this heterogeneity from a disadvantage to an advantage for epidemic control.

Keywords: COVID-19; SARS-CoV-2; mitigation; non-pharmaceutical interventions; screening; testing.


Conflict of interest statement

We declare we have no competing interests.

Figures

Figure 1.
Figure 1.
Overall level of testing over time, Danish data [26]. Denmark has employed an extensive SARS-CoV-2 mass screening programme. Assuming an infectious period of five days, the peak level of testing of approx. 4.4 million tests per week (attained around May 2021) in a population of 5.8 million corresponds to an average testing frequency of f0.5 in our model.
Figure 2.
Figure 2.
Efficient regular testing depends strongly on frequency and timeliness of results. The reduction in reproductive number obtained through regular testing is highly dependent on the overall testing frequency. Concretely, assuming an infectious period of five days, a test with a sensitivity of just s=50% performed at an interval of two days is as effective as a perfect-sensitivity test performed every five days (orange dots). However, even a high-frequency testing scheme suffers if results are delayed. With a five-day infectious period, a delay of just one day (d = 0.2) has a sizable impact. Concretely, an instantaneous testing scheme performed every four days is as effective as a delayed one performed every two days (blue dots). The dashed (delayed) lines asymptotically trend toward a maximum reduction value of 80% (orange horizontal line) with increasing test frequency. The delayed perfect-sensitivity test (dashed red line) only does so much more rapidly than its 50% sensitivity counterpart (dashed purple line).
Figure 3.
Figure 3.
Heterogeneous testing behaviours impede mitigation when testing frequency is heterogeneous and uncorrelated with social activity. Note that test sensitivity becomes less important as heterogeneity increases. (a): Reduction as function of dispersion coefficient. The fully drawn lines are for f = 0.5 (purple), the dashed lines are f = 1.0 (red) and the two colours are for, respectively, s = 0.5 and s = 1.0 (b). The dependence of the reduction due to the test-sensitivity decreases as heterogeneity increases (as k → 0)
Figure 4.
Figure 4.
Testing heterogeneity can be turned to an advantage. Here, perfect correlation between social activity and test frequency is assumed. (a) Reduction in the reproductive number as a function of the dispersion coefficient k (lower k corresponding to more pronounced heterogeneity). Note that for the fully correlated case, increased heterogeneity leads to better epidemic control (higher reduction in the reproductive number), in contrast to what was observed in the uncorrelated case (figure 3). (b) The reduction due to regular testing depends less strongly on test sensitivity when heterogeneity is high, in the fully correlated case. The overall dependence is similar to the one observed for the uncorrelated case (figure 3), only more pronounced.
Figure 5.
Figure 5.
Only weak coupling is needed to leverage heterogeneity. Dependency of reduction on the correlation between test frequency and activity. Across all three curves, the test frequency is set at f = 0.5, and the test sensitivity is assumed ideal, i.e. s = 1. Note that the turning point at which heterogeneity becomes an advantage rather than a disadvantage occurs at quite low correlations—as long as a correlation of more than 5% is attained, the heterogeneous scenarios (k = 0.2 and k = 1.0) fare better than the homogeneous one (k → ∞).

Similar articles

Cited by

References

    1. Ritchie H, et al. 2020. Coronavirus Pandemic (COVID-19). Our World in Data. See https://ourworldindata.org/coronavirus.
    1. Yarmol-Matusiak EA, Cipriano LE, Stranges S. 2021. A comparison of COVID-19 epidemiological indicators in Sweden, Norway, Denmark, and Finland. Scand. J. Public Health 49, 69-78. (10.1177/1403494820980264) - DOI - PMC - PubMed
    1. Al-Hosani F, Al-Mazrouei S, Al-Memari S, Al-Yafei Z, Paulo MS, Koornneef E. 2021. A review of COVID-19 mass testing in the United Arab Emirates. Front. Public Health 9, 528. (10.3389/fpubh.2021.661134) - DOI - PMC - PubMed
    1. Holt E. 2021. COVID-19 testing in Slovakia. The Lancet. Infect. Dis. 21, 32. (10.1016/S1473-3099(20)30948-8) - DOI - PMC - PubMed
    1. Frnda J, Durica M. 2021. On pilot massive COVID-19 testing by antigen tests in Europe. case study: Slovakia. Infect. Dis. Rep. 13, 45-57. (10.3390/idr13010007) - DOI - PMC - PubMed

LinkOut - more resources