. 2022 May 19;12(5):e8918.
doi: 10.1002/ece3.8918. eCollection 2022 May.

Small mammal responses to fire severity mediated by vegetation characteristics and species traits

Affiliations

Small mammal responses to fire severity mediated by vegetation characteristics and species traits

Kathryn Culhane et al. Ecol Evol. .

Abstract

The frequency of large, high-severity "mega-fires" has increased in recent decades, with numerous consequences for forest ecosystems. In particular, small mammal communities are vulnerable to post-fire shifts in resource availability and play critical roles in forest ecosystems. Inconsistencies in previous observations of small mammal community responses to fire severity underscore the importance of examining mechanisms regulating the effects of fire severity on post-fire recovery of small mammal communities. We compared small mammal abundance, diversity, and community structure among habitats that burned at different severities, and used vegetation characteristics and small mammal functional traits to predict community responses to fire severity three years after one mega-fire in the Sierra Nevada, California. Using a model-based fourth-corner analysis, we examined how interactions between vegetation variables and small mammal traits associated with their resource use were associated with post-fire small mammal community structure among fire severity categories. Small mammal abundance was similar across fire severity categories, but diversity decreased and community structure shifted as fire severity increased. Differences in small mammal communities were large only between unburned and high-severity sites. Three highly correlated fire-dependent vegetation variables affected by fire and the volume of soft coarse woody debris were associated with small mammal community structures. Furthermore, we found that interactions between vegetation variables and three small mammal traits (feeding guild, primary foraging mode, and primary nesting habit) predicted community structure across fire severity categories. We concluded that resource use was important in regulating small mammal recovery after the fire because vegetation provided required resources to small mammals as determined by their functional traits. Given the mechanistic nature of our analyses, these results may be applicable to other fire-prone forest systems, although it will be important to conduct studies across large biogeographic regions and over long post-fire time periods to assess generality.

Keywords: community structure; fire severity; functional trait; resource use; small mammal.


Figures

FIGURE 1
FIGURE 1
Sites across a fire severity gradient. (a) The area of the 2014 King Fire is shown in red, and the Sierra Nevada ecoregion within California is shown in light gray. (b) Sites were categorized by three fire severity categories (unburned, low/moderate severity, and high severity). (c) Monitoring Trends in Burn Severity scores and in situ % tree mortality was different among categories. Box plots show the median and upper/lower quartiles. Fire severity categories with the same letter are not significantly different. (d) Sites shifted from a mixed yellow‐pine forest to a shrub‐dominated understory across the severity categories
FIGURE 2
FIGURE 2
Small mammal community structure and habitat preferences across fire severity categories three years after the 2014 King Fire, California. (a) Bar plot showing the percentage of unique individuals trapped in each of the three fire severity categories for each of the 11 species captured, with the number of total captures denoted by n. (b) Nonmetric multidimensional scaling (NMDS) plot showing variation in the small mammal community structure across sites. Each point represents a site, with color‐coded ellipses encompassing ±1 standard deviation from the centroid for each category. Arrows represent vectors for vegetation variables, with significant correlations denoted by asterisks. The vegetation variables are soft coarse woody debris (CWD, m3/ha), shrub cover (% cover), forb/grass cover (% cover), litter cover (% cover), tree density (trees/hectare), and PC1T+S+L (representing the first axis of a principal components analysis of the three variables that changed with fire: live tree density, shrub cover, and litter cover). The 11 small mammal species are displayed along each NMDS axis according to their relative association with each axis
FIGURE 3
FIGURE 3
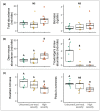
Abundance and diversity metrics across fire severity categories three years after the 2014 King Fire, California. Box plots show median and upper/lower quartiles. Categories in each plot with the same overlying letter are not significantly different. (a) Total small mammal abundance, calculated as the number of unique individuals captured over a 3‐day sampling period at each site, and total small mammal biomass did not differ among fire severity categories. (b) Individual species showed different responses to fire severity categories: deer mice were more abundant at high severity than other sites, whereas Trowbridge's shrews were more abundant at unburned than other sites. (c) Small mammal diversity, quantified as rarefied species richness (number of species per five individuals) and Pielou's index for species evenness, was lower at high severity sites than unburned sites
FIGURE 4
FIGURE 4
Differences in vegetation characteristics among fire severity categories three years after the 2014 King Fire, California. Box plots show median and upper/lower quartiles. Categories in each plot with the same overlying letter are not significantly different. (a) Live tree density and litter cover where lower at high‐severity sites than other sites, whereas shrub cover was higher at high‐severity sites. The first principal component (PC1T + S + L) of live tree density, shrub cover, and litter cover explained 73.4% of the variation in these three variables and was higher at high severity than other sites. (b) Volume of soft coarse woody debris and forb/grass cover was not different among fire severity categories
FIGURE 5
FIGURE 5
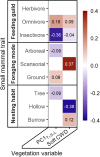
Interaction coefficients between small mammal traits and vegetation variables three years after the 2014 King Fire, California. The heat map shows standardized interaction coefficient estimates from a fourth‐corner model (GLMtrait) after variable selection using the LASSO penalty. Red (positive) and blue (negative) shading intensities represent the interaction strengths between small mammal traits and vegetation variables. Small mammal traits (feeding guild, foraging mode, and nesting habit) are categorical with levels designated on the y‐axis. The two vegetation variables are soft coarse woody debris (CWD m3/ha) and PC1T + S + L (representing the first axis of a principal component analysis for three vegetation variables that changed with fire: live tree density, shrub cover, and litter cover)

References

    1. Abatzoglou, J. T. , & Williams, A. P. (2016). Impact of anthropogenic climate change on wildfire across western US forests. Proceedings of the National Academy of Sciences of the United States of America, 113(42), 11770–11775. 10.1073/pnas.1607171113 - DOI - PMC - PubMed
    1. Agee, J. K. (1998). The landscape ecology of western forest fire regimes. Northwest Science, 72, 24–34.
    1. Andersen, D. C. , & MacMahon, J. A. (1985). The effects of catastrophic ecosystem disturbance: The residual mammals at Mount St. Helens. Journal of Mammalogy, 66(3), 581–589. 10.2307/1380942 - DOI
    1. Apigian, K. O. , Dahlsten, D. L. , & Stephens, S. L. (2006). Fire and fire surrogate treatment effects on leaf litter arthropods in a western Sierra Nevada mixed‐conifer forest. Forest Ecology and Management, 221(1–3), 110–122. 10.1016/j.foreco.2005.09.009 - DOI
    1. Beauvais, G. P. , & Buskirk, S. W. (1999). Modifying estimates of sampling effort to account for sprung traps. Wildlife Society Bulletin, 27, 39–43.