

The phylogeographical pattern of the Amur minnow Rhynchocypris lagowskii (Cypriniformes: Cyprinidae) in the Qinling Mountains
- PMID: 35600689
- PMCID: PMC9108317
- DOI: 10.1002/ece3.8924
The phylogeographical pattern of the Amur minnow Rhynchocypris lagowskii (Cypriniformes: Cyprinidae) in the Qinling Mountains
Abstract
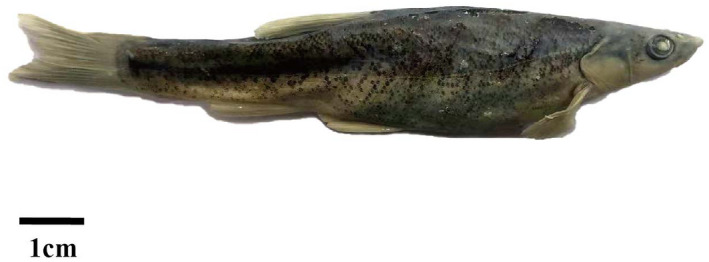
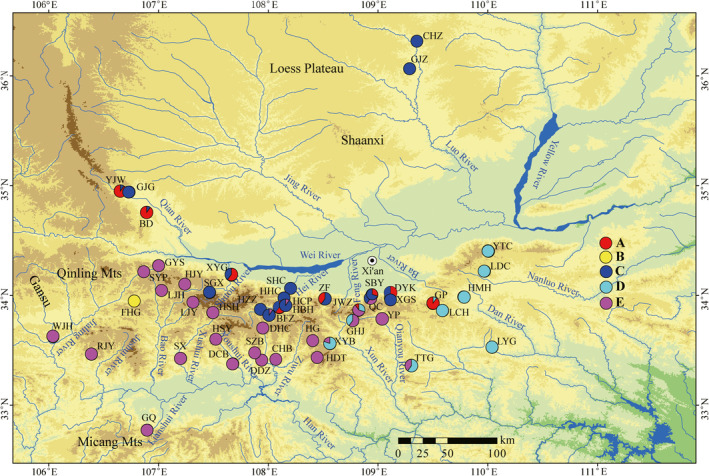
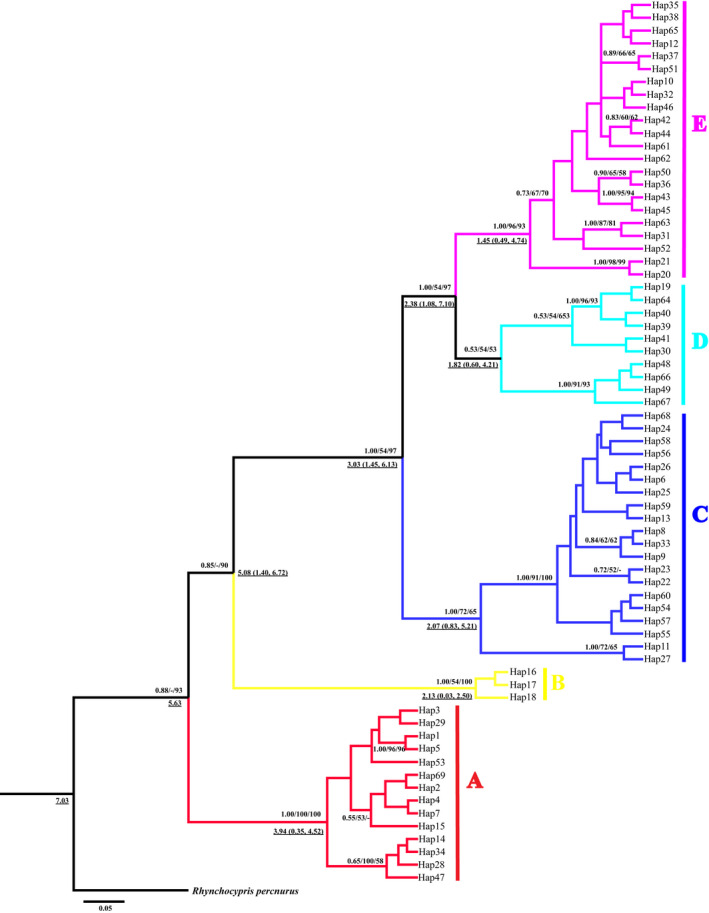
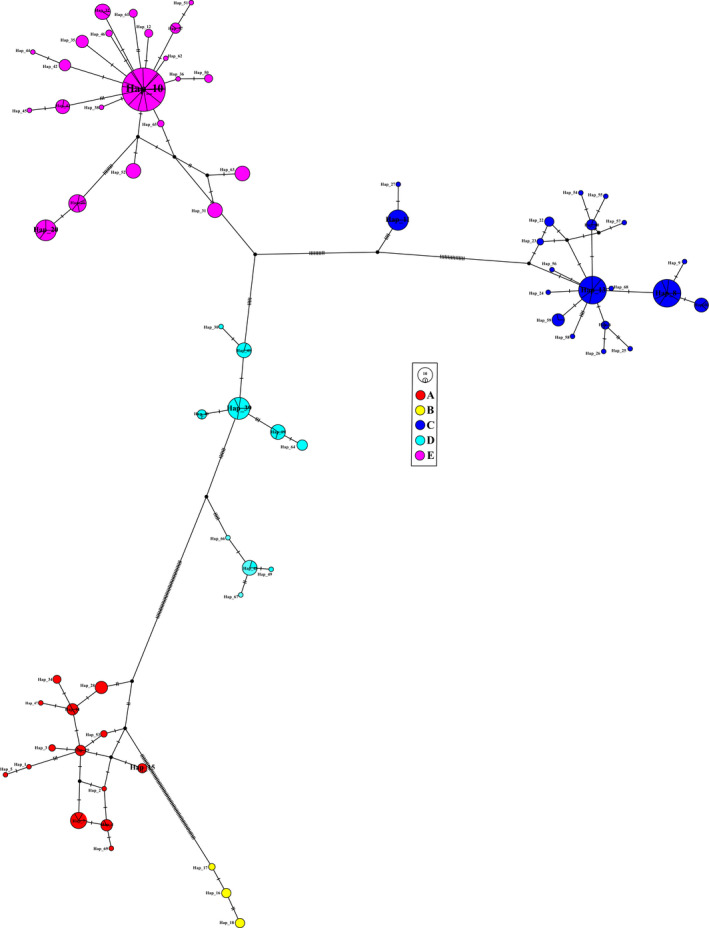
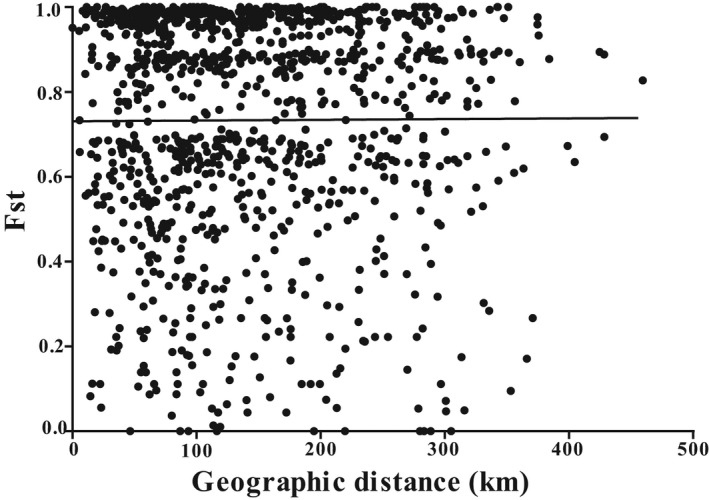
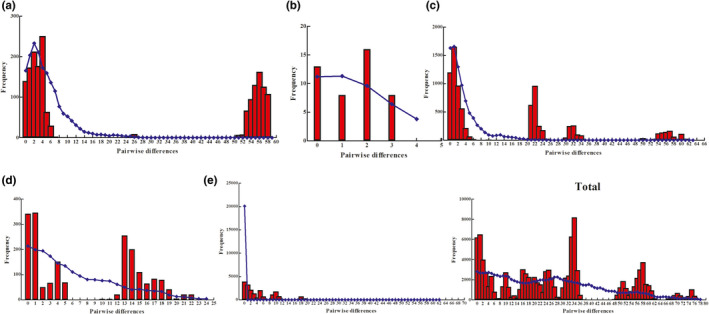
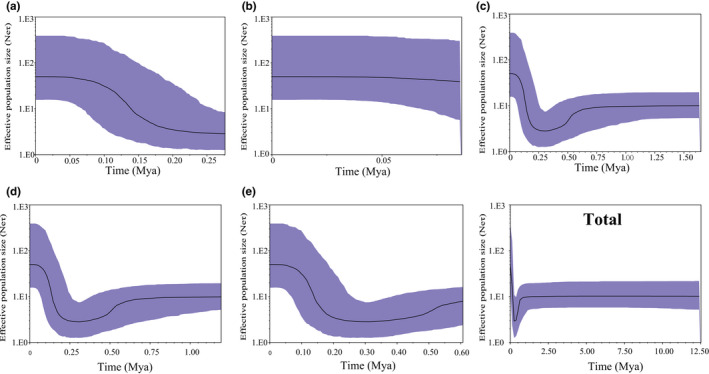
In this study, the phylogeographical pattern of the Amur minnow (Rhynchocypris lagowskii) widely distributed in the cold freshwaters of the Qinling Mountains was examined. A total of 464 specimens from 48 localities were sequenced at a 540-bp region of the mitochondrial cytochrome b (Cytb) gene, and 69 haplotypes were obtained. The mean ratio of the number of synonymous and nonsynonymous substitutions per site (dN/dS) was 0.028 and indicated purifying selection. Haplotype diversity (h) and nucleotide diversity (π) of natural populations of R. lagowskii varied widely between distinct localities. Phylogenetic trees based on Bayesian inference (BI), maximum likelihood (ML), and maximum parsimony (MP) methods, and network analysis showed five well-differentiated lineages, but these did not completely correspond to localities and geographic distribution. Meanwhile, analysis of molecular variances (AMOVA) indicated the highest proportion of genetic variation was attributed to the differentiation between populations rather than by our defined lineages. In addition, there was no significant correlation between the pairwise Fst values and geographic distance (p > .05). Based on the molecular clock calibration, the time to the most recent common ancestor (TMRCA) was estimated to have emerged from the Late Miocene to the Early Pleistocene. Finally, the results of demographic history based on the neutrality test, mismatch distribution, and Bayesian skyline plot (BSP) analyses showed that collectively, the populations were stable during the Pleistocene while one lineage (lineage E) probably underwent a slight contraction during the Middle Pleistocene and a rapid expansion from the Middle to the Late Pleistocene. Therefore, the study suggests the current phylogeographical pattern of R. lagowskii was likely shaped by geological events that led to vicariance followed by dispersal and secondary contact, river capture, and climatic oscillation during the Late Miocene to the Early Pleistocene in the Qinling Mountains.
Keywords: Cytb; Qinling Mountains; Rhynchocypris lagowskii; phylogeographical pattern.
© 2022 The Authors. Ecology and Evolution published by John Wiley & Sons Ltd.
Conflict of interest statement
The authors declare that they have no competing interests.
Figures
References
-
- Albert, J. S. , & Crampton, W. G. R. (2010). The geography and ecology of diversification in Neotropical freshwaters. Nature Education Knowledge, 3(10), 13.
-
- Avise, J. C. (2000). Phylogeography: The history and formation of species. Harvard University Press.
-
- Avise, J. C. , Arnold, J. , Ball, R. M. , Bermingham, E. , Lamb, T. , Neigel, J. E. , Reeb, C. A. , & Saunders, N. C. (1987). Intraspecific phylogeography: The mitochondrial DNA bridge between population genetics and systematics. Annual Review of Ecology and Systematics, 18, 489–522. 10.1146/annurev.es.18.110187.002421 - DOI
Associated data
LinkOut - more resources
Full Text Sources
Research Materials
Miscellaneous
