. 2022 Jun;48(2):279-302.
doi: 10.1111/padr.12475. Epub 2022 Mar 3.

Sensitivity Analysis of Excess Mortality due to the COVID-19 Pandemic

Sensitivity Analysis of Excess Mortality due to the COVID-19 Pandemic

Marília R Nepomuceno et al. Popul Dev Rev. 2022 Jun.

Abstract

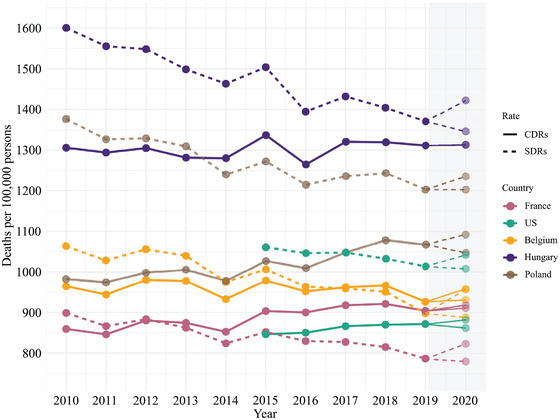
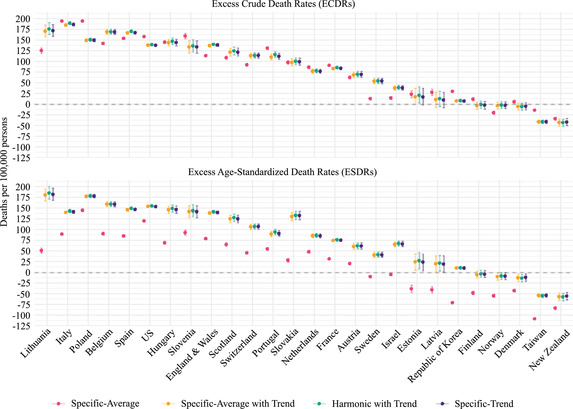
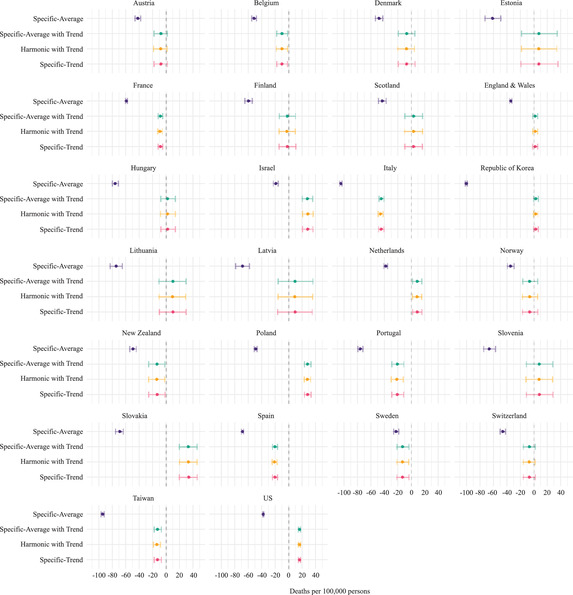
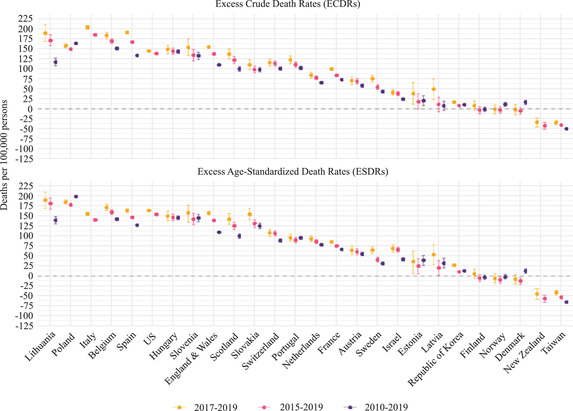
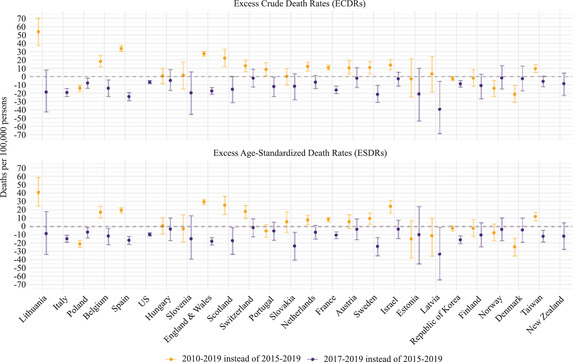
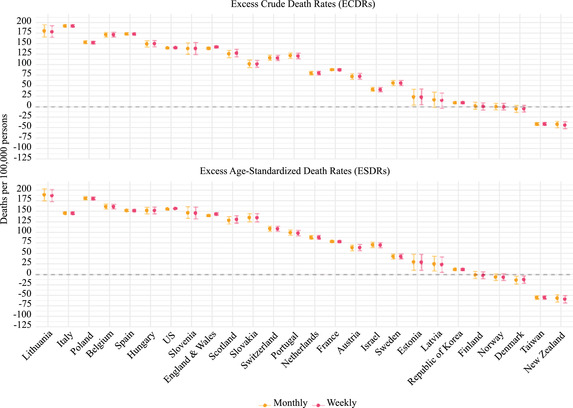
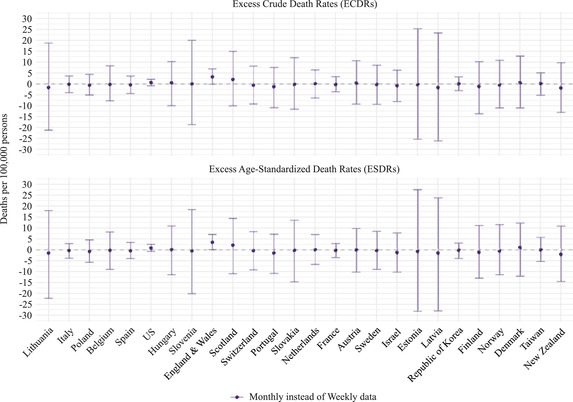
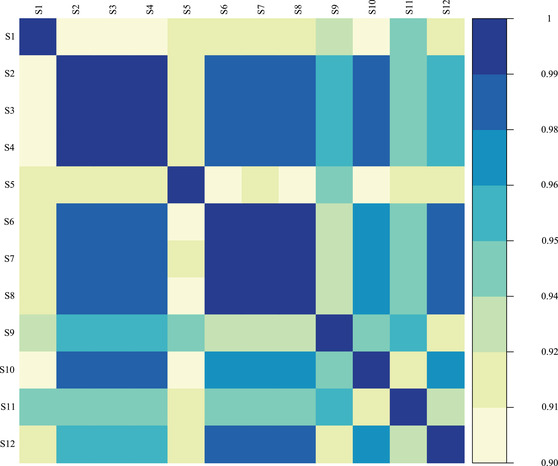
Estimating excess mortality is challenging. The metric depends on the expected mortality level, which can differ based on given choices, such as the method and the time series length used to estimate the baseline. However, these choices are often arbitrary, and are not subject to any sensitivity analysis. We bring to light the importance of carefully choosing the inputs and methods used to estimate excess mortality. Drawing on data from 26 countries, we investigate how sensitive excess mortality is to the choice of the mortality index, the number of years included in the reference period, the method, and the time unit of the death series. We employ two mortality indices, three reference periods, two data time units, and four methods for estimating the baseline. We show that excess mortality estimates can vary substantially when these factors are changed, and that the largest variations stem from the choice of the mortality index and the method. We also find that the magnitude of the variation in excess mortality is country-specific, resulting in cross-country rankings changes. Finally, based on our findings, we provide guidelines for estimating excess mortality.

Keywords: COVID‐19; country comparison; excess mortality.


Figures

FIGURE 1
FIGURE 1
Observed CDRs and SDRs in France, the United States, Belgium, Hungary, and Poland in 2010–2019, and their expected values in 2020 NOTES: The values for 2020 are the expected death rates derived from Scenario 1 and Scenario 5 (Specific‐Average) for the SDRs and Scenario 2 and Scenario 6 (Specific‐Average with Trend) for the CDRs. These scenarios are based on the 2015–2019 reference period and weekly data. The gray area highlights the expected values. SOURCES: Jdanov et al. (2021) and European Commission (2013).
FIGURE 2
FIGURE 2
Excess mortality rates by varying the method for each mortality index and country, 2020 NOTES: The reference period is 2015–2019, and the data time unit is weekly (see Table 1 for more details). 95% confidence intervals are based on Monte Carlo simulation. SOURCES: Jdanov et al. (2021) and European Commission (2013).
FIGURE 3
FIGURE 3
Differences between the excess age‐standardized death rates (ESDRs) and the excess CDRs (ECDRs) values for each method used to estimate the baseline mortality, 2020 NOTES: The differences are computed as excess SDR minus excess CDR. The reference period is 2015–2019, and the data time unit is weekly (see Table 1 for more details). 95% confidence intervals are based on Monte Carlo simulation. SOURCES: Jdanov et al. (2021) and European Commission (2013).
FIGURE 4
FIGURE 4
Excess mortality rates by varying the reference period for each mortality index and country, 2020 NOTES: The method used to estimate the baseline is the Specific‐Average with Trend, and the data time unit is weekly. The Italian and the New Zealand data series start in 2011, and the US data series start in 2015. 95% confidence intervals are based on Monte Carlo simulation. SOURCES: Jdanov et al. (2021) and European Commission (2013).
FIGURE 5
FIGURE 5
Differences in excess mortality rates by varying the reference period for each mortality index and country, 2020 NOTES: The differences are computed as excess mortality derived from the 2015–2019 reference period minus excess mortality derived from 2010–2019 or 2017–2019 reference period. The method used to estimate the baseline is the Specific‐Average with Trend, and the data time unit is weekly. The Italian and the New Zealand data series starts in 2011, and the US data series starts in 2015. 95% confidence intervals are based on Monte Carlo simulation. SOURCES: Jdanov et al. (2021) and European Commission (2013).
FIGURE 6
FIGURE 6
Excess mortality rates by varying the time unit of the death series for each mortality index and country, 2020 NOTES: The method used to estimate the baseline is the Harmonic with Trend, and the reference period is 2015–2019. 95% confidence intervals are based on Monte Carlo simulation. SOURCES: Jdanov et al. (2021) and European Commission (2013).
FIGURE 7
FIGURE 7
Differences in excess mortality rates by using monthly instead of weekly data, for each mortality index and country, 2020 NOTES: The differences are computed as excess mortality derived from the weekly death series minus excess mortality derived from the monthly death series. The method used to estimate the baseline is the Harmonic with Trend, and the reference period is 2015–2019. 95% confidence intervals are based on Monte Carlo simulation. SOURCES: Jdanov et al. (2021) and European Commission (2013).
FIGURE 8
FIGURE 8
Spearman's correlation coefficients between excess mortality rankings for the 12 scenarios across the 26 countries, 2020 SOURCE: Authors’ elaboration.

References

    1. Aburto, Jose Manuel , Kashyap Ridhi, Schöley Jonas, Angus Colin, Ermisch John, Mills Melinda C., and Dowd Jennifer Beam. 2021. “Estimating the Burden of the COVID‐19 Pandemic on Mortality, Life Expectancy and Lifespan Inequality in England and Wales: A Population‐Level Analysis.” Journal of Epidemiology and Community Health, 75: 735–740. 10.1136/jech-2020-215505. - DOI - PMC - PubMed
    1. Ackley, Calvin A. , Lundberg Dielle J., Elo Irma T., Preston Samuel H., and Stokes Andrew C.. 2021. “County‐Level Estimates of Excess Mortality Associated with COVID‐19 in the United States.” MedRxiv : The Preprint Server for Health Sciences. 10.1101/2021.04.23.21255564. - DOI - PMC - PubMed
    1. Andreev, Evgueni M. , and Shkolnikov Vladimir M.. 2010. “Spreadsheet for Calculation of Confidence Limits for Any Life Table or Healthy‐Life Table Quantity.” MPIDR Technical Report TR‐2010‐005. 10.4054/MPIDR-TR-2010-005. - DOI
    1. Barbieri, Magali , Wilmoth John R., Shkolnikov Vladimir M., Glei Dana, Jasilionis Domantas, Jdanov Dmitri, Boe Carl, Riffe Timothy, Grigoriev Pavel, and Winant Celeste. 2015. “Data Resource Profile: The Human Mortality Database (HMD).” International Journal of Epidemiology 44(5): 1549–1556. 10.1093/ije/dyv105. - DOI - PMC - PubMed
    1. Basellini, Ugofilippo , Alburez‐Gutierrez Diego, Del Fava Emanuele, Perrotta Daniela, Bonetti Marco, Camarda Carlo G., and Zagheni Emilio. 2021. “Linking Excess Mortality to Mobility Data during the First Wave of COVID‐19 in England and Wales.” SSM – Population Health 14(June): 100799. 10.1016/j.ssmph.2021.100799. - DOI - PMC - PubMed

LinkOut - more resources